
Machine Learning for Healthcare Data Katherine A Heller










- Slides: 67
Machine Learning for Healthcare Data Katherine A. Heller Duke University
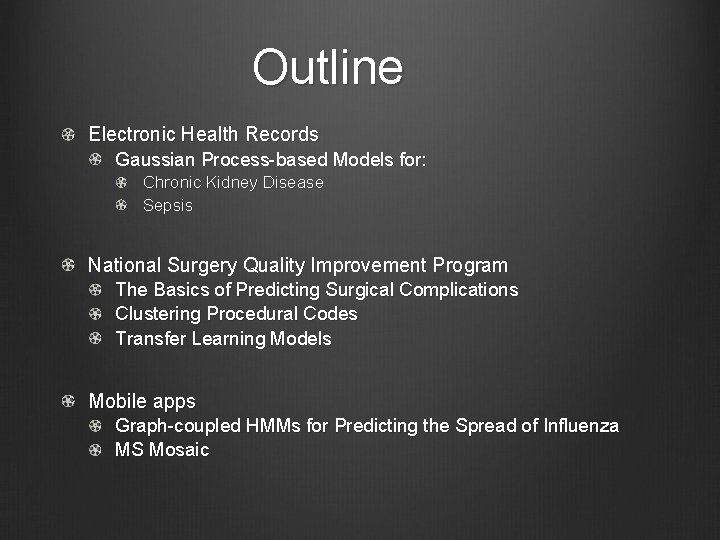
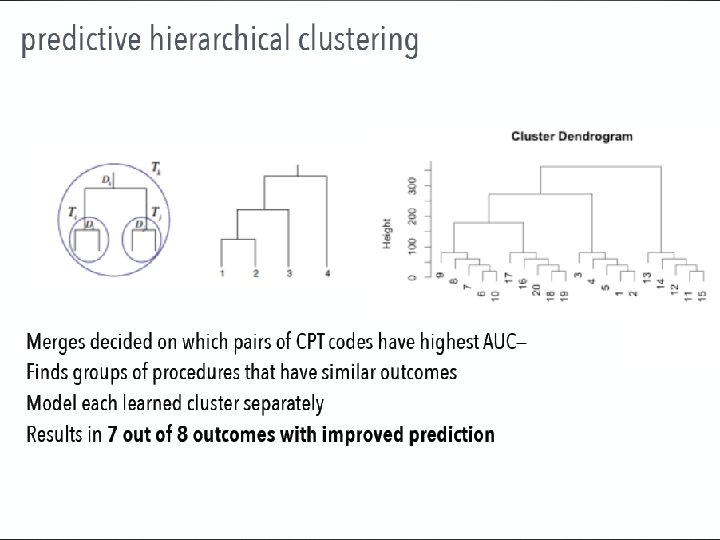
Outline Electronic Health Records Gaussian Process-based Models for: Chronic Kidney Disease Sepsis National Surgery Quality Improvement Program The Basics of Predicting Surgical Complications Clustering Procedural Codes Transfer Learning Models Mobile apps Graph-coupled HMMs for Predicting the Spread of Influenza MS Mosaic
Chronic Kidney Disease
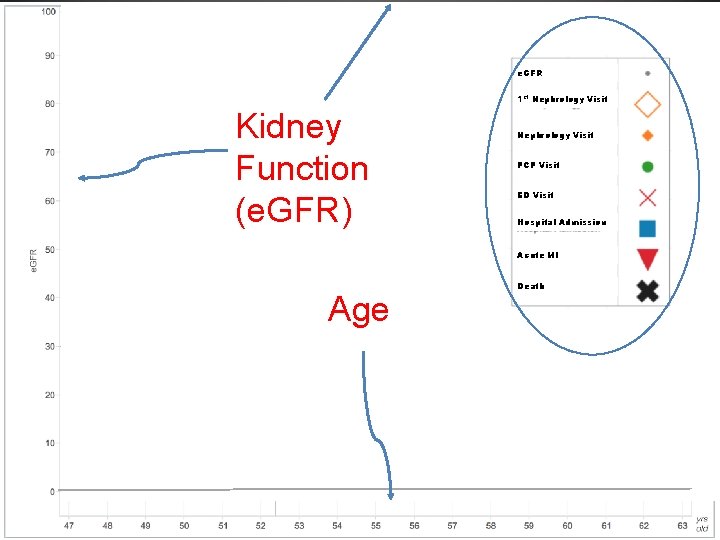
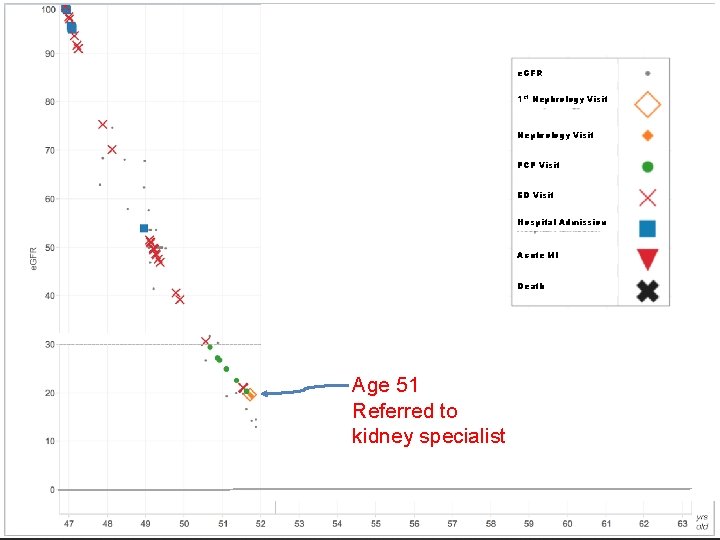
e. GFR 1 st Nephrology Visit Kidney Function (e. GFR) Nephrology Visit PCP Visit ED Visit Hospital Admission Acute MI Age Death
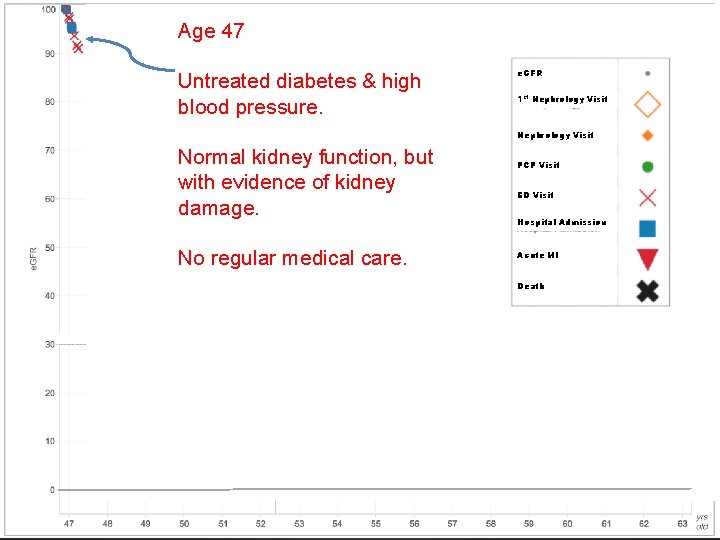
Age 47 Untreated diabetes & high blood pressure. e. GFR 1 st Nephrology Visit Normal kidney function, but with evidence of kidney damage. No regular medical care. PCP Visit ED Visit Hospital Admission Acute MI Death
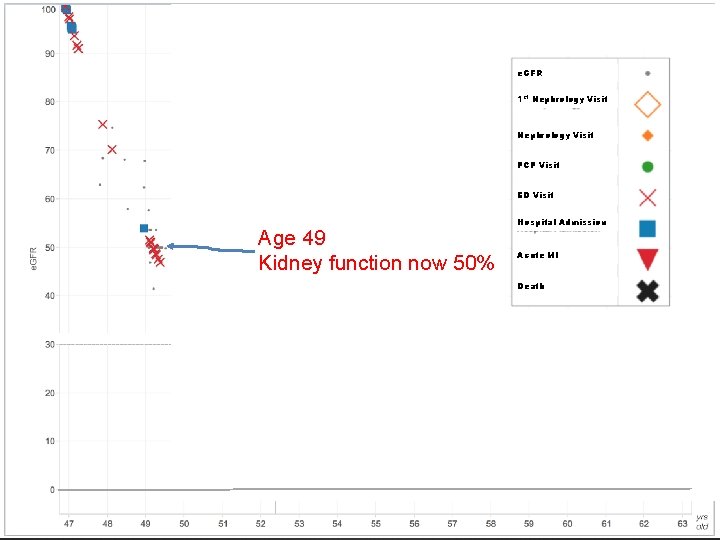
e. GFR 1 st Nephrology Visit PCP Visit ED Visit Age 49 Kidney function now 50% Hospital Admission Acute MI Death
e. GFR 1 st Nephrology Visit PCP Visit ED Visit Hospital Admission Acute MI Death Age 51 Referred to kidney specialist
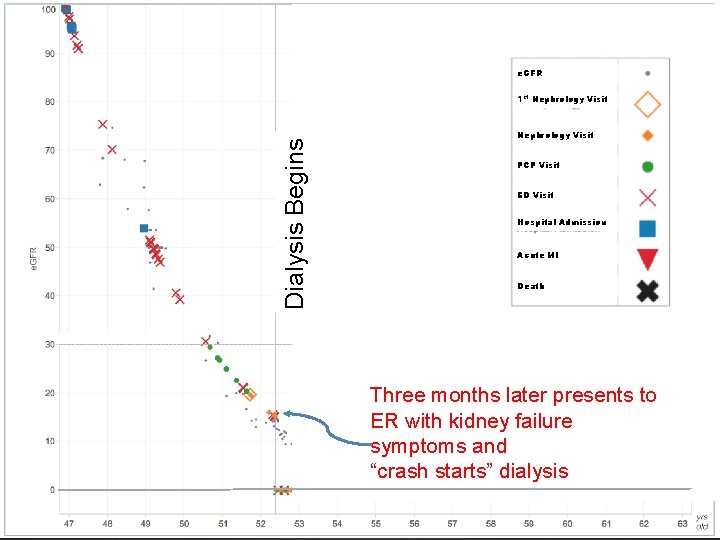
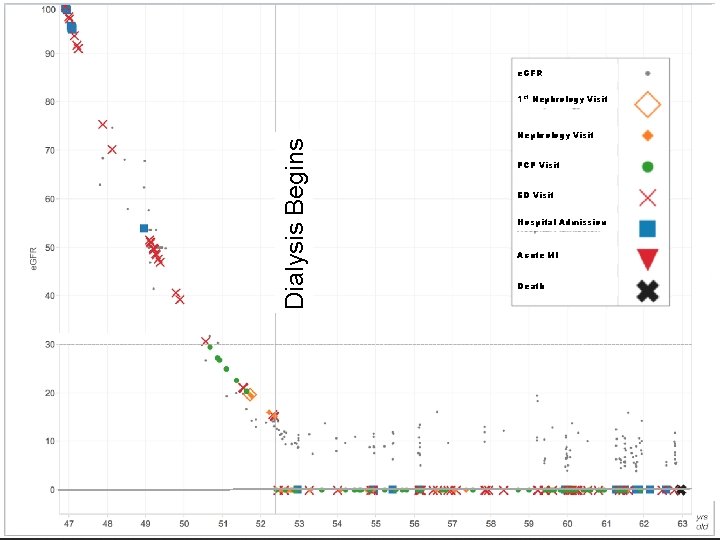
e. GFR Dialysis Begins 1 st Nephrology Visit PCP Visit ED Visit Hospital Admission Acute MI Death Three months later presents to ER with kidney failure symptoms and “crash starts” dialysis
e. GFR Dialysis Begins 1 st Nephrology Visit PCP Visit ED Visit Hospital Admission Acute MI Death
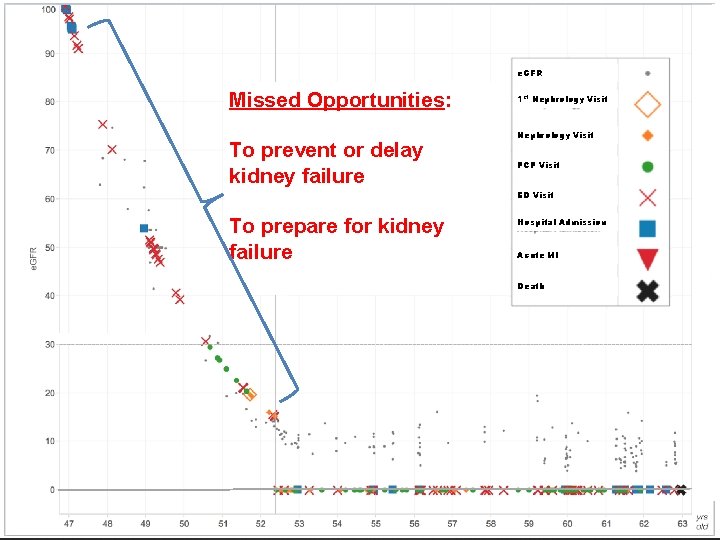
e. GFR Missed Opportunities: To prevent or delay kidney failure 1 st Nephrology Visit PCP Visit ED Visit To prepare for kidney failure Hospital Admission Acute MI Death
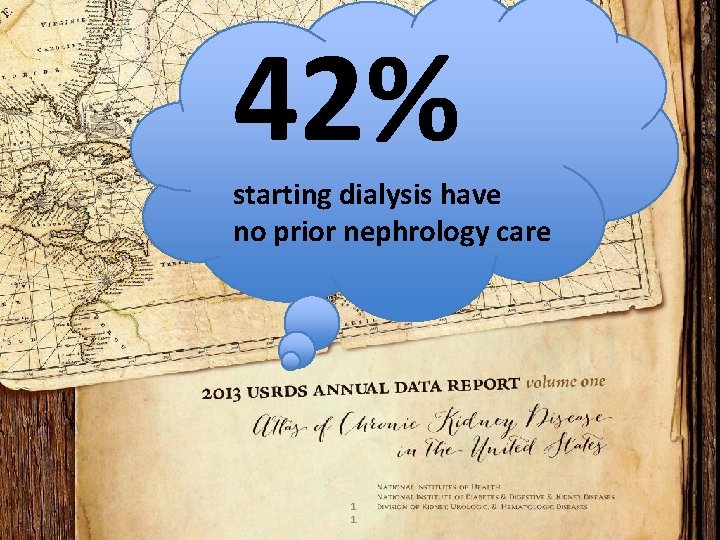
42% starting dialysis have no prior nephrology care 1 1
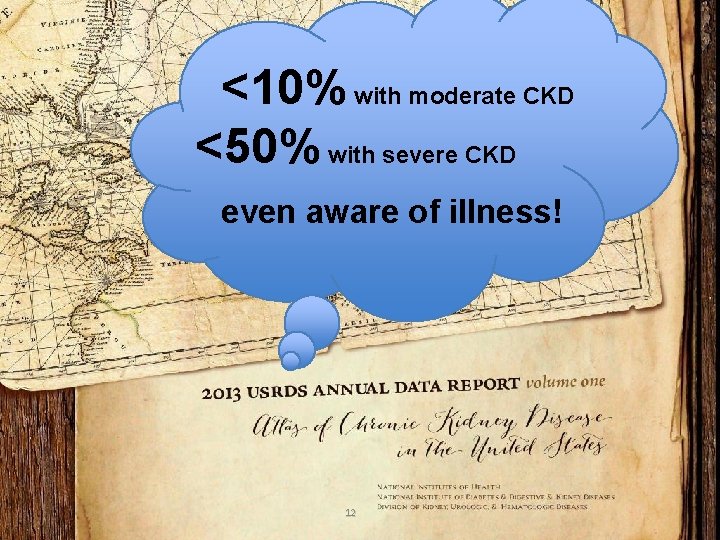
<10% with moderate CKD <50% with severe CKD even aware of illness! 12
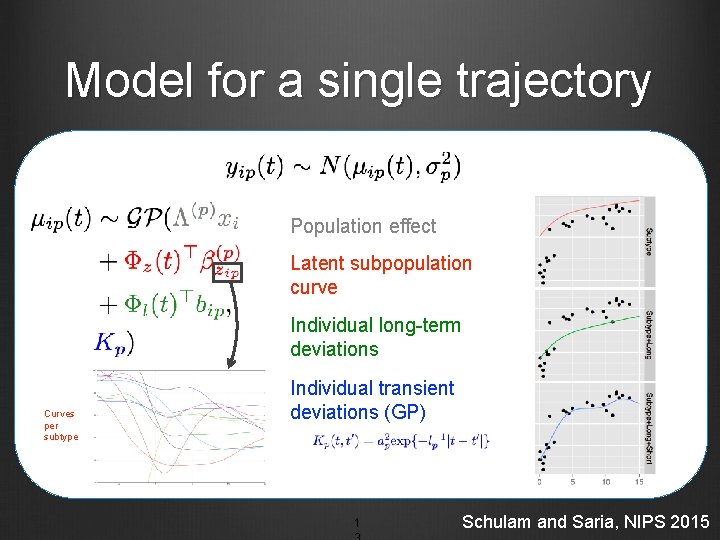
Model for a single trajectory Population effect Latent subpopulation curve Individual long-term deviations Curves per subtype Individual transient deviations (GP) 1 Schulam and Saria, NIPS 2015
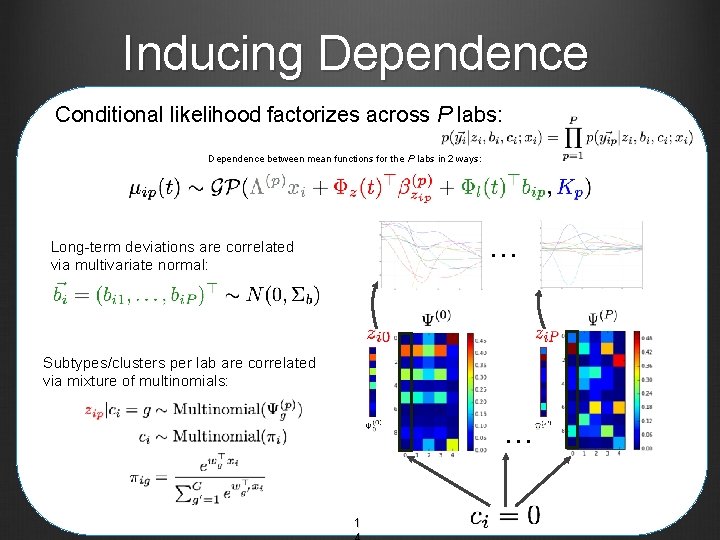
Inducing Dependence Conditional likelihood factorizes across P labs: Dependence between mean functions for the P labs in 2 ways: … Long-term deviations are correlated via multivariate normal: Subtypes/clusters per lab are correlated via mixture of multinomials: … 1
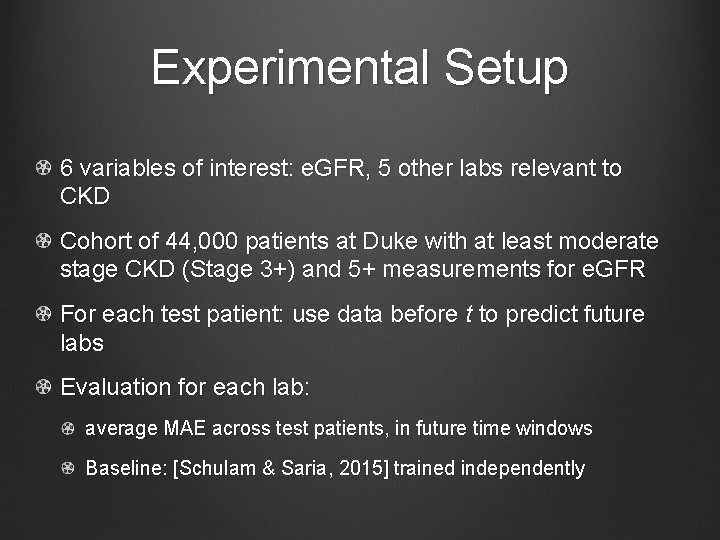
Experimental Setup 6 variables of interest: e. GFR, 5 other labs relevant to CKD Cohort of 44, 000 patients at Duke with at least moderate stage CKD (Stage 3+) and 5+ measurements for e. GFR For each test patient: use data before t to predict future labs Evaluation for each lab: average MAE across test patients, in future time windows Baseline: [Schulam & Saria, 2015] trained independently
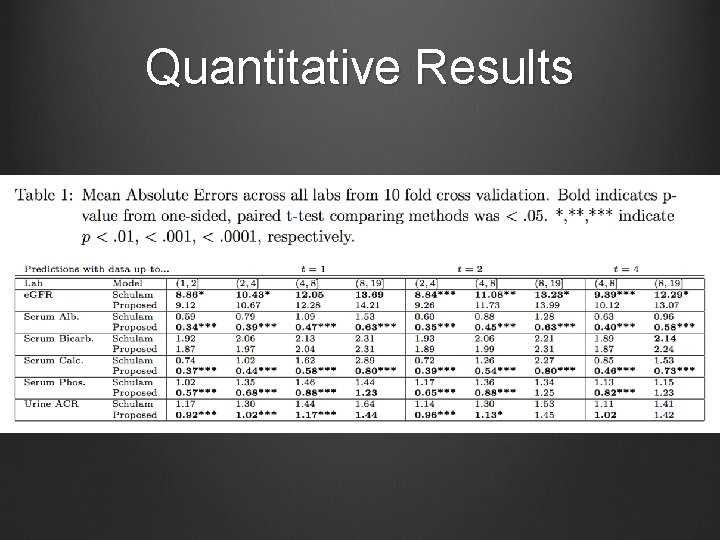
Quantitative Results
Chronic Kidney Disease (CKD) Heart disease Diabetes 1 7
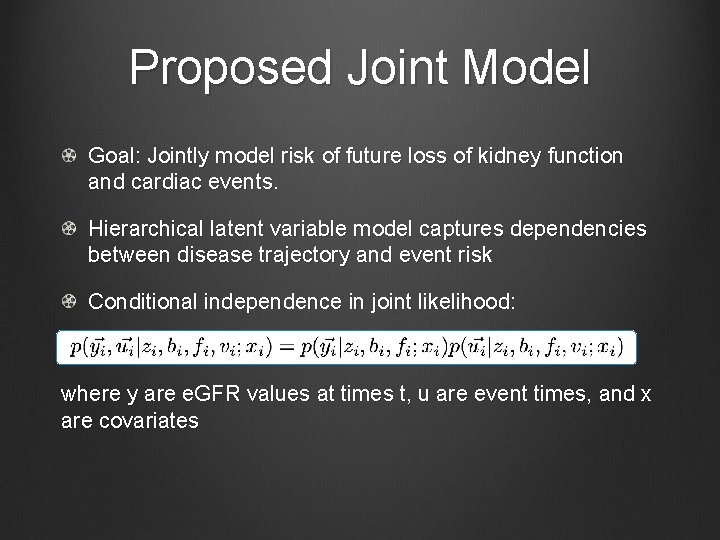
Proposed Joint Model Goal: Jointly model risk of future loss of kidney function and cardiac events. Hierarchical latent variable model captures dependencies between disease trajectory and event risk Conditional independence in joint likelihood: where y are e. GFR values at times t, u are event times, and x are covariates
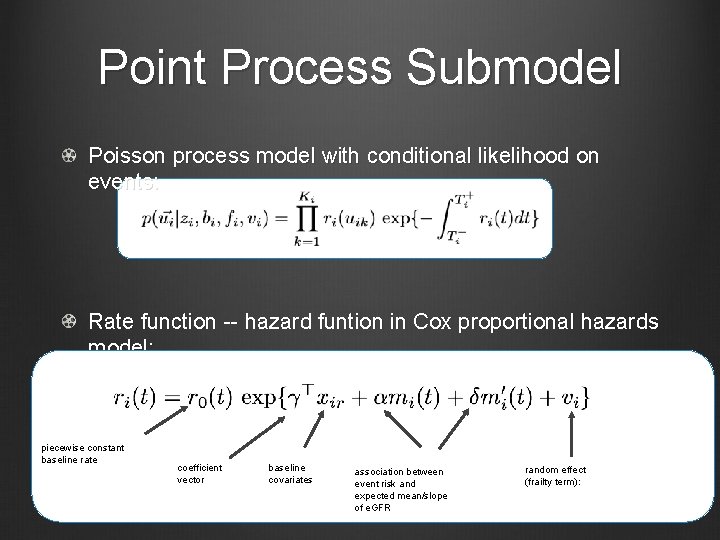
Point Process Submodel Poisson process model with conditional likelihood on events: Rate function -- hazard funtion in Cox proportional hazards model: piecewise constant baseline rate coefficient vector baseline covariates association between event risk and expected mean/slope of e. GFR random effect (frailty term):
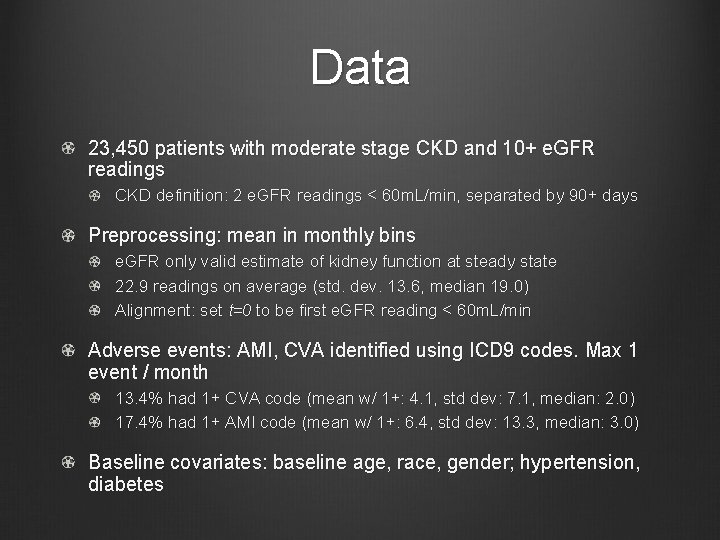
Data 23, 450 patients with moderate stage CKD and 10+ e. GFR readings CKD definition: 2 e. GFR readings < 60 m. L/min, separated by 90+ days Preprocessing: mean in monthly bins e. GFR only valid estimate of kidney function at steady state 22. 9 readings on average (std. dev. 13. 6, median 19. 0) Alignment: set t=0 to be first e. GFR reading < 60 m. L/min Adverse events: AMI, CVA identified using ICD 9 codes. Max 1 event / month 13. 4% had 1+ CVA code (mean w/ 1+: 4. 1, std dev: 7. 1, median: 2. 0) 17. 4% had 1+ AMI code (mean w/ 1+: 6. 4, std dev: 13. 3, median: 3. 0) Baseline covariates: baseline age, race, gender; hypertension, diabetes
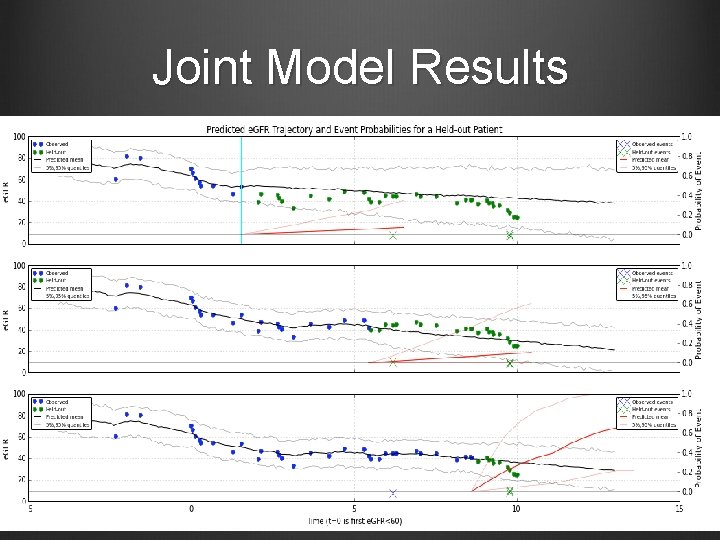
Joint Model Results
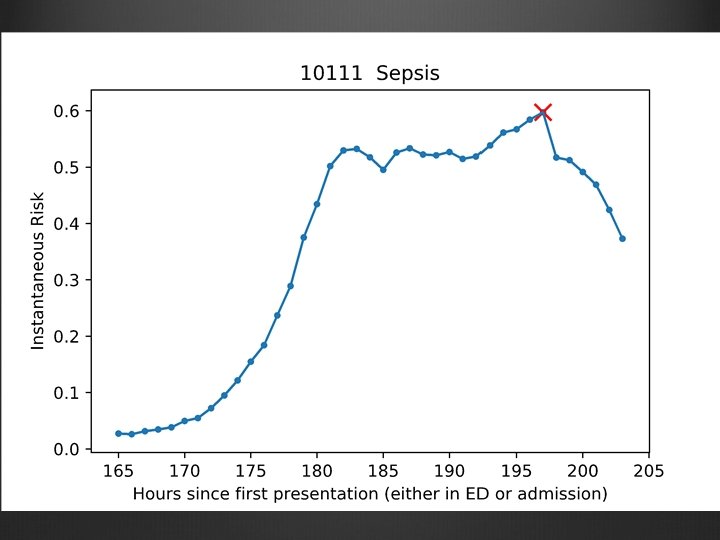
Sepsis
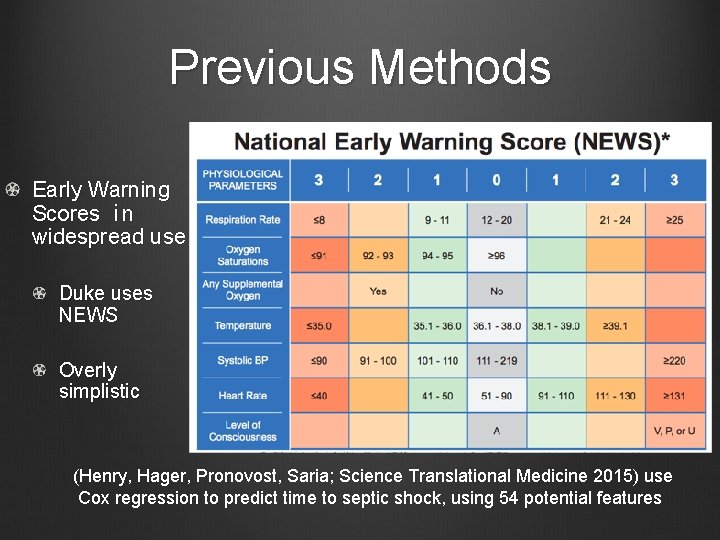
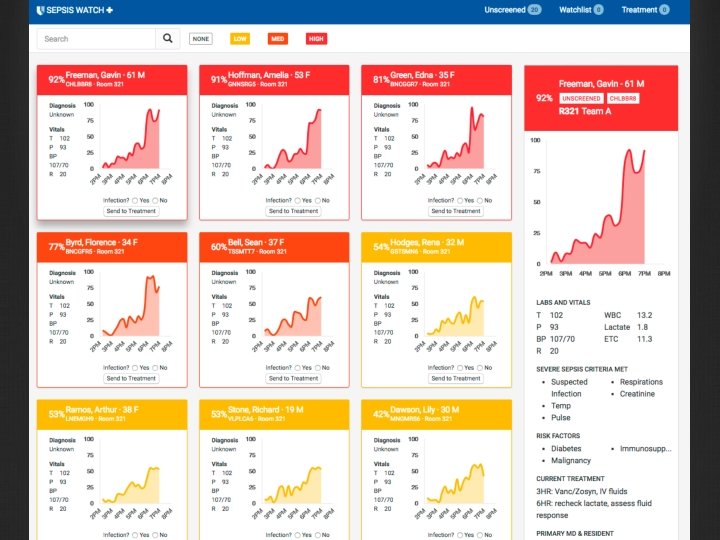
Previous Methods Early Warning Scores in widespread use Duke uses NEWS Overly simplistic (Henry, Hager, Pronovost, Saria; Science Translational Medicine 2015) use Cox regression to predict time to septic shock, using 54 potential features
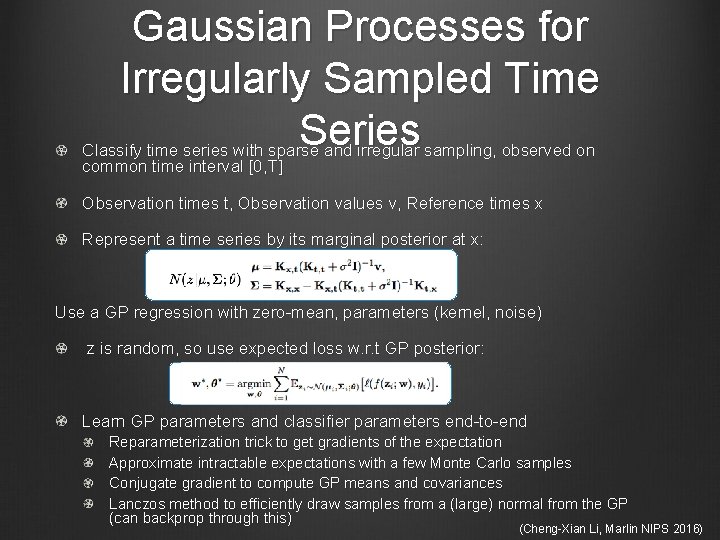
Gaussian Processes for Irregularly Sampled Time Series Classify time series with sparse and irregular sampling, observed on common time interval [0, T] Observation times t, Observation values v, Reference times x Represent a time series by its marginal posterior at x: Use a GP regression with zero-mean, parameters (kernel, noise) z is random, so use expected loss w. r. t GP posterior: Learn GP parameters and classifier parameters end-to-end Reparameterization trick to get gradients of the expectation Approximate intractable expectations with a few Monte Carlo samples Conjugate gradient to compute GP means and covariances Lanczos method to efficiently draw samples from a (large) normal from the GP (can backprop through this) (Cheng-Xian Li, Marlin NIPS 2016)
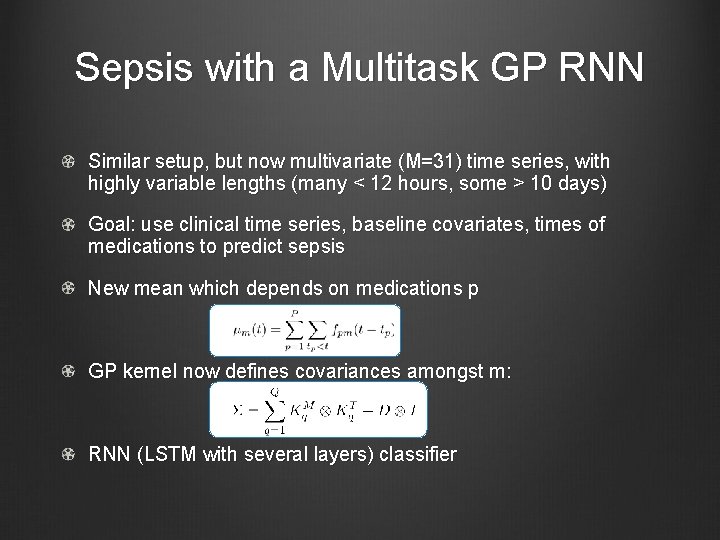
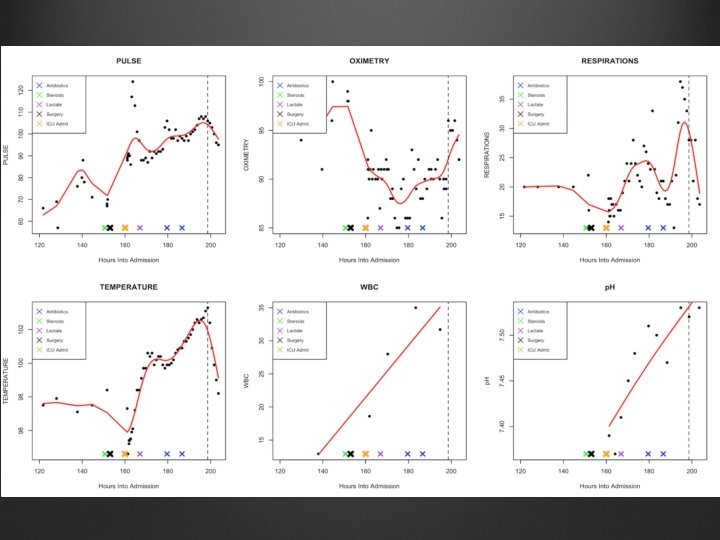
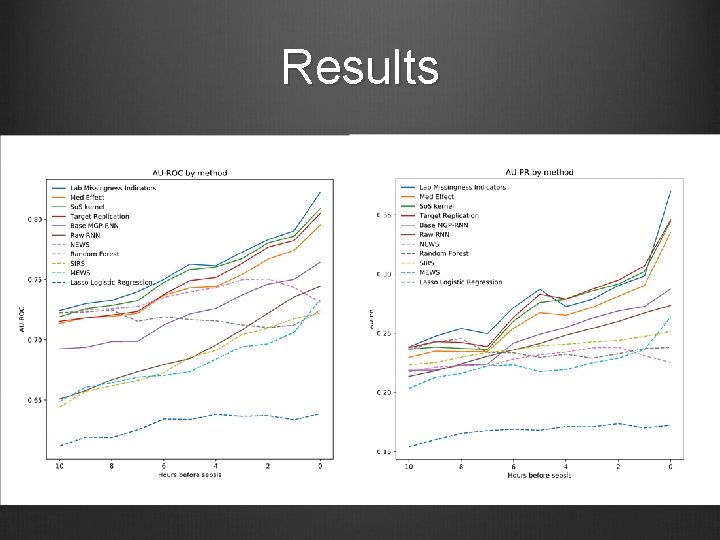
Sepsis with a Multitask GP RNN Similar setup, but now multivariate (M=31) time series, with highly variable lengths (many < 12 hours, some > 10 days) Goal: use clinical time series, baseline covariates, times of medications to predict sepsis New mean which depends on medications p GP kernel now defines covariances amongst m: RNN (LSTM with several layers) classifier
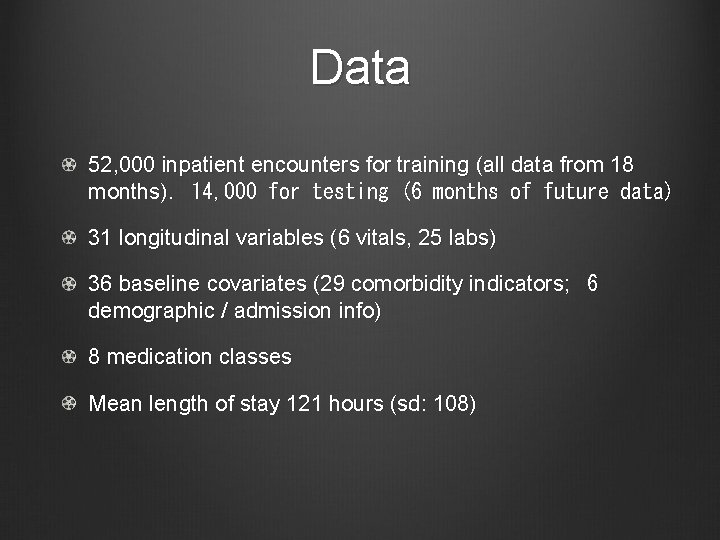
Data 52, 000 inpatient encounters for training (all data from 18 months). 14, 000 for testing (6 months of future data) 31 longitudinal variables (6 vitals, 25 labs) 36 baseline covariates (29 comorbidity indicators; 6 demographic / admission info) 8 medication classes Mean length of stay 121 hours (sd: 108)
Results
Surgery
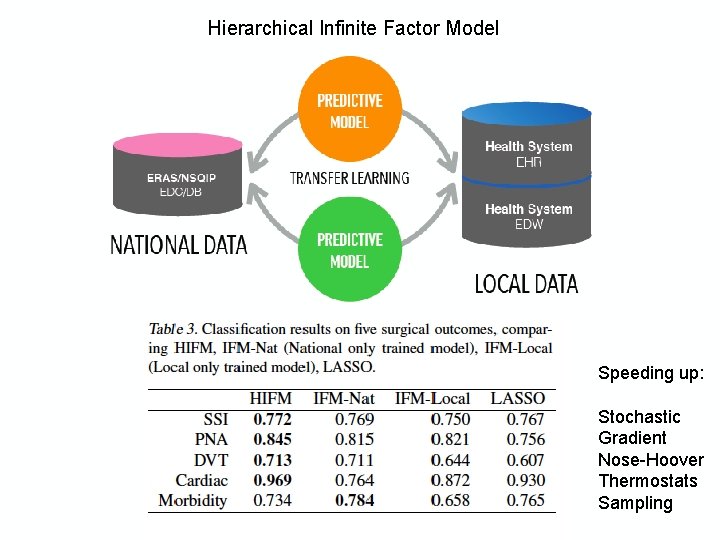
Hierarchical Infinite Factor Model Speeding up: Stochastic Gradient Nose-Hoover Thermostats Sampling
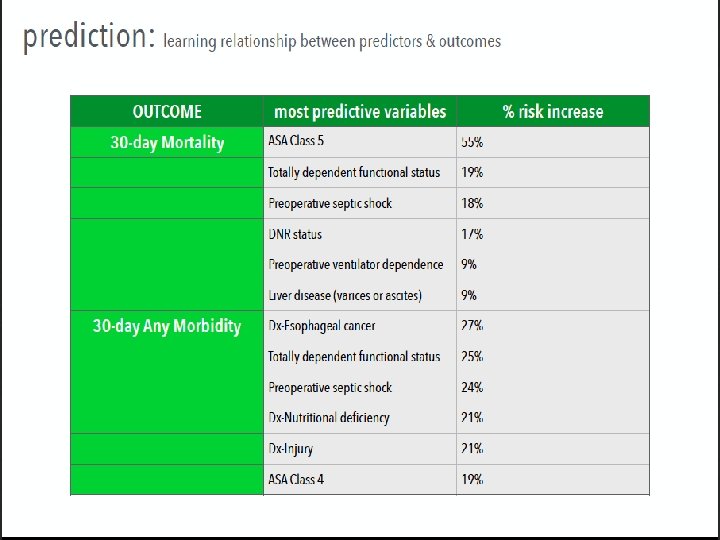
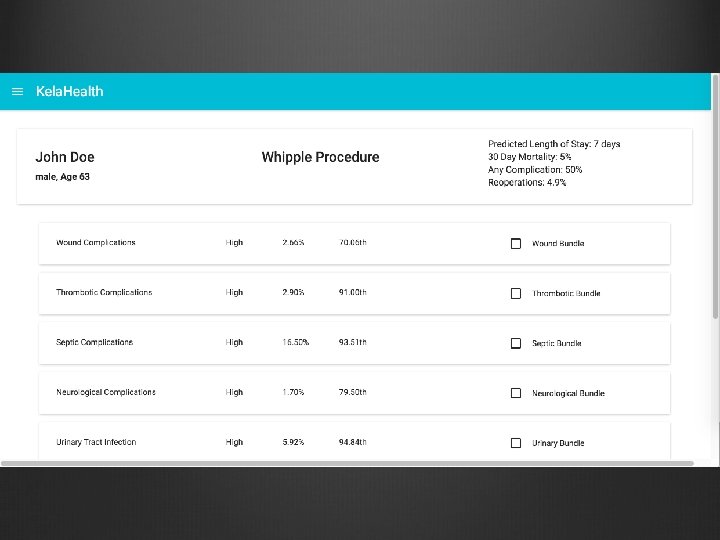
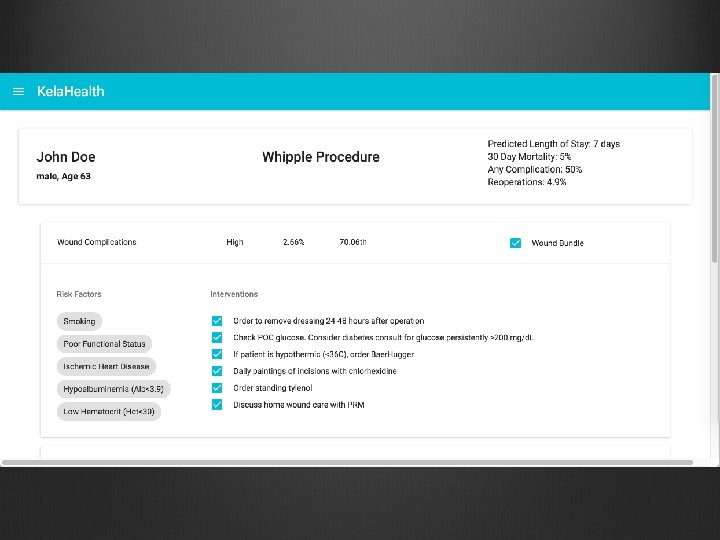
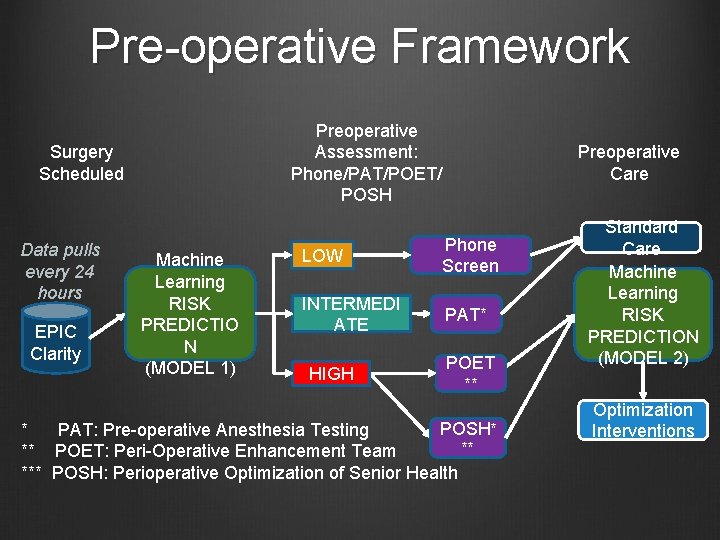
Pre-operative Framework Preoperative Assessment: Phone/PAT/POET/ POSH Surgery Scheduled Data pulls every 24 hours EPIC Clarity Machine Learning RISK PREDICTIO N (MODEL 1) Preoperative Care LOW Phone Screen INTERMEDI ATE PAT* HIGH POET ** POSH* * PAT: Pre-operative Anesthesia Testing ** ** POET: Peri-Operative Enhancement Team *** POSH: Perioperative Optimization of Senior Health Standard Care Machine Learning RISK PREDICTION (MODEL 2) Optimization Interventions
Infectious Disease
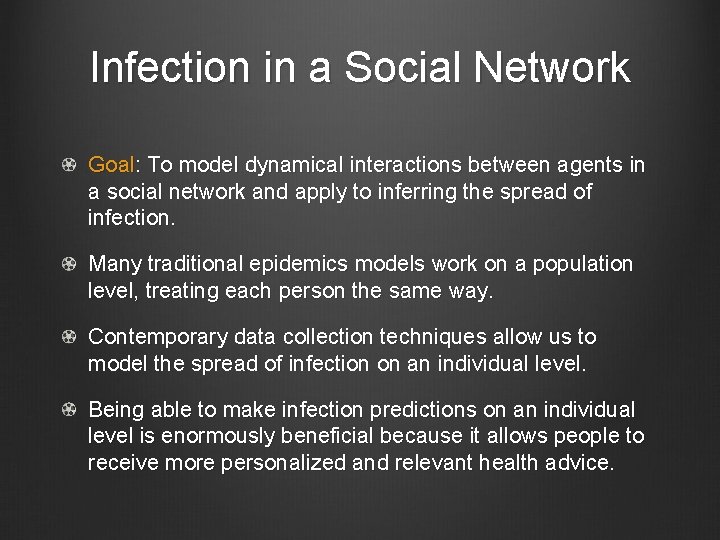
Infection in a Social Network Goal: To model dynamical interactions between agents in a social network and apply to inferring the spread of infection. Many traditional epidemics models work on a population level, treating each person the same way. Contemporary data collection techniques allow us to model the spread of infection on an individual level. Being able to make infection predictions on an individual level is enormously beneficial because it allows people to receive more personalized and relevant health advice.
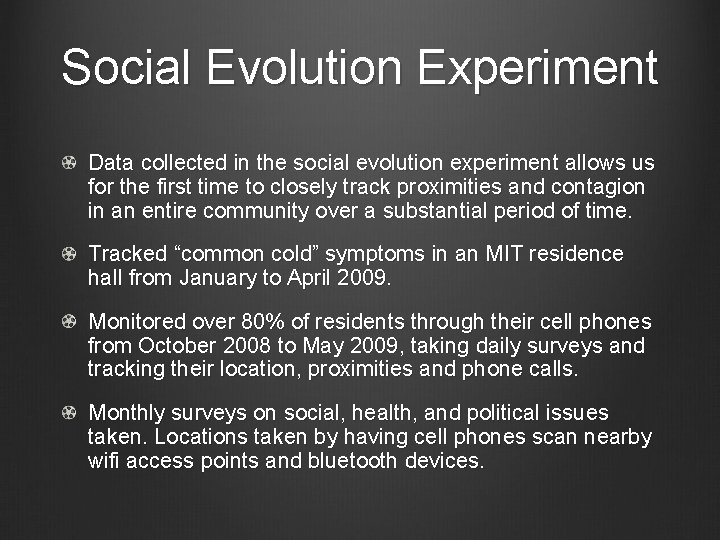
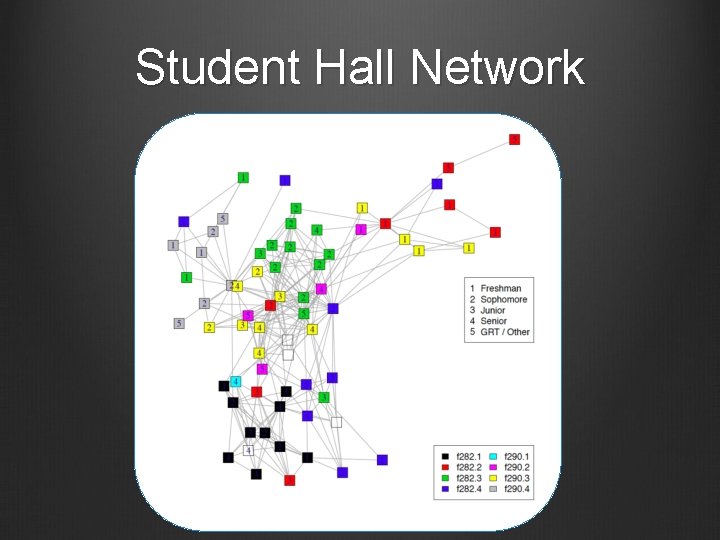
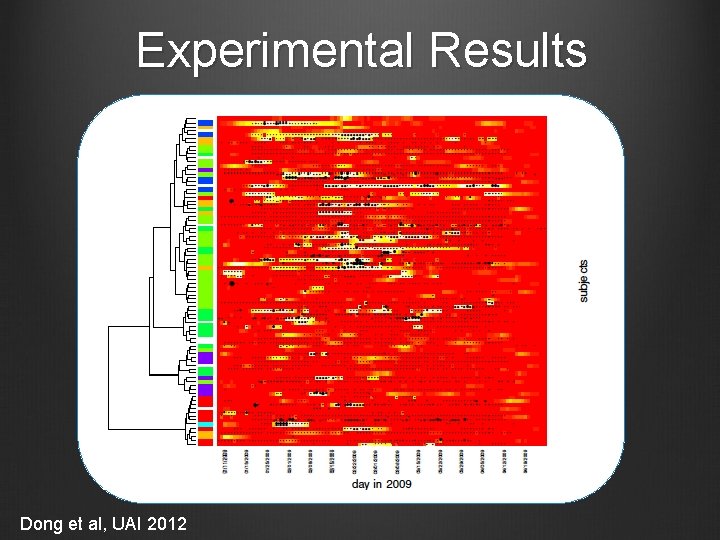
Social Evolution Experiment Data collected in the social evolution experiment allows us for the first time to closely track proximities and contagion in an entire community over a substantial period of time. Tracked “common cold” symptoms in an MIT residence hall from January to April 2009. Monitored over 80% of residents through their cell phones from October 2008 to May 2009, taking daily surveys and tracking their location, proximities and phone calls. Monthly surveys on social, health, and political issues taken. Locations taken by having cell phones scan nearby wifi access points and bluetooth devices.
Student Hall Network
Health Surveys In the Social Evolution experiment students were paid $1 a day to answer surveys about contracting infection. The surveys asked about symptoms: Runny nose, nasal congestion, sneezing Nausea, vomiting, diarrhea Stress Sadness and depression Fever 64 of the 85 residents answered the surveys Symptoms dependent on the social network. A student with a symptom had a 3 -10 x higher odds of having a friend with the same symptom.
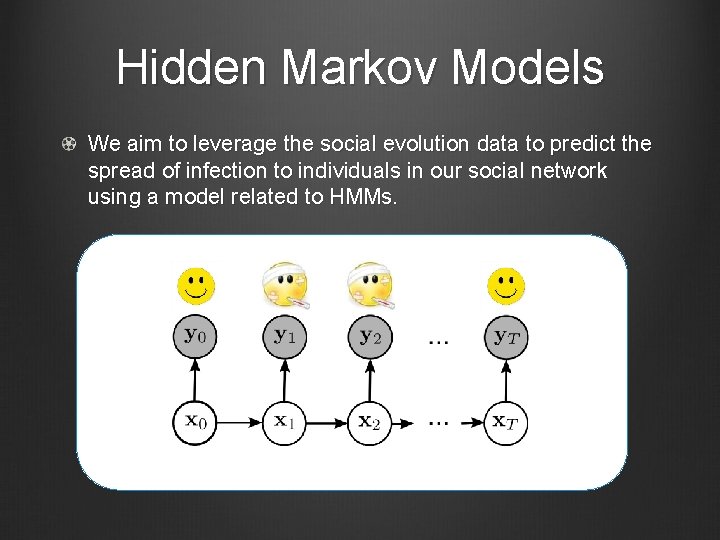
Hidden Markov Models We aim to leverage the social evolution data to predict the spread of infection to individuals in our social network using a model related to HMMs.
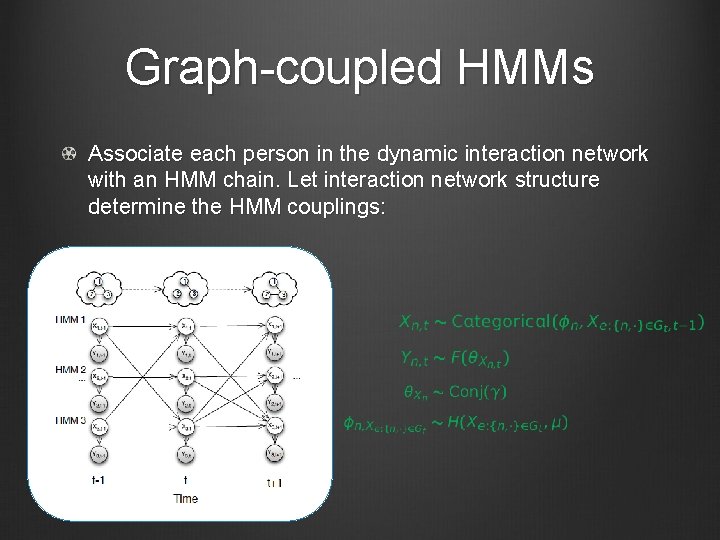
Graph-coupled HMMs Associate each person in the dynamic interaction network with an HMM chain. Let interaction network structure determine the HMM couplings:
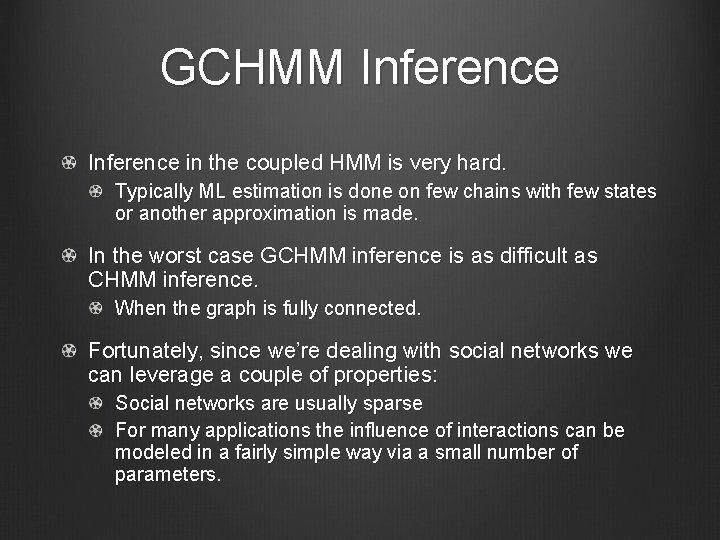
GCHMM Inference in the coupled HMM is very hard. Typically ML estimation is done on few chains with few states or another approximation is made. In the worst case GCHMM inference is as difficult as CHMM inference. When the graph is fully connected. Fortunately, since we’re dealing with social networks we can leverage a couple of properties: Social networks are usually sparse For many applications the influence of interactions can be modeled in a fairly simple way via a small number of parameters.
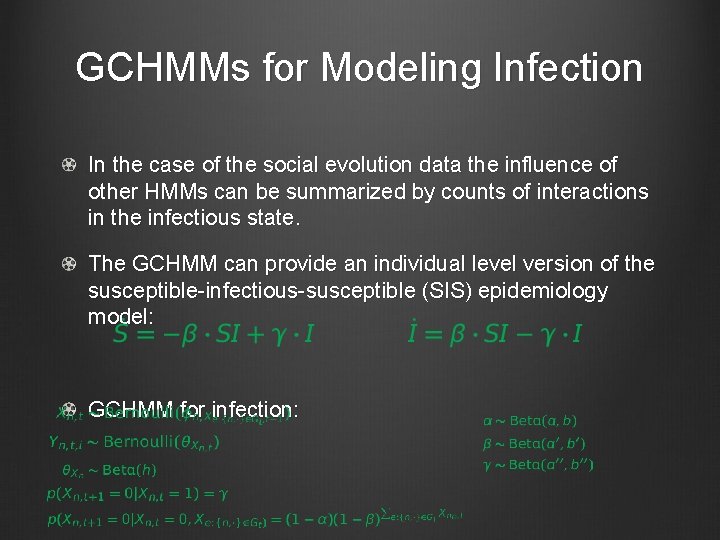
GCHMMs for Modeling Infection In the case of the social evolution data the influence of other HMMs can be summarized by counts of interactions in the infectious state. The GCHMM can provide an individual level version of the susceptible-infectious-susceptible (SIS) epidemiology model: GCHMM for infection:
Experimental Results Dong et al, UAI 2012
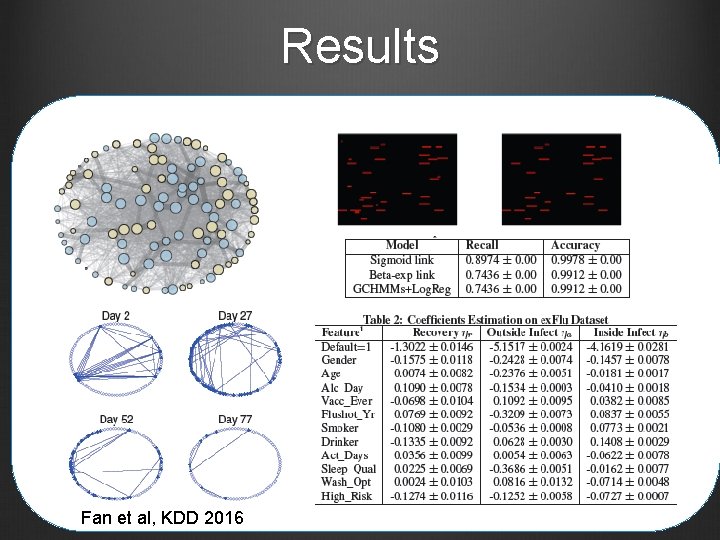
Aiello Group Data e. X-FLU study at University of Michigan 590 students from 6 dorms Chain referral scheme A 103 student subset participated in i. Epi Smartphone based study where location is tracked and surveys taken Unlike MIT study confirmation of interaction was recorded on phones and flu testing was done on students who reported being ill. Also an isolation intervention was tested.
Hierarchical GCHMMs Add a hierarchical level to where beta distributed infection parameters are learned: Inference Gibbs-EM algorithm but follow up papers e. g. stochastic VB
Results Fan et al, KDD 2016
Multiple Sclerosis
Initial Focus Chaotic symptoms Twenty-two non-pathognomonic symptoms Onset, duration, and severity do not clarify etiology How can we monitor this continuously to start making sense of it?
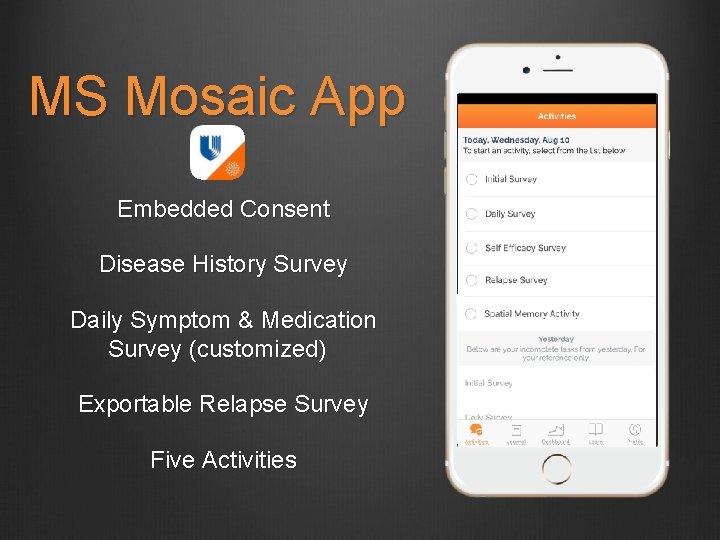
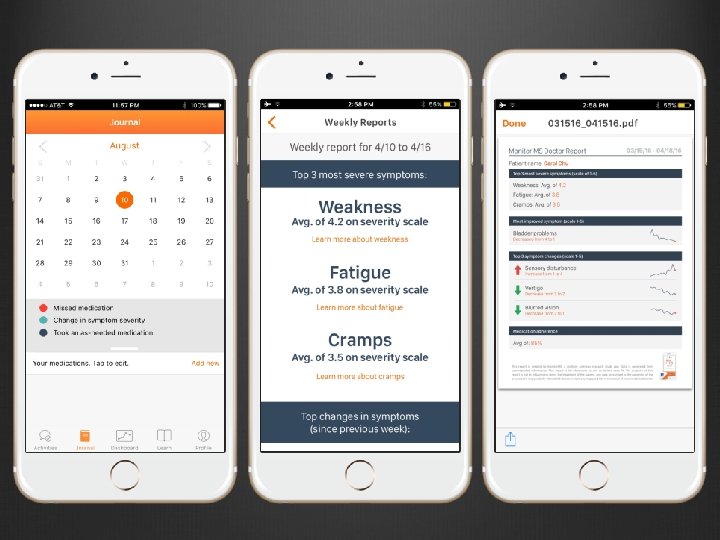
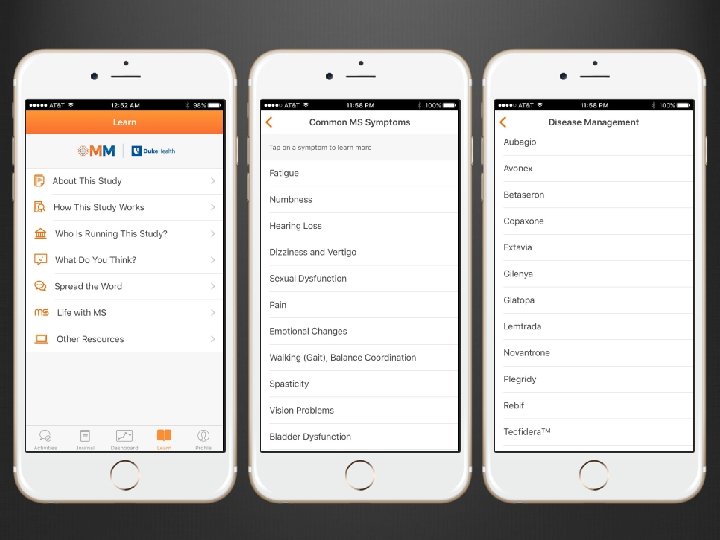
MS Mosaic App Embedded Consent Disease History Survey Daily Symptom & Medication Survey (customized) Exportable Relapse Survey Five Activities
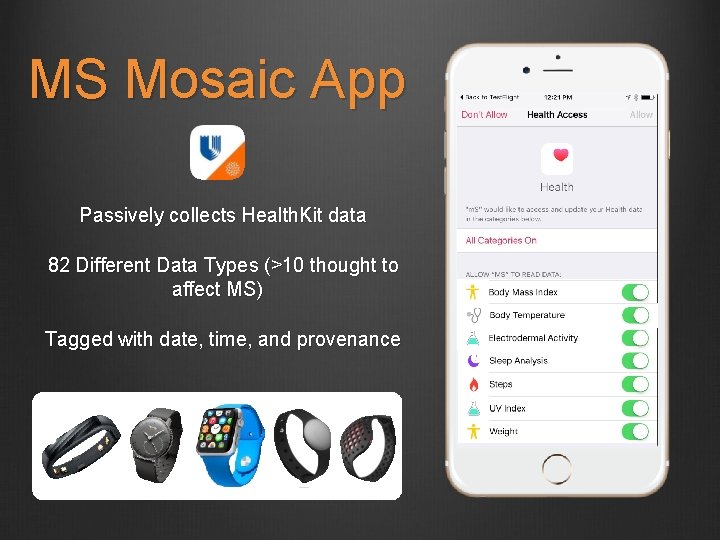
MS Mosaic App Passively collects Health. Kit data 82 Different Data Types (>10 thought to affect MS) Tagged with date, time, and provenance
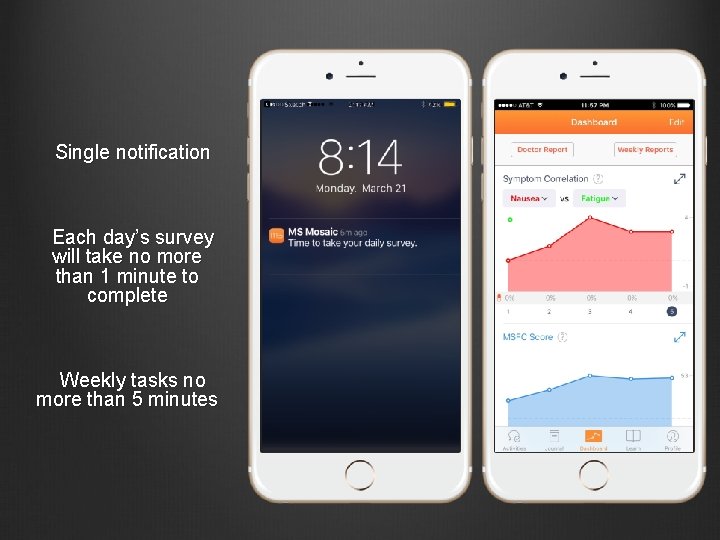
Single notification Each day’s survey will take no more than 1 minute to complete Weekly tasks no more than 5 minutes
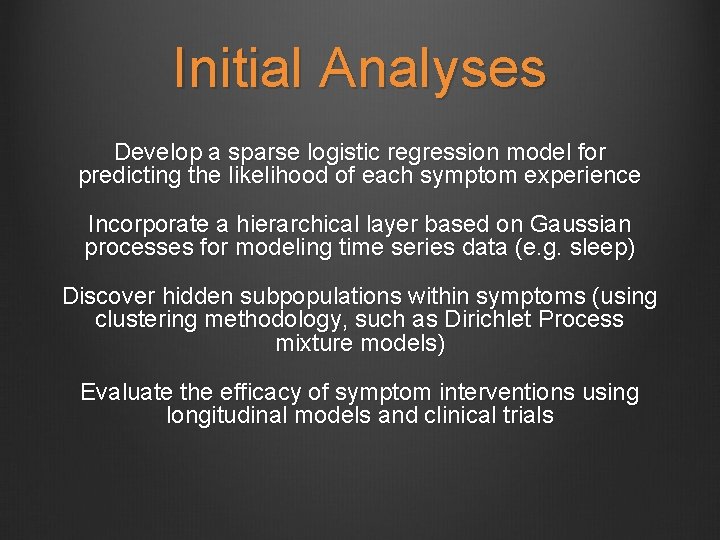
Initial Analyses Develop a sparse logistic regression model for predicting the likelihood of each symptom experience Incorporate a hierarchical layer based on Gaussian processes for modeling time series data (e. g. sleep) Discover hidden subpopulations within symptoms (using clustering methodology, such as Dirichlet Process mixture models) Evaluate the efficacy of symptom interventions using longitudinal models and clinical trials
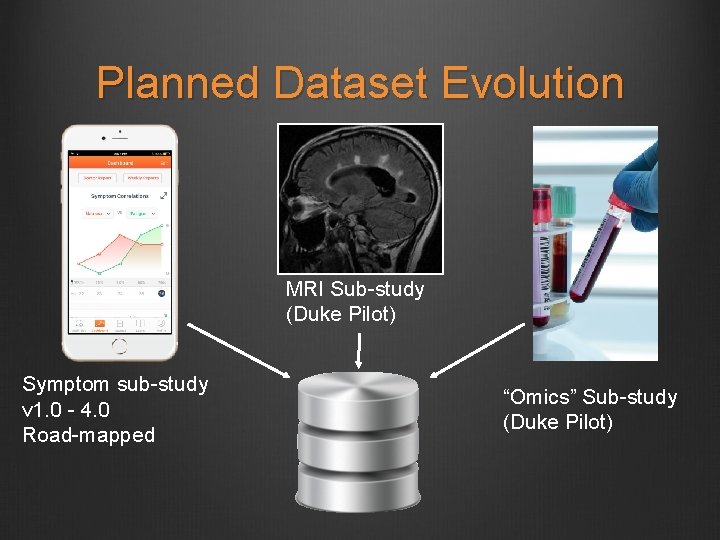
Planned Dataset Evolution MRI Sub-study (Duke Pilot) Symptom sub-study v 1. 0 - 4. 0 Road-mapped “Omics” Sub-study (Duke Pilot)
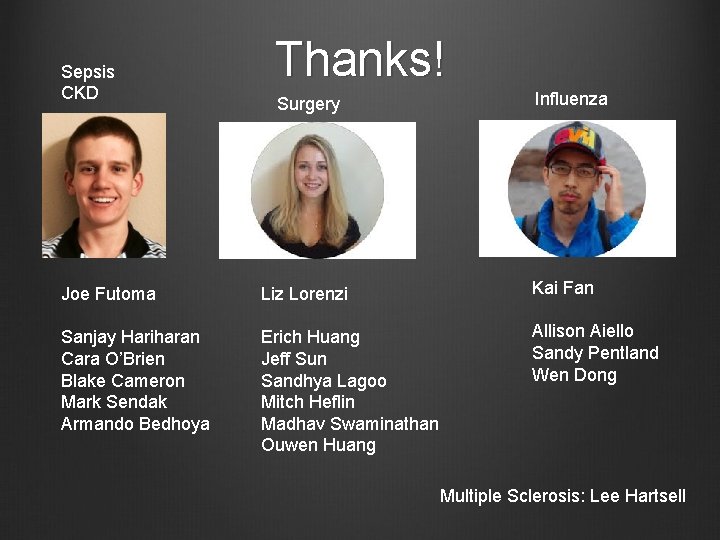
Sepsis CKD Thanks! Surgery Influenza Joe Futoma Liz Lorenzi Kai Fan Sanjay Hariharan Cara O’Brien Blake Cameron Mark Sendak Armando Bedhoya Erich Huang Jeff Sun Sandhya Lagoo Mitch Heflin Madhav Swaminathan Ouwen Huang Allison Aiello Sandy Pentland Wen Dong Multiple Sclerosis: Lee Hartsell