
Machine Learning Ali Ghodsi Department of Statistics School
- Slides: 26
Machine Learning Ali Ghodsi Department of Statistics School of Computer Science University of Waterloo aghodsib @uwaterloo. ca Winter 2009
Two Problems Classical Statistics • Infer information from small data sets (Not enough data) Machine Learning • Infer information from large data sets (Too many data)
We are drowning in information and starving for knowledge. Rutherford D. Roger
Other Names for ML • • Data mining, Applied statistics Adaptive (stochastic) signal processing Probabilistic planning or reasoning are all closely related to the second problem.
Applications Machine Learning is most useful when the structure of the task is not well understood but can be characterized by a dataset with strong statistical regularity. • • Search and recommendation (e. g. Google, Amazon) Automatic speech recognition and speaker verification Text parsing Face identification Tracking objects in video Financial prediction, fraud detection (e. g. credit cards) Medical diagnosis
More Applications More science and technology applications: – handwritten identification – drug discovery (to identify the biological activity of chemical compounds using features describing the chemical structures) – Gene expression analysis ( thousands of features with only dozens of observations)
Tasks • Supervised Learning: given examples of inputs and corresponding desired outputs, predict outputs on future inputs. e. g. : classification, regression • Unsupervised Learning: given only inputs, automatically discover representations, features, structure, etc. e. g. : clustering, dimensionality reduction, Feature extraction
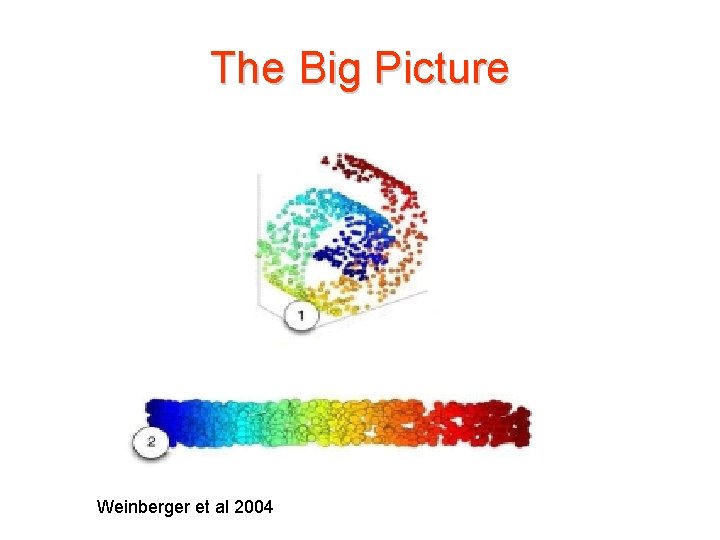
The Big Picture Weinberger et al 2004
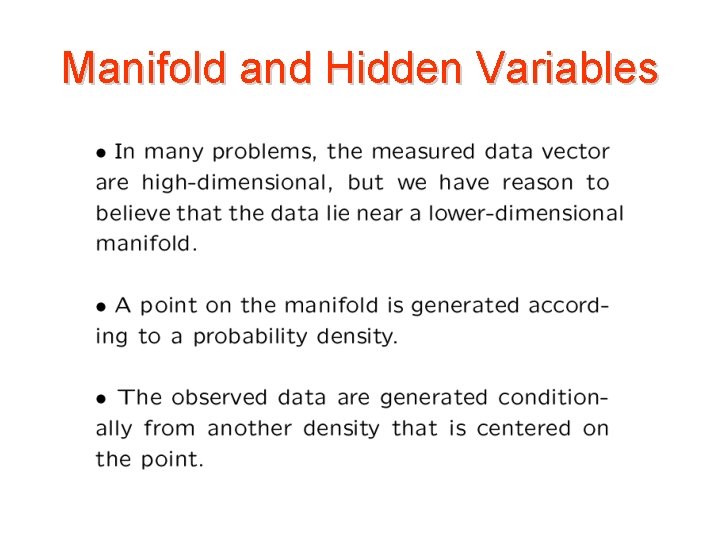
Manifold and Hidden Variables
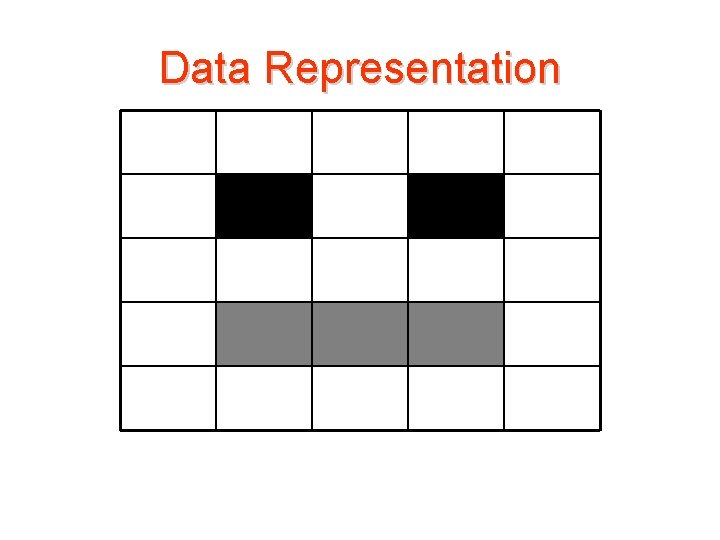
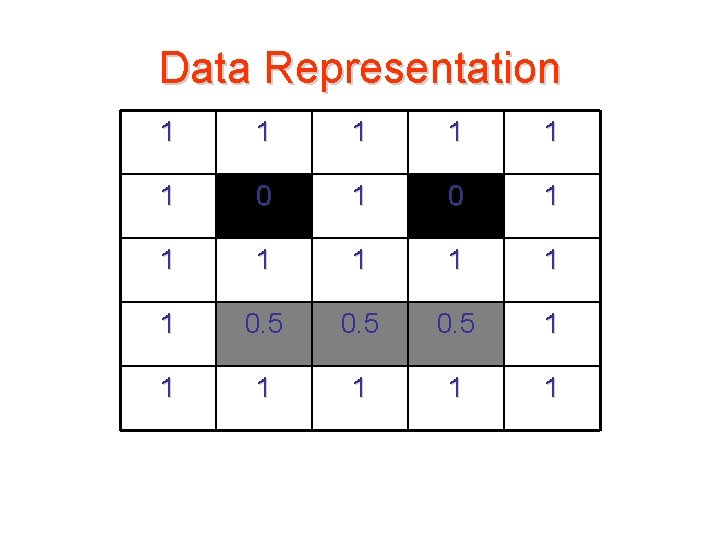
Dimensionality Reduction • • • Dimensionality: The number of measurements available for each item in a data set. The dimensionality of real world items is very high. For example: The dimensionality of a 600 by 600 image is 360, 000. The Key to analyzing data is comparing these measurements to find relationships among this plethora of data points. Usually these measurements are highly redundant, and relationships among data points are predictable.
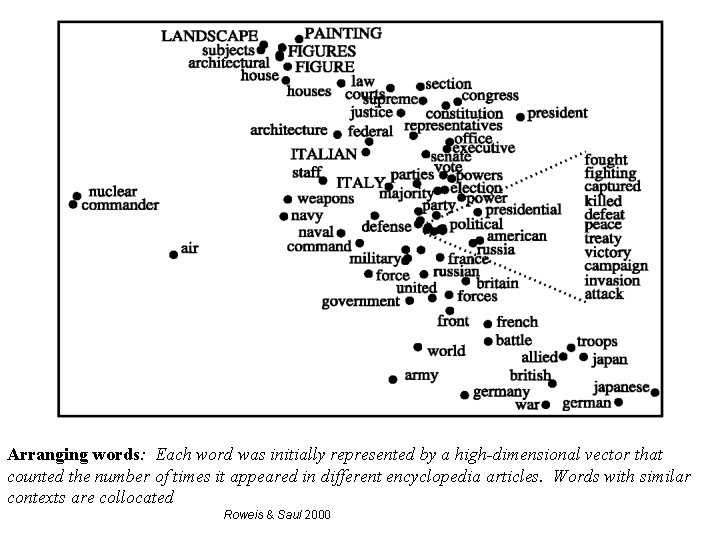
Dimensionality Reduction • Knowing the value of a pixel in an image, it is easy to predict the value of nearby pixels since they tend to be similar. • Knowing that the word “corporation” occurs often in articles about economics, but not very often in articles about art and poetry then it is easy to predict that it will not occur very often in articles about love. • Although there are lots of measurements per item, there are far fewer that are likely to vary. Using a data set that only includes the items likely to vary allows humans to quickly and easily recognize changes in high dimensionality data.
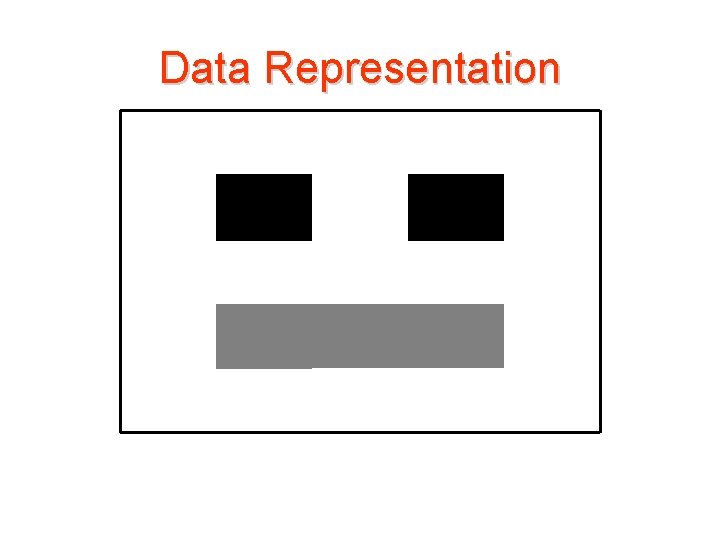
Data Representation
Data Representation
Data Representation 1 1 1 0 1 1 1 1 0. 5 1 1 1
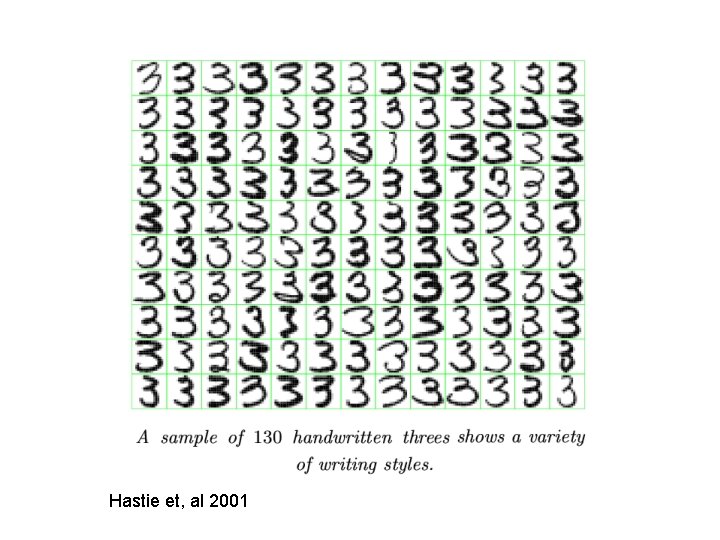
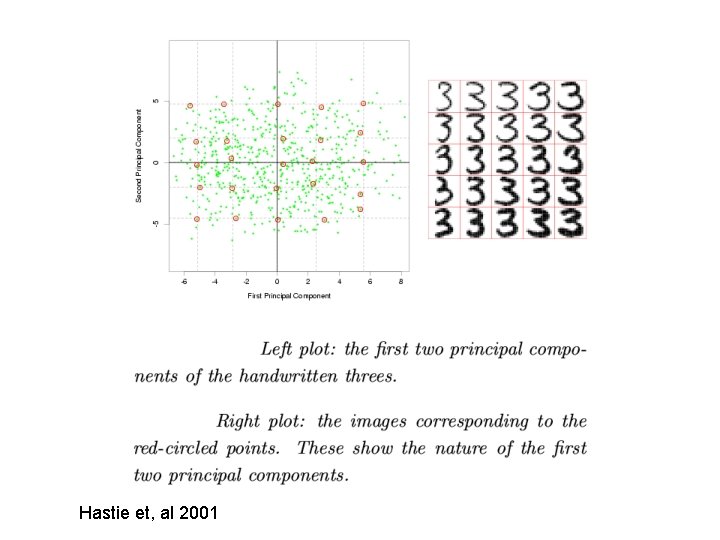
Hastie et, al 2001
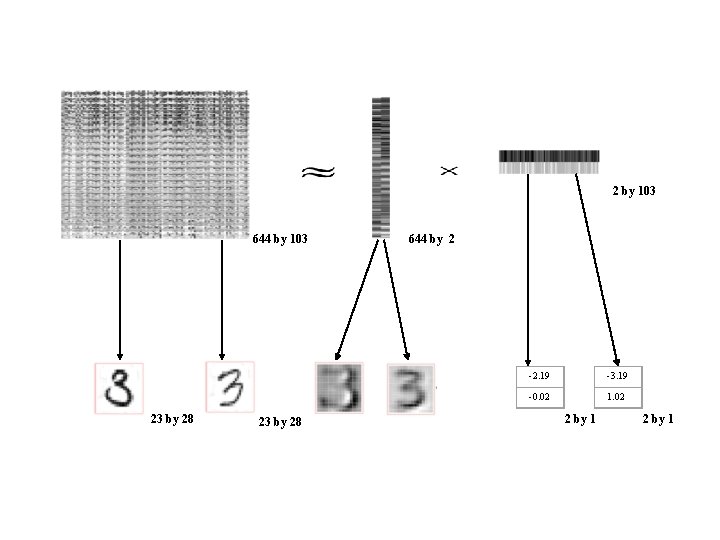
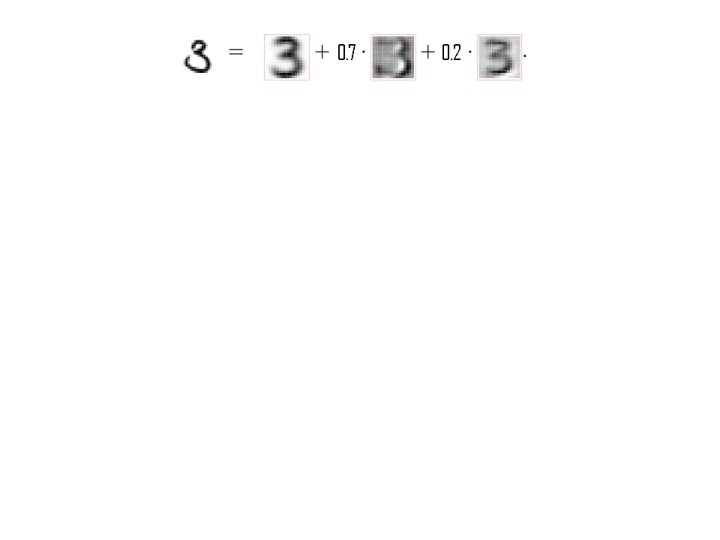
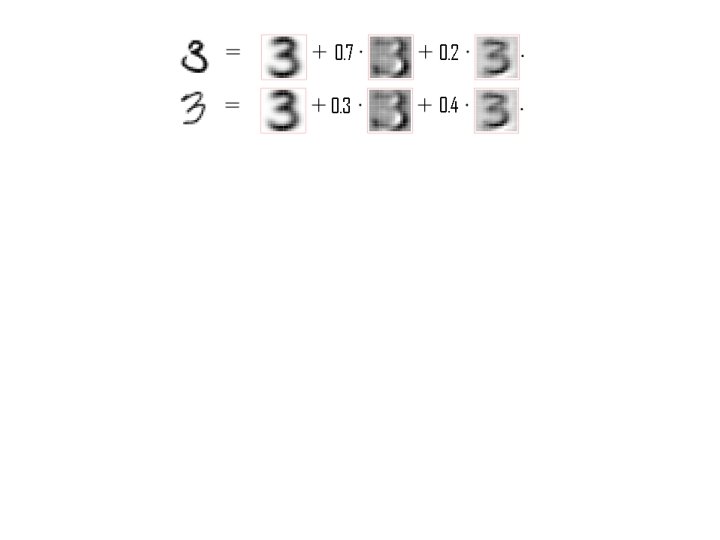
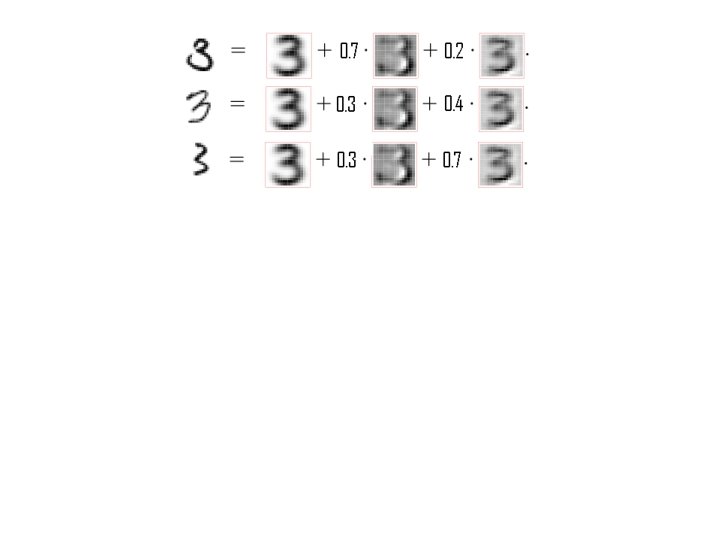
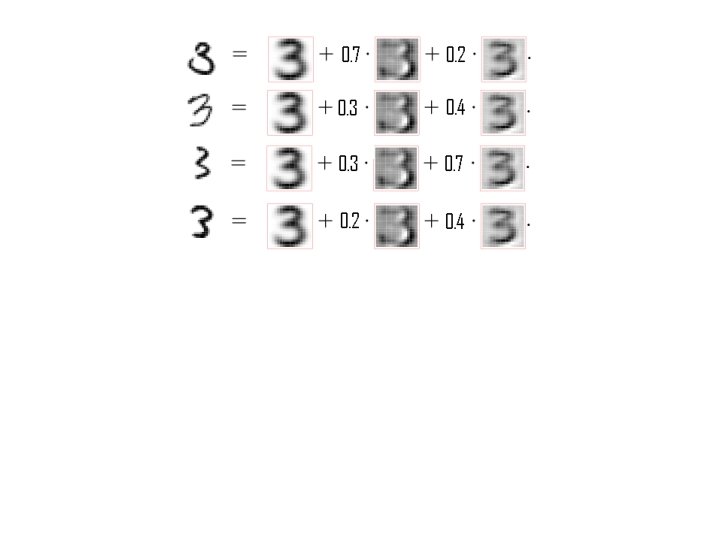
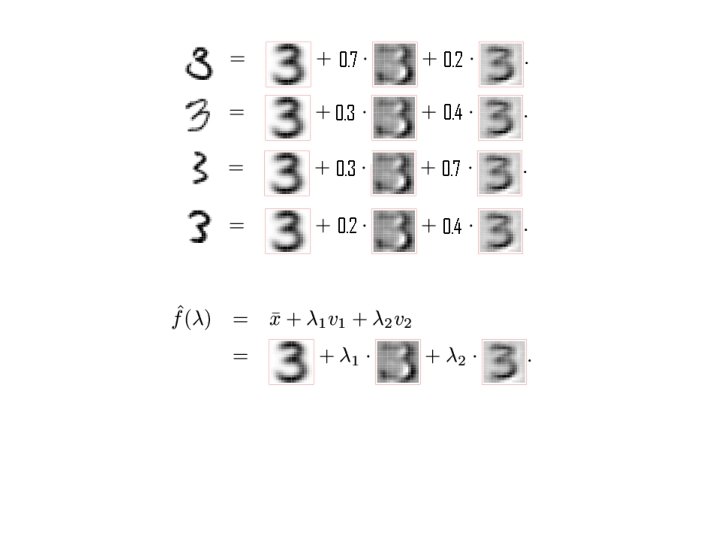
2 by 103 644 by 103 23 by 28 644 by 2 -2. 19 -3. 19 -0. 02 1. 02 2 by 1
Hastie et, al 2001
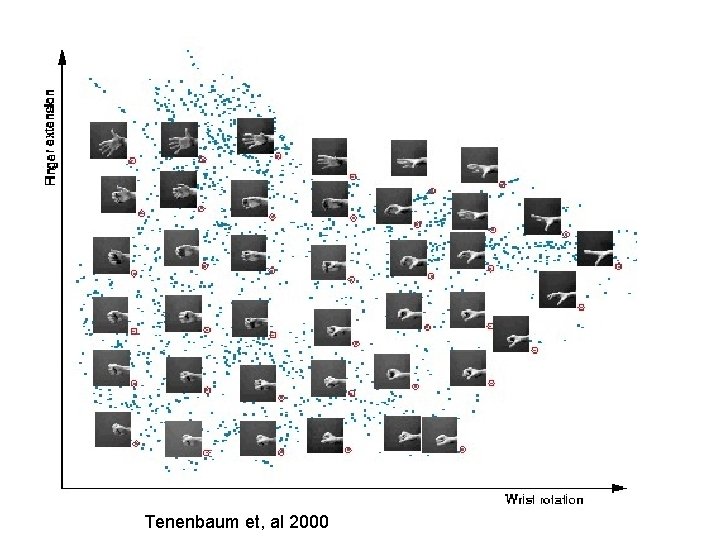
Tenenbaum et, al 2000
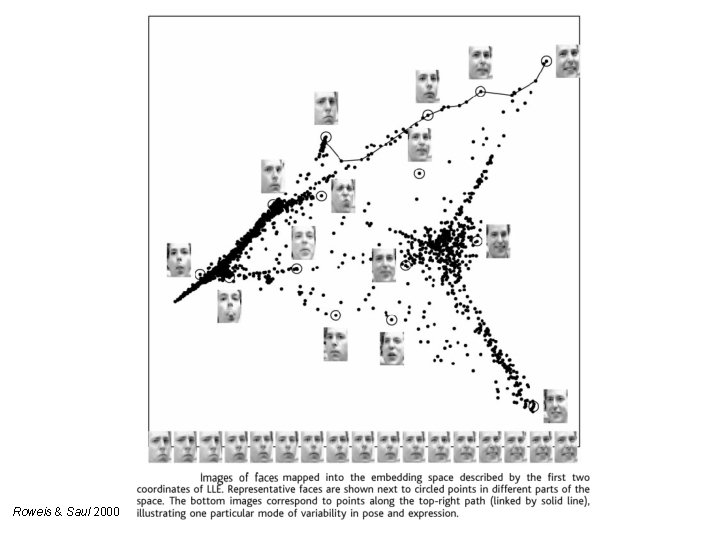
Roweis & Saul 2000
Arranging words: Each word was initially represented by a high-dimensional vector that counted the number of times it appeared in different encyclopedia articles. Words with similar contexts are collocated Roweis & Saul 2000
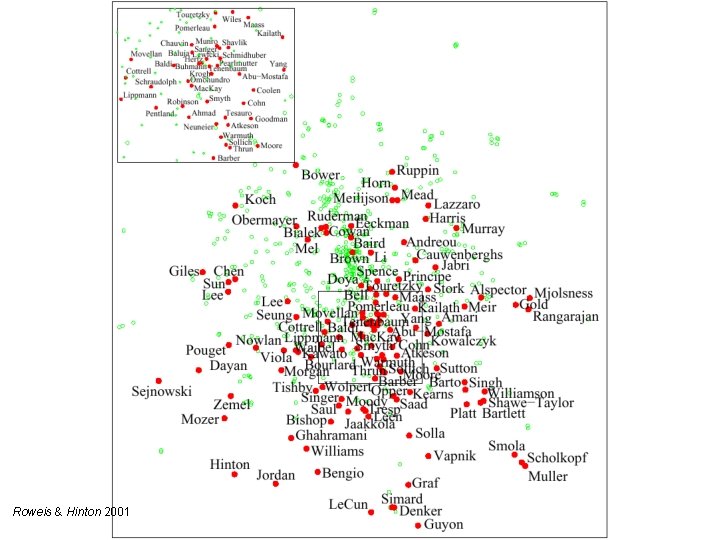
Roweis & Hinton 2001