m SWAT LowCost Hardware Fault Detection and Diagnosis
![SWAT Framework Components Detectors with simple hardware [Li et al. ASPLOS’ 08] Checkpoint Fault SWAT Framework Components Detectors with simple hardware [Li et al. ASPLOS’ 08] Checkpoint Fault](https://slidetodoc.com/presentation_image/0a39e34bb8cd385eda091ad999518ac6/image-4.jpg)
![Challenge Detectors with simple hardware [Li et. al. ASPLOS’ 08] Checkpoint Shown to work Challenge Detectors with simple hardware [Li et. al. ASPLOS’ 08] Checkpoint Shown to work](https://slidetodoc.com/presentation_image/0a39e34bb8cd385eda091ad999518ac6/image-5.jpg)

- Slides: 34

m. SWAT: Low-Cost Hardware Fault Detection and Diagnosis for Multicore Systems Siva Kumar Sastry Hari, Man-Lap (Alex) Li, Pradeep Ramachandran, Byn Choi, Sarita Adve Department of Computer Science University of Illinois at Urbana-Champaign swat@cs. uiuc. edu

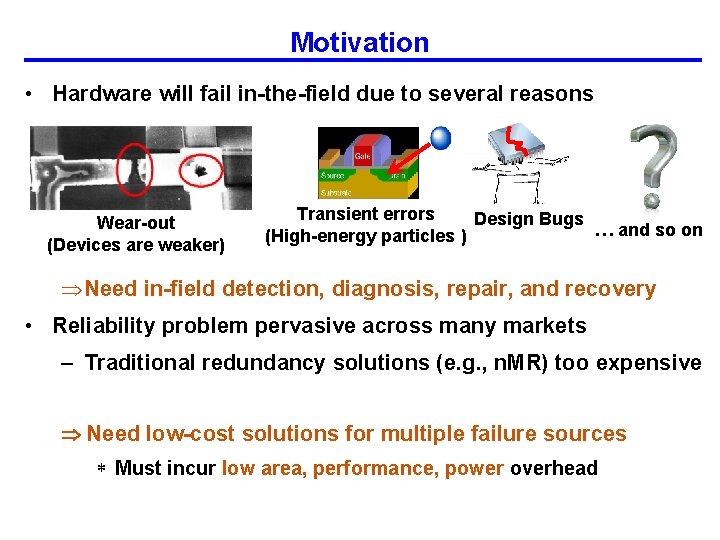
Motivation • Hardware will fail in-the-field due to several reasons Wear-out (Devices are weaker) Transient errors Design Bugs … and so on (High-energy particles ) ÞNeed in-field detection, diagnosis, repair, and recovery • Reliability problem pervasive across many markets – Traditional redundancy solutions (e. g. , n. MR) too expensive Need low-cost solutions for multiple failure sources * Must incur low area, performance, power overhead

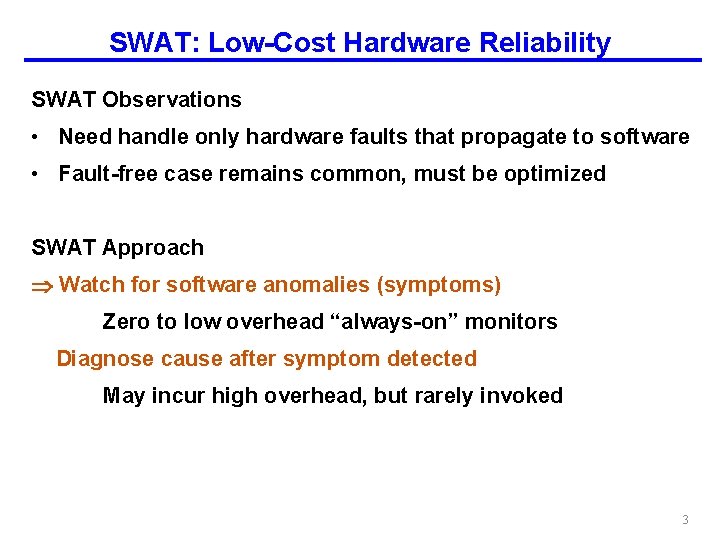
SWAT: Low-Cost Hardware Reliability SWAT Observations • Need handle only hardware faults that propagate to software • Fault-free case remains common, must be optimized SWAT Approach Watch for software anomalies (symptoms) Zero to low overhead “always-on” monitors Diagnose cause after symptom detected May incur high overhead, but rarely invoked 3
![SWAT Framework Components Detectors with simple hardware Li et al ASPLOS 08 Checkpoint Fault SWAT Framework Components Detectors with simple hardware [Li et al. ASPLOS’ 08] Checkpoint Fault](https://slidetodoc.com/presentation_image/0a39e34bb8cd385eda091ad999518ac6/image-4.jpg)
SWAT Framework Components Detectors with simple hardware [Li et al. ASPLOS’ 08] Checkpoint Fault Error Symptom detected Recovery Diagnosis Repair µarch-level Fault Diagnosis (TBFD) [Li et al. DSN’ 09] 4
![Challenge Detectors with simple hardware Li et al ASPLOS 08 Checkpoint Shown to work Challenge Detectors with simple hardware [Li et. al. ASPLOS’ 08] Checkpoint Shown to work](https://slidetodoc.com/presentation_image/0a39e34bb8cd385eda091ad999518ac6/image-5.jpg)
Challenge Detectors with simple hardware [Li et. al. ASPLOS’ 08] Checkpoint Shown to work well for single-threaded apps Does SWAT approach work on multithreaded apps? Fault Error Symptom detected Recovery Diagnosis Repair µarch-level Fault Diagnosis (TBFD) [Li et. al. DSN’ 09] 5

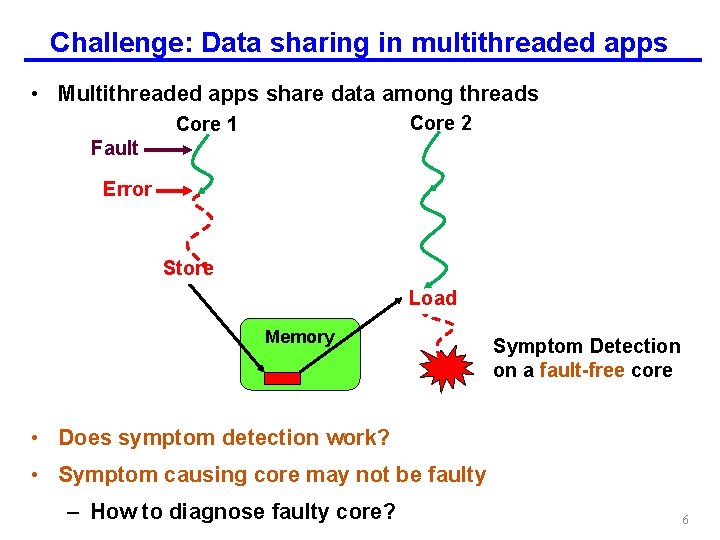
Challenge: Data sharing in multithreaded apps • Multithreaded apps share data among threads Core 2 Core 1 Fault Error Store Load Memory Symptom Detection on a fault-free core • Does symptom detection work? • Symptom causing core may not be faulty – How to diagnose faulty core? 6

Contributions • Evaluate SWAT detectors on multithreaded apps – Low Silent Data Corruption rate for multithreaded apps – Observed symptom from fault-free cores • Novel fault diagnosis for multithreaded apps – Identifies the faulty core despite error propagation – Provides high diagnosability 7

Outline • Motivation • m. SWAT Detection • m. SWAT Diagnosis • Results • Summary and Future Work 8

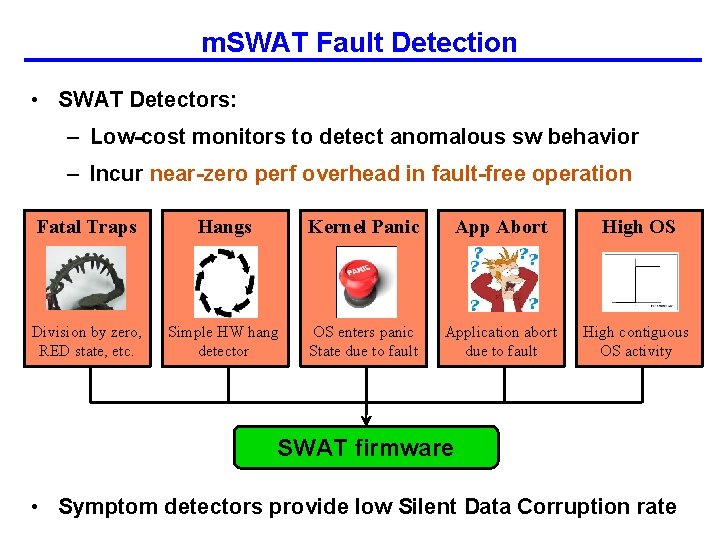
m. SWAT Fault Detection • SWAT Detectors: – Low-cost monitors to detect anomalous sw behavior – Incur near-zero perf overhead in fault-free operation Fatal Traps Hangs Kernel Panic App Abort High OS Division by zero, RED state, etc. Simple HW hang detector OS enters panic State due to fault Application abort due to fault High contiguous OS activity SWAT firmware • Symptom detectors provide low Silent Data Corruption rate

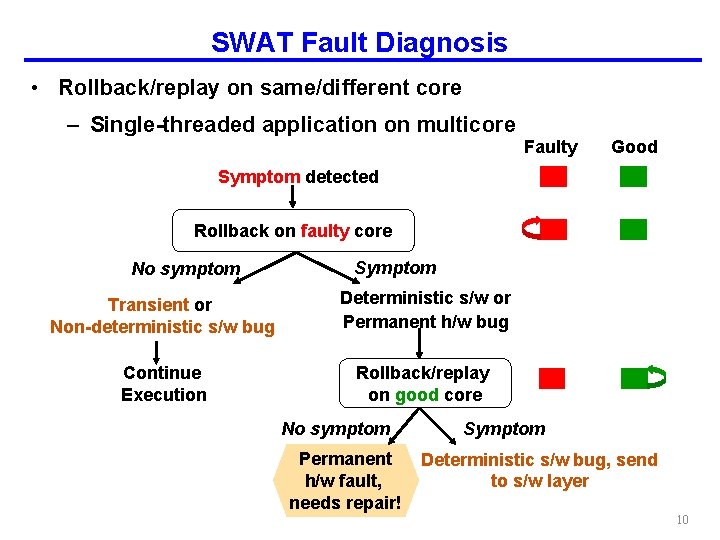
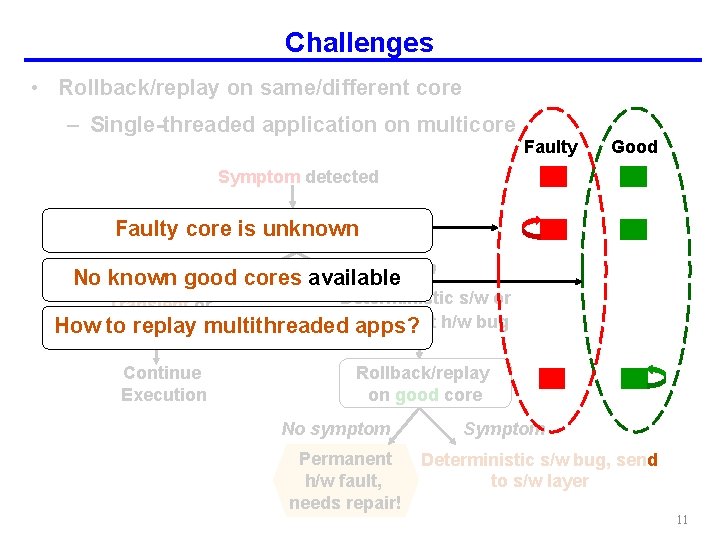
SWAT Fault Diagnosis • Rollback/replay on same/different core – Single-threaded application on multicore Faulty Good Symptom detected Rollback on faulty core No symptom Symptom Transient or Non-deterministic s/w bug Deterministic s/w or Permanent h/w bug Continue Execution Rollback/replay on good core No symptom Permanent h/w fault, needs repair! Symptom Deterministic s/w bug, send to s/w layer 10

Challenges • Rollback/replay on same/different core – Single-threaded application on multicore Faulty Good Symptom detected Faulty core is unknown Rollback on faulty core Symptom No symptom No known good cores available Deterministic s/w or Transient or Permanent Non-deterministic s/w bug How to replay multithreaded apps? h/w bug Continue Execution Rollback/replay on good core No symptom Permanent h/w fault, needs repair! Symptom Deterministic s/w bug, send to s/w layer 11

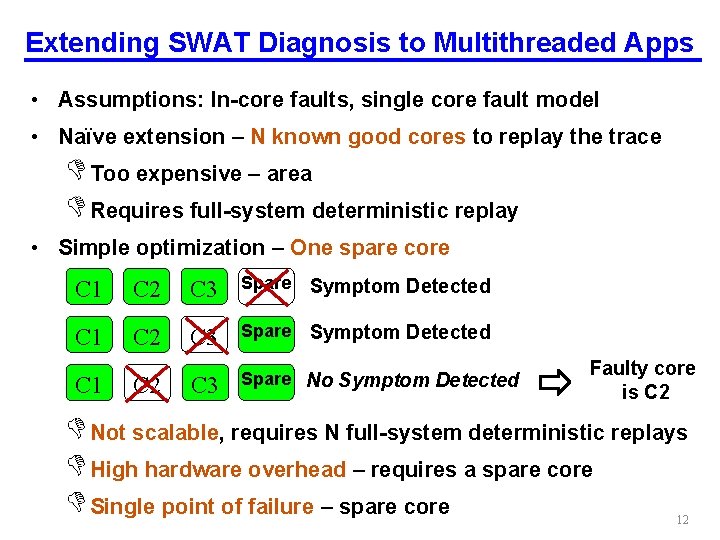
Extending SWAT Diagnosis to Multithreaded Apps • Assumptions: In-core faults, single core fault model • Naïve extension – N known good cores to replay the trace Too expensive – area Requires full-system deterministic replay • Simple optimization – One spare core C 1 C 2 C 3 Spare Symptom Detected C 3 Spare No Symptom Detected C 1 C 2 Faulty core is C 2 Not scalable, requires N full-system deterministic replays High hardware overhead – requires a spare core Single point of failure – spare core 12

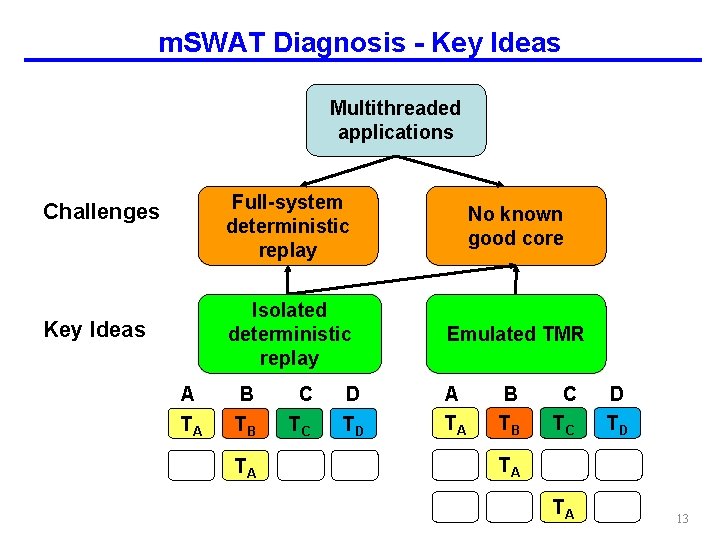
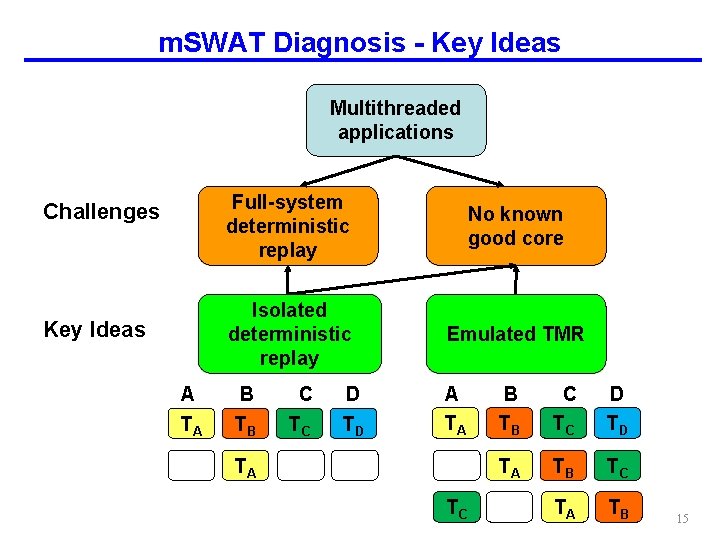
m. SWAT Diagnosis - Key Ideas Multithreaded applications Challenges Key Ideas A TA Full-system deterministic replay No known good core Isolated deterministic replay Emulated TMR B TB TA C TC D TD A TA B TB C TC D TD TA TA 13

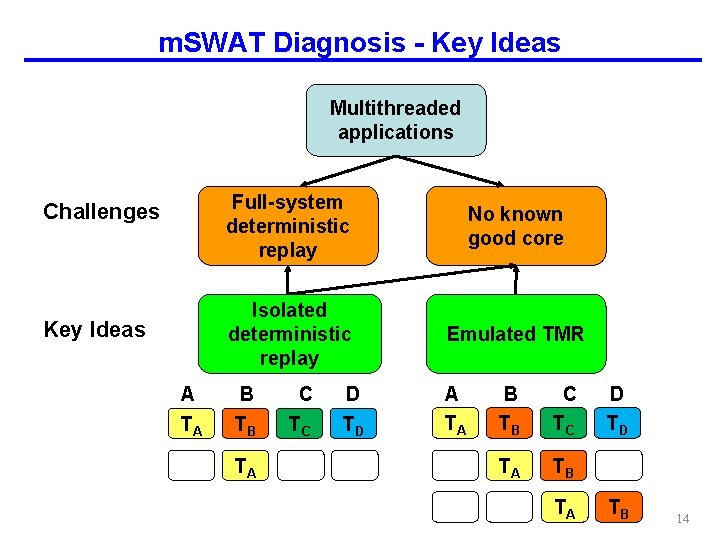
m. SWAT Diagnosis - Key Ideas Multithreaded applications Challenges Key Ideas A TA Full-system deterministic replay No known good core Isolated deterministic replay Emulated TMR B TB TA C TC D TD A TA B TB C TC TA TB TA D TD TB 14

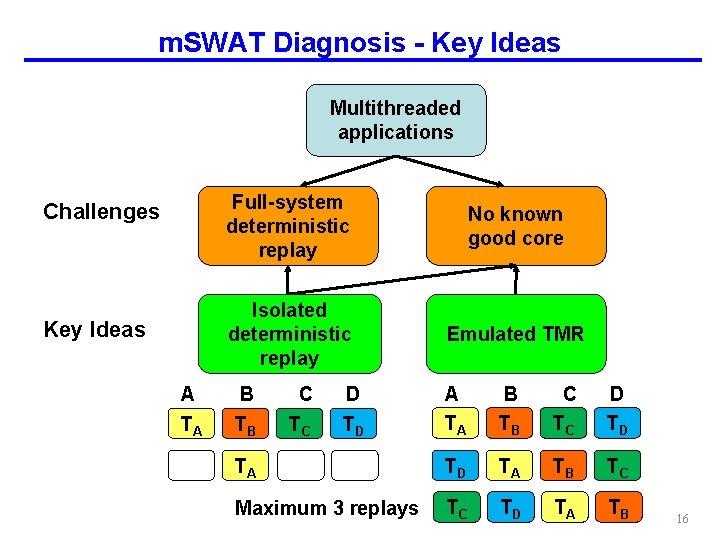
m. SWAT Diagnosis - Key Ideas Multithreaded applications Challenges Key Ideas A TA Full-system deterministic replay No known good core Isolated deterministic replay Emulated TMR B TB C TC D TD A TA TA TC B TB C TC D TD TA TB TC TA TB 15

m. SWAT Diagnosis - Key Ideas Multithreaded applications Challenges Key Ideas A TA Full-system deterministic replay No known good core Isolated deterministic replay Emulated TMR A TA B TB C TC D TD TA TB TC Maximum 3 replays TC TD TA TB B TB C TC D TD 16

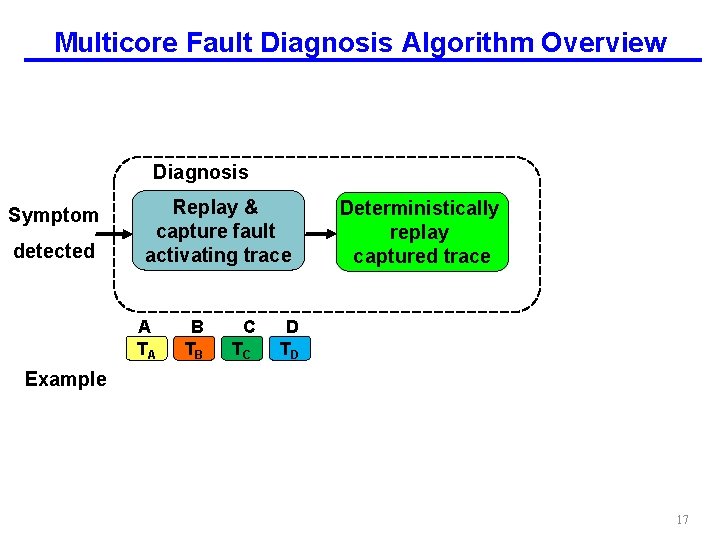
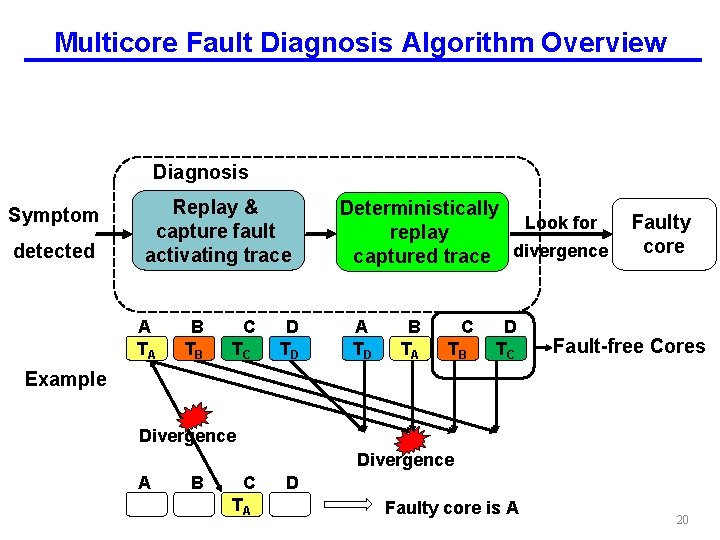
Multicore Fault Diagnosis Algorithm Overview Diagnosis Symptom detected Replay & capture fault activating trace A TA B TB C TC Deterministically replay captured trace D TD Example 17

Multicore Fault Diagnosis Algorithm Overview Diagnosis Symptom detected Replay & capture fault activating trace A TA B TB C TC D TD Deterministically replay captured trace A B C D Example 18

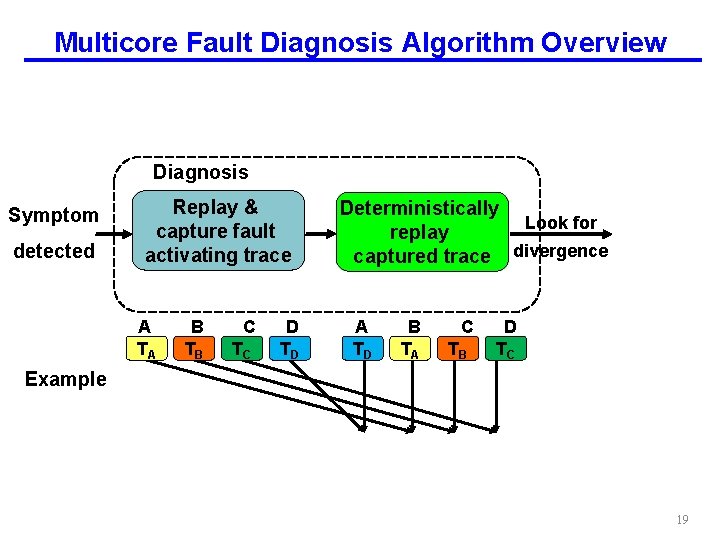
Multicore Fault Diagnosis Algorithm Overview Diagnosis Symptom detected Replay & capture fault activating trace A TA B TB C TC D TD Deterministically Look for replay captured trace divergence A TD B TA C TB D TC Example 19

Multicore Fault Diagnosis Algorithm Overview Diagnosis Symptom detected Replay & capture fault activating trace A TA B TB C TC D TD Deterministically Look for replay captured trace divergence A TD B TA C TB D TC Faulty core Fault-free Cores Example Divergence A B C TA D Faulty core is A 20

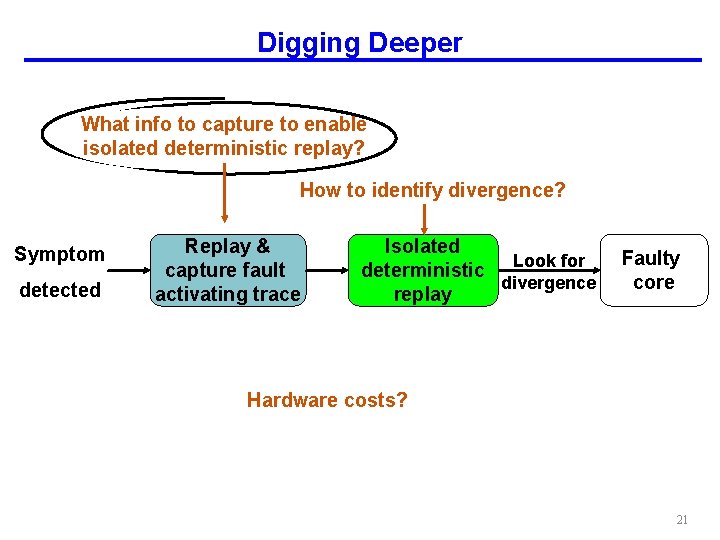
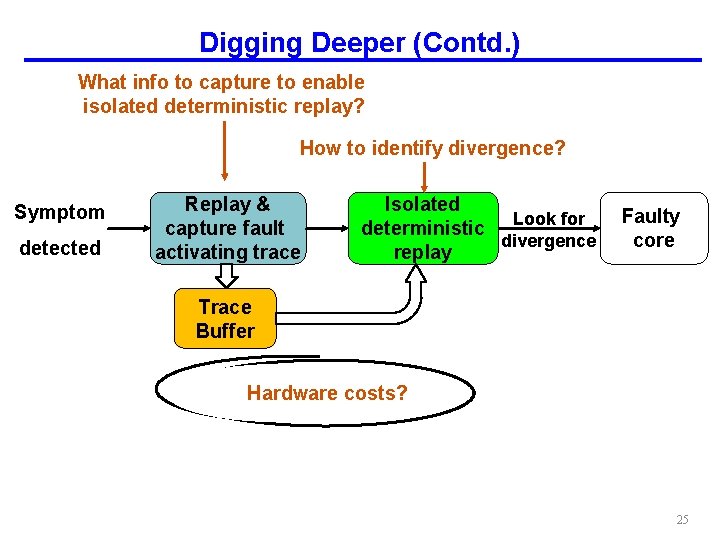
Digging Deeper What info to capture to enable isolated deterministic replay? How to identify divergence? Symptom detected Replay & capture fault activating trace Isolated Look for deterministic divergence replay Faulty core Hardware costs? 21

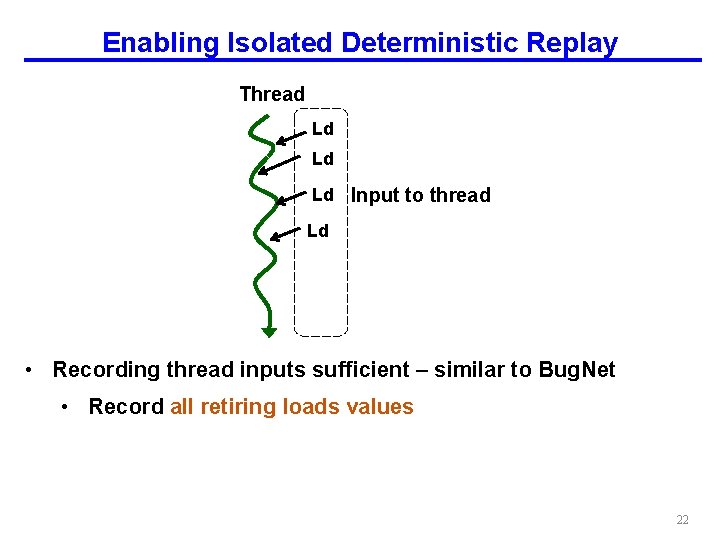
Enabling Isolated Deterministic Replay Thread Ld Ld Ld Input to thread Ld • Recording thread inputs sufficient – similar to Bug. Net • Record all retiring loads values 22

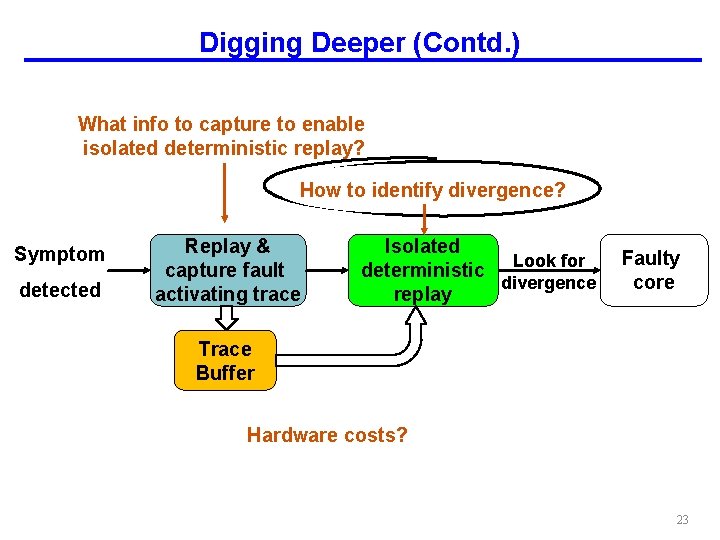
Digging Deeper (Contd. ) What info to capture to enable isolated deterministic replay? How to identify divergence? Symptom detected Replay & capture fault activating trace Isolated Look for deterministic divergence replay Faulty core Trace Buffer Hardware costs? 23

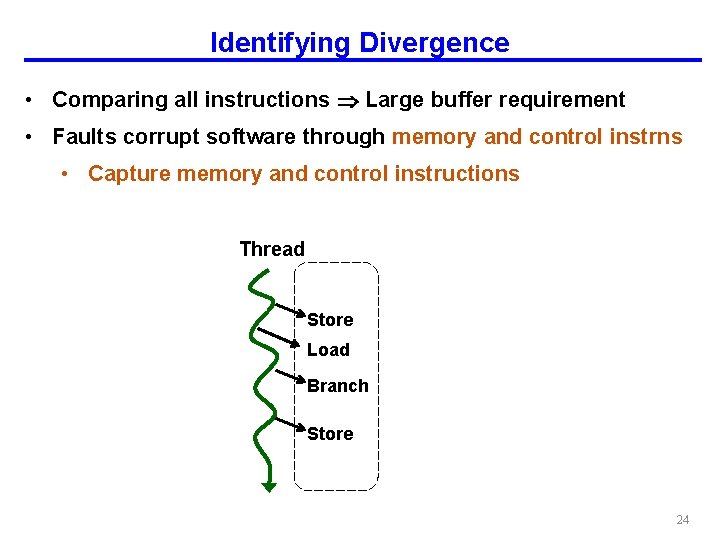
Identifying Divergence • Comparing all instructions Large buffer requirement • Faults corrupt software through memory and control instrns • Capture memory and control instructions Thread Store Load Branch Store 24

Digging Deeper (Contd. ) What info to capture to enable isolated deterministic replay? How to identify divergence? Symptom detected Replay & capture fault activating trace Isolated Look for deterministic divergence replay Faulty core Trace Buffer Hardware costs? 25

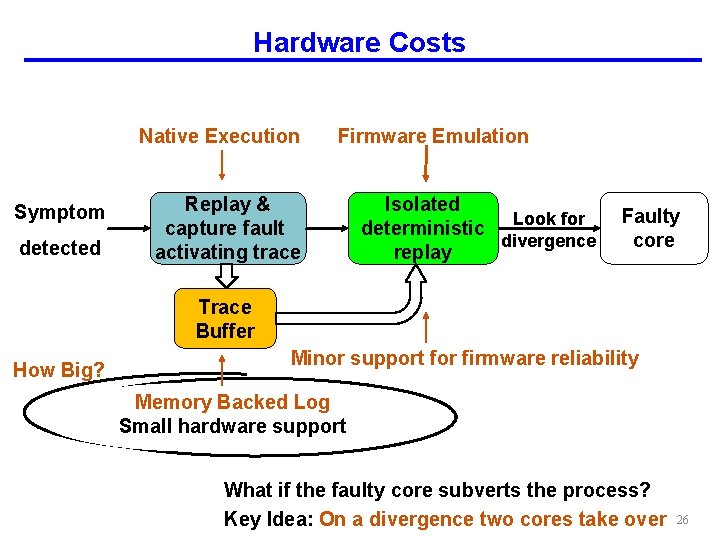
Hardware Costs Native Execution Symptom detected Firmware Emulation Replay & capture fault activating trace Isolated Look for deterministic divergence replay Faulty core Trace Buffer How Big? Minor support for firmware reliability Memory Backed Log Small hardware support What if the faulty core subverts the process? Key Idea: On a divergence two cores take over 26

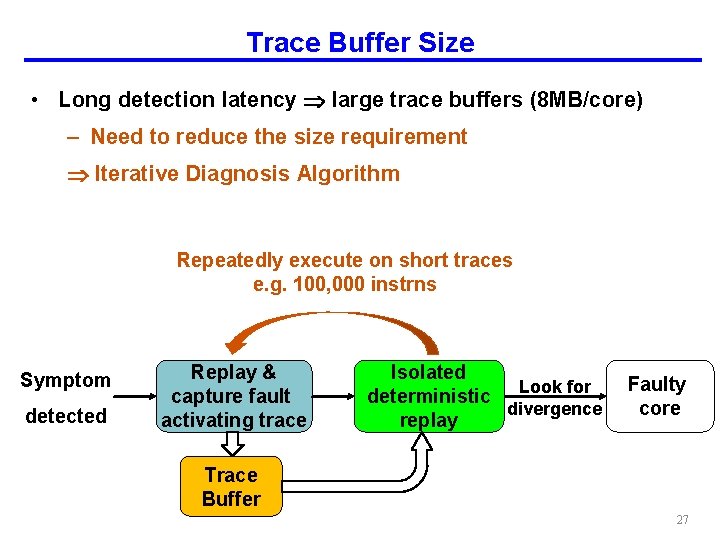
Trace Buffer Size • Long detection latency large trace buffers (8 MB/core) – Need to reduce the size requirement Iterative Diagnosis Algorithm Repeatedly execute on short traces e. g. 100, 000 instrns Symptom detected Replay & capture fault activating trace Isolated Look for deterministic divergence replay Faulty core Trace Buffer 27

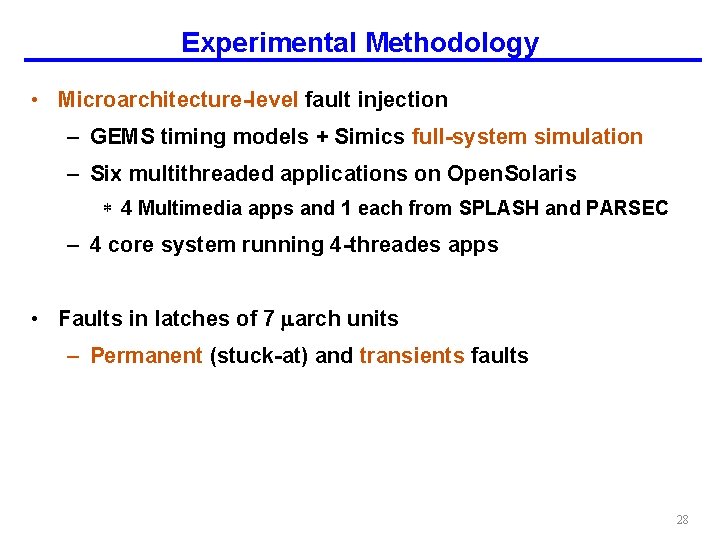
Experimental Methodology • Microarchitecture-level fault injection – GEMS timing models + Simics full-system simulation – Six multithreaded applications on Open. Solaris * 4 Multimedia apps and 1 each from SPLASH and PARSEC – 4 core system running 4 -threades apps • Faults in latches of 7 arch units – Permanent (stuck-at) and transients faults 28

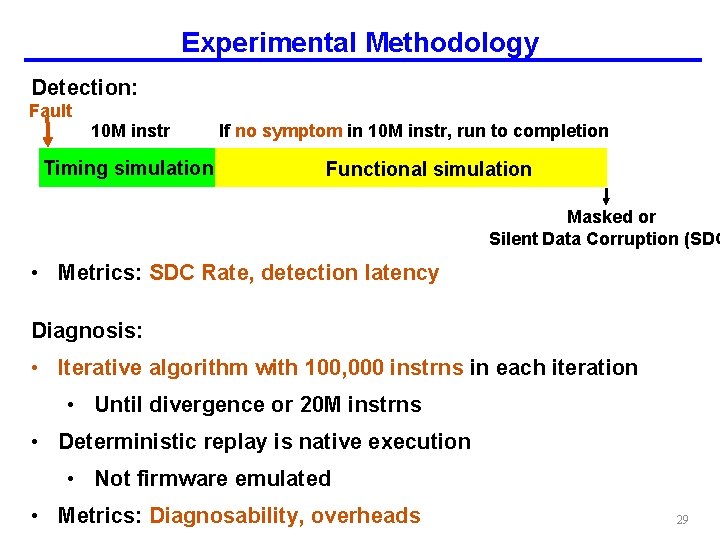
Experimental Methodology Detection: Fault 10 M instr Timing simulation If no symptom in 10 M instr, run to completion Functional simulation Masked or Silent Data Corruption (SDC • Metrics: SDC Rate, detection latency Diagnosis: • Iterative algorithm with 100, 000 instrns in each iteration • Until divergence or 20 M instrns • Deterministic replay is native execution • Not firmware emulated • Metrics: Diagnosability, overheads 29

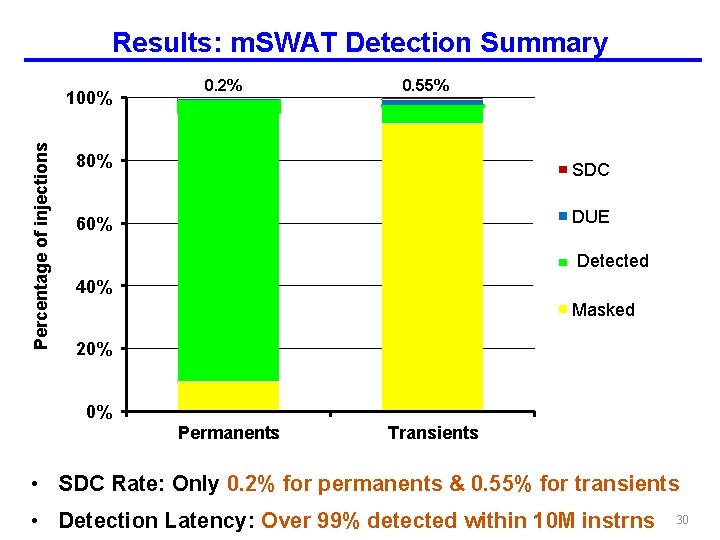
Results: m. SWAT Detection Summary Percentage of injections 100% 0. 2% 0. 55% 80% SDC DUE 60% Detected Detect-Faulty 40% Masked 20% 0% Permanents Transients • SDC Rate: Only 0. 2% for permanents & 0. 55% for transients • Detection Latency: Over 99% detected within 10 M instrns 30

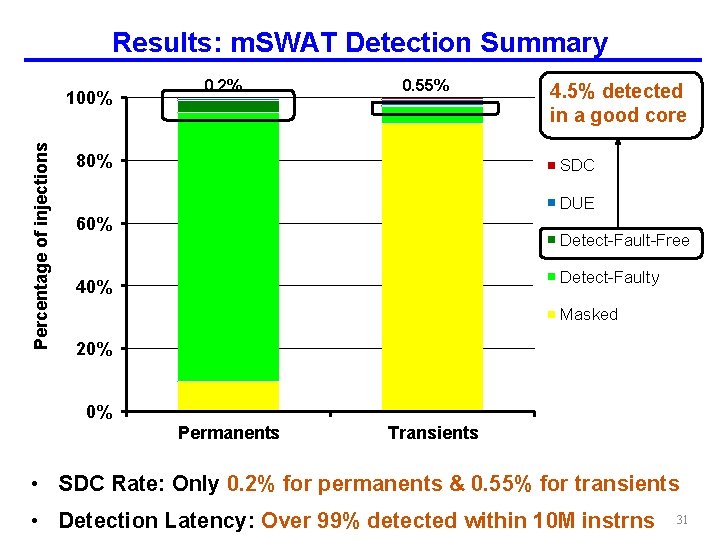
Results: m. SWAT Detection Summary Percentage of injections 100% 0. 2% 0. 55% 80% 4. 5% detected in a good core SDC DUE 60% Detect-Fault-Free Detect-Faulty 40% Masked 20% 0% Permanents Transients • SDC Rate: Only 0. 2% for permanents & 0. 55% for transients • Detection Latency: Over 99% detected within 10 M instrns 31

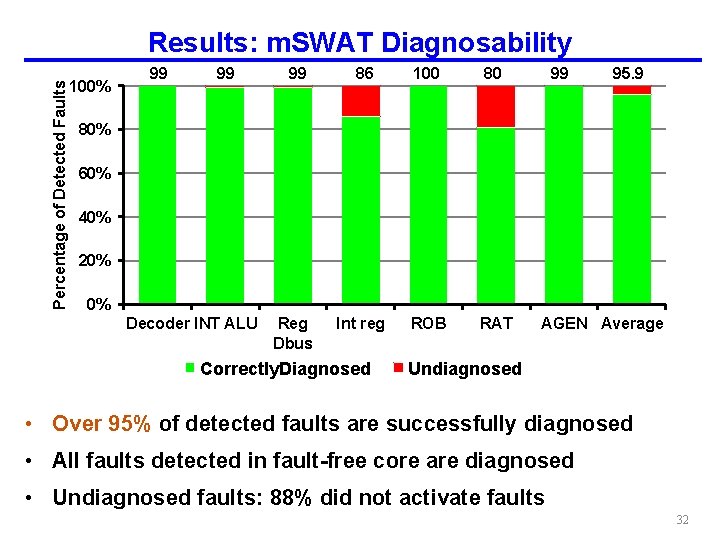
Percentage of Detected Faults Results: m. SWAT Diagnosability 100% 99 99 99 86 100 80 Int reg ROB RAT 99 95. 9 80% 60% 40% 20% 0% Decoder INT ALU Reg Dbus Correctly. Diagnosed AGEN Average Undiagnosed • Over 95% of detected faults are successfully diagnosed • All faults detected in fault-free core are diagnosed • Undiagnosed faults: 88% did not activate faults 32

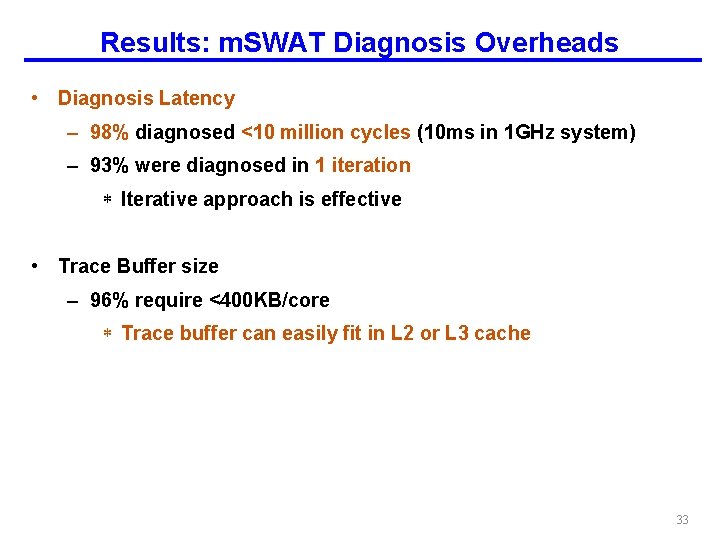
Results: m. SWAT Diagnosis Overheads • Diagnosis Latency – 98% diagnosed <10 million cycles (10 ms in 1 GHz system) – 93% were diagnosed in 1 iteration * Iterative approach is effective • Trace Buffer size – 96% require <400 KB/core * Trace buffer can easily fit in L 2 or L 3 cache 33

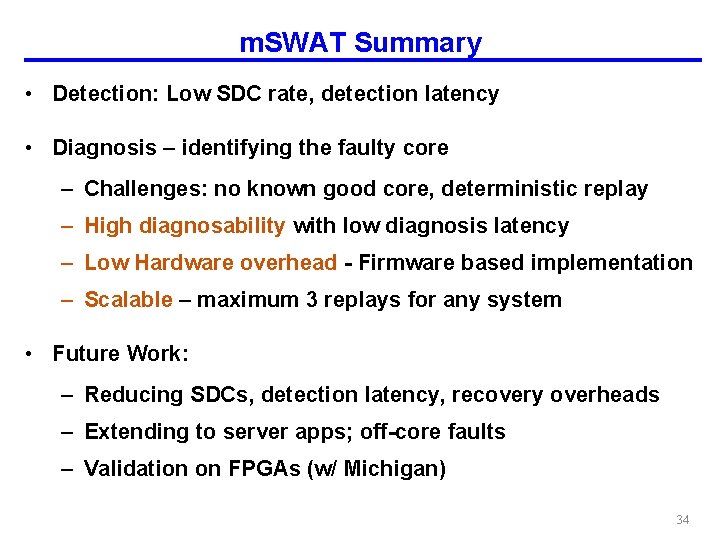
m. SWAT Summary • Detection: Low SDC rate, detection latency • Diagnosis – identifying the faulty core – Challenges: no known good core, deterministic replay – High diagnosability with low diagnosis latency – Low Hardware overhead - Firmware based implementation – Scalable – maximum 3 replays for any system • Future Work: – Reducing SDCs, detection latency, recovery overheads – Extending to server apps; off-core faults – Validation on FPGAs (w/ Michigan) 34