LYRA the LargeYield Radiometer onboard PROBA 2 Components

LYRA the Large-Yield Radiometer onboard PROBA 2 Components of soft X-ray and extreme ultraviolet in flares observed by LYRA I. E. Dammasch, M. Dominique, M. Kretzschmar (ROB/SIDC), P. C. Chamberlin (NASA/GSFC) SCSL / PROBA 2 Splinter Meeting ESWW 8, Namur, 29 Dec 2011
 n 4 spectral channels per")
LYRA: the Large-Yield RAdiometer n 3 instrument units (redundancy) n 4 spectral channels per head n 3 types of detectors, Silicon + 2 types of diamond detectors (MSM, PIN): - radiation resistant - insensitive to visible light compared to Si detectors n High cadence up to 100 Hz

SWAP and LYRA spectral intervals for solar flares, space weather, and aeronomy LYRA channel 1: the H I 121. 6 nm Lyman-alpha line (120 -123 nm) LYRA channel 2: the 200 -220 nm Herzberg continuum range (now 190 -222 nm) LYRA channel 3: the 17 -80 nm Aluminium filter range incl the He II 30. 4 nm line (+ <5 nm X-ray) LYRA channel 4: the 6 -20 nm Zirconium filter range with highest solar variablility (+ <2 nm X-ray) SWAP: the range around 17. 4 nm including coronal lines like Fe IX and Fe X
 n channel 2 -4 (Zirconium")
LYRA spectral response n channel 2 -3 (Aluminium filter) n channel 2 -4 (Zirconium filter) n pre-launch calibration at BESSY n additional SXR components <5 nm, <2 nm n for comparison: GOES 0. 1 -0. 8 nm
 n Level 1")
Data product definition n (“Level 0”, telemetry from PROBA 2, internal) n Level 1 = full raw data (counts/ms) n Level 2 = calibrated physical data (W/m²) (Caution: preliminary status. Require versioning. ) n Level 3 = processed products (e. g. averages) n Level 4 = plots of products n Level 5 = event lists (optionally with plots)
 LYRA products … resulting from calibration attempts: n")
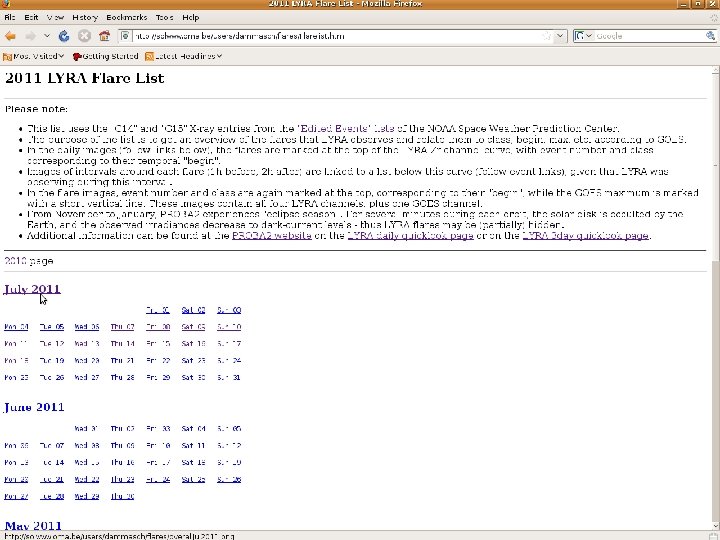
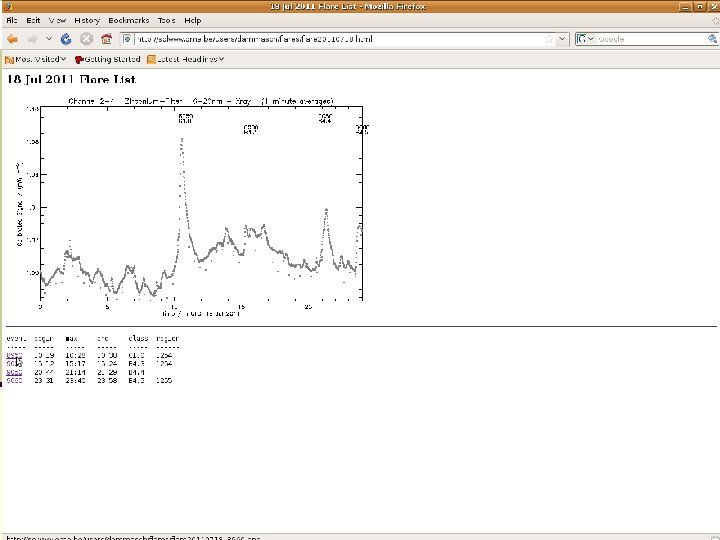
New (well, more or less new) LYRA products … resulting from calibration attempts: n Level 2 FITS files n Level 3 FITS files n (Level 4) One-day overviews n (Level 4) Three-day overviews n (Level 5) Flare lists n (Level 5) GOES vs. LYRA proxies (preliminary) … available here at the P 2 SC website: http: //proba 2. sidc. be/

one-day overview

three-day overview

GOES vs. LYRA proxies For more information on this subject, please see the talk by David Berghmans, Automated flare detection and localization with PROBA 2 Session 4 A, Thursday 01 December 2011, 12: 20

monthly overview

Example: M 1. 1 flare, 28 Feb 2011 • • • start to rise at same time parallel in impulsive phase GOES peaks earlier LYRA decreases slower linear factor in pure flare irradiance
>7 • “EUV")
Flare components ch 2 -3 = SXR+EUV • “SXR”: emission with log(T)>7 • “EUV residual”: emission with 6<log(T)<7 • “little bump”: emission with log(T)<6 Compare with SDO/EVE:

Thermal evolution plot based on: • solar spectra observed by SDO/EVE • contribution functions from the CHIANTI atomic database

Lyman-alpha signal n LYRA in early 2010 n signal peaks in rising phase n log(T)<6

0. 03 MK 0. 7 MK 1. 4 MK 3. 7 MK 7. 7 MK

May 2010 EVE vs. LYRA

M 1. 2 flare 05 May 2010 17: 19 UTC GOES (0. 1 - 0. 8 nm) ~0. 012 m. W/m² LYRA (0 - 2 nm) ~0. 7 m. W/m² LYRA (0 - 5 nm) ~1. 0 m. W/m² EVE (0 - 7 nm) ~2. 0 m. W/m²

Feb/Mar 2011 EVE vs. LYRA
- Slides: 21