Lumped Parameter Matrix Injection Evaluations Matrix Injection Case


![Theory: ç"According to this parameter [Water Quality Ratio] the greater the water quality ratio,](https://slidetodoc.com/presentation_image_h2/8488095d4f1bb21853dd5406e6d070ed/image-6.jpg "Theory: ç\"According to this parameter [Water Quality Ratio] the greater the water quality ratio,")


- Slides: 34
Lumped Parameter Matrix Injection Evaluations Matrix Injection Case Studies Chevron Carbonates Shell GOM Sands Phillips Chalk Kerr Mc. Gee
Chevron Methodology çA method is presented whereby the injection history of a well may be interpreted in terms of the quality of the injected water. çCoreflooding and/or membrane measurements çEffective history matching and monitoring methodology
Water Quality Ratio RWQ …. . rc …. . kc …. . r W …. . water quality index (darcies) density of filter cake formed from the suspended solids, permeability of filter cake formed from the suspended solids (darcies), water density, suspended solids concentration
For Internal and External Cake çV throughput, çVTC core volume çk. F formation baseline permeability (darcies), çk plugged permeability (darcies), ça fraction of the total particulates in the external cake, and, çb fraction of the total particulates in the internal cake.
Coreflooding
Theory: ç"According to this parameter [Water Quality Ratio] the greater the water quality ratio, the less is the tendency of the water to damage by suspended solids plugging. Through a series of coreflood tests the water quality ratio is related to the filtration level, which in turn provides a guide for choosing the filtration equipment needed in the field under construction. "
Theory: ç"It is shown that waters with ratios less than 10 would be expected to cause extreme plugging. Above 100 only minor plugging is expected. "
Using for Matrix Injection çLumping parameters çNumerous assumptions çWater quality ratio often used for monitoring çAn effective wellbore is used to avoid inputting diameters, perforations, permeability, porosity variations, etc. ç“The effective or equivalent properties are simply those that fit the mathematical description of the injection well performance. ”
Effective Parameters çFor an overall time, T, the volume of water injected is: where: çVW is the injection wellbore volume çl is the ratio of rates at time T and time 0, çk. F is the effective/equivalent reservoir permeability, çre is the outer radius, and, çr*W is the effective or equivalent wellbore radius.
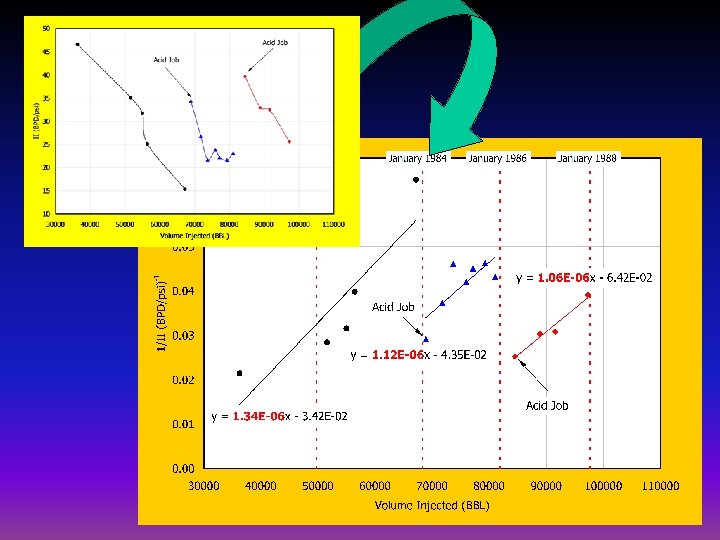
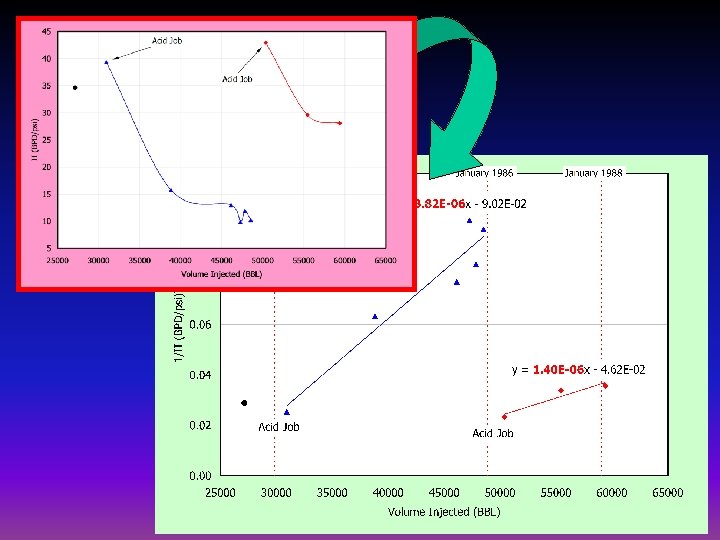
Effective Parameters çA plot of the reciprocal term versus the total volume is a straight line with intercept 1 and its slope is a measure of the injection water quality. With some assumptions and units conversions:
1/l vs. Water Injected 200 md, wellbore volume of 88. 4 ft 3
1/l vs. Water Injected 200 md, wellbore volume of 88. 4 ft 3
Saudi ARAMCO Examples çSaudi Aramco seawater floods. çIn this particular situation, the injection pressure and the differential pressure were relatively constant.
Saudi Aramco çTwo injectors, monitored over seven years ç 1/IIT plotted versus VT. çFor both wells the slopes decrease with time. çInjection water quality generally was improving through better corrosion and bacteria control. ç“On the assumption that GII 0 did not change, the improvement in water quality (i. e. , increasing RWQ) would account for the slope decrease. The improvement in water quality is not evident in the plots of injectivity index versus volume injected. ”
Merit in the Concept çLumped parameters not requiring an explicit knowledge of plugging mechanics çPoor track record of micro-level plugging models çWith assumptions of Gaussian distributions of particle deposition and various other simplifications, reduce complicated formulae to:
Merit in the Concept • a governs magnitude of rate and b governs temporal flow rate profiles. • Take injectivity ratio as:
Potential Fracture Diagnostic
Lumping çIs not a purely empirical one even though the method appears to be so simple that imitates a curve-fitting approach. çThe field injectivity decline profiles appear to replicate a stochastic Gaussian distribution. çThe present simplification is mainly reflected in selecting a single and a collective distribution, which is equivalent to choosing the path of a representative particle migration.
Well A 36
Well A 42
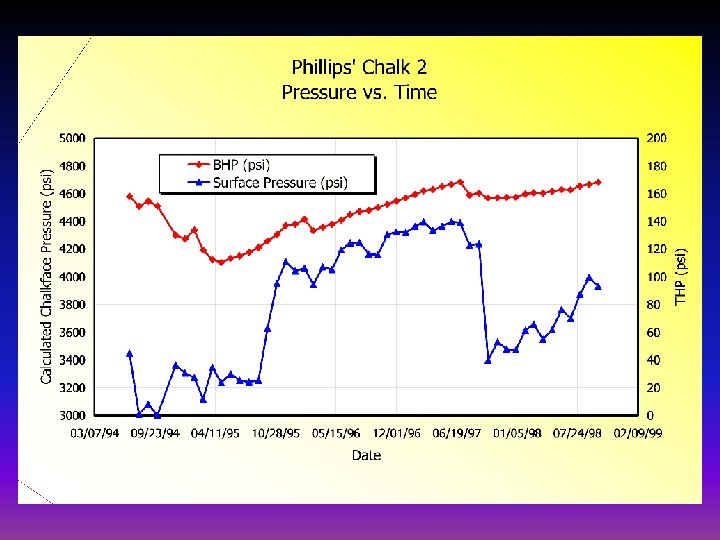
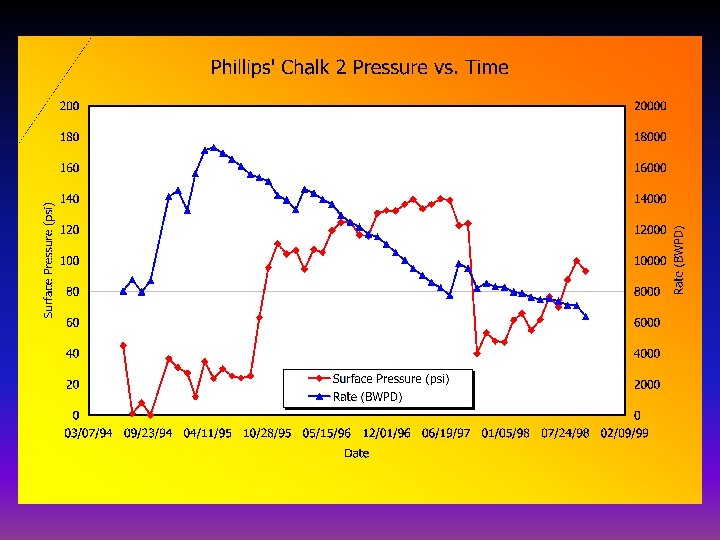
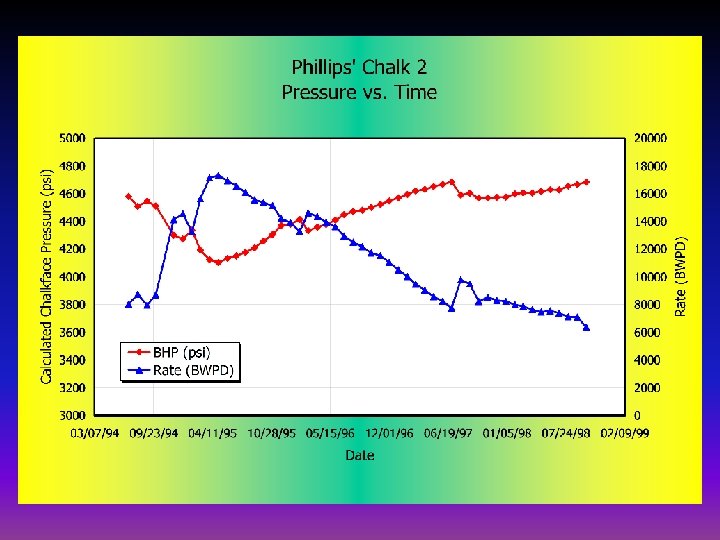
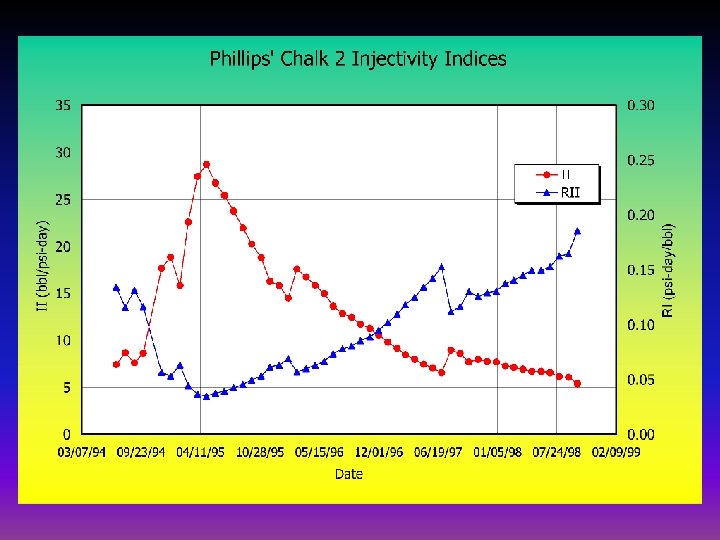
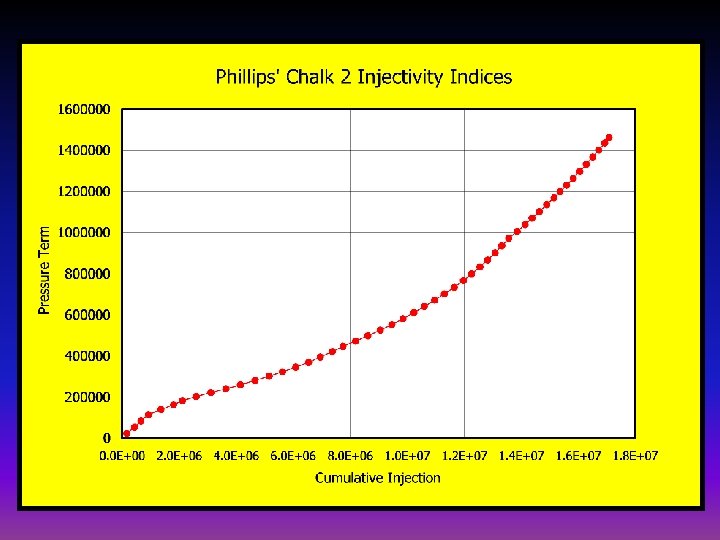
Phillips Chalk 2 Dump Flood
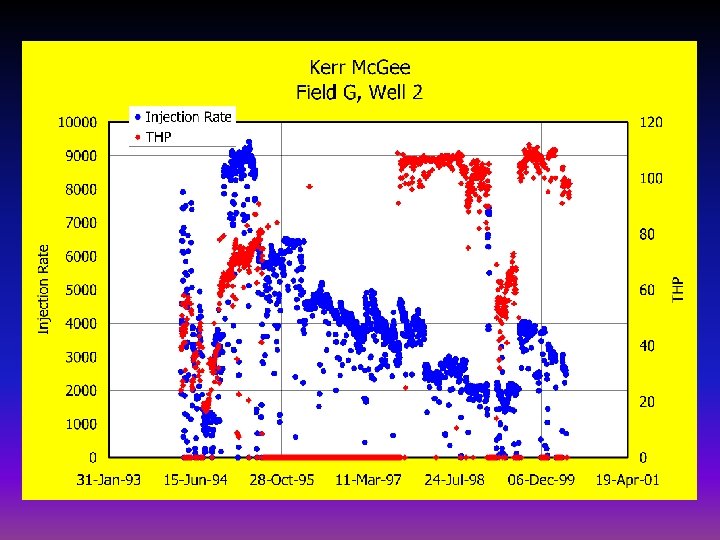
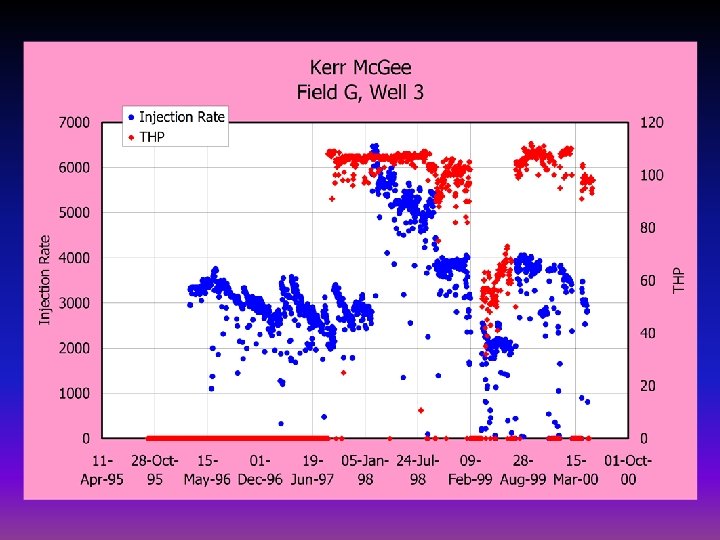
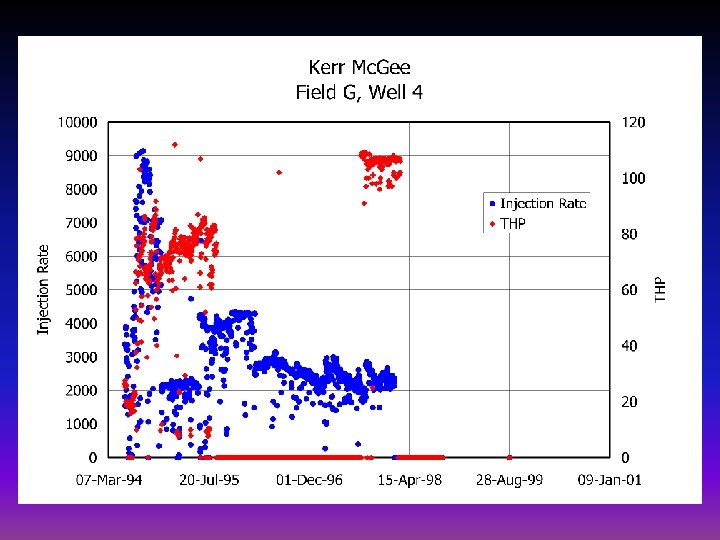
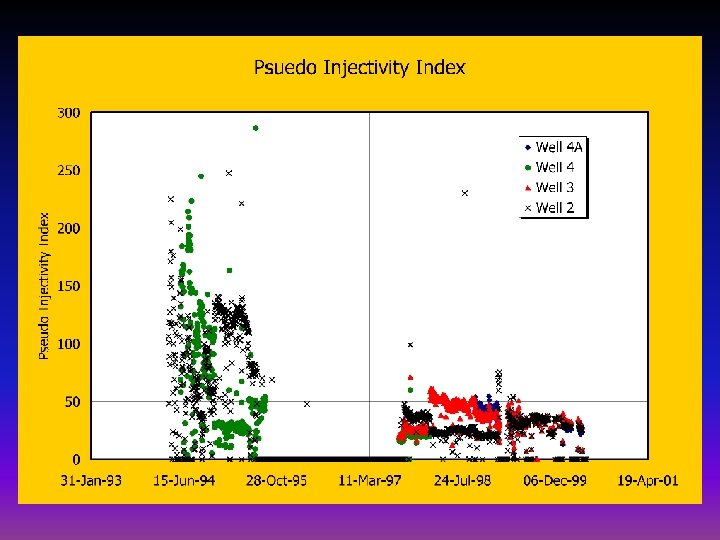
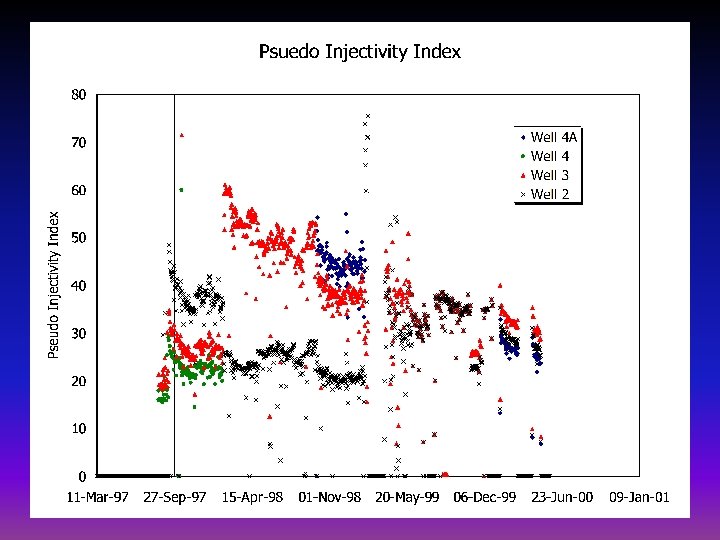
Kerr Mc. Gee G Field