
LTM 2 0 Project Overview Jeppe Rich Professor

- Slides: 32
LTM 2. 0 Project Overview Jeppe Rich Professor, Transport Modelling Group DTU
Background for LTM • Recommendation from expert group The foundation for making transport political decisions shall be strengthened by developing a national transport model system to support decisions related to all transport modes and their inherent dependency The model shall support economic assessment and strengthen the prioritisation within the transport sector 2 Netværksmøde folketinget 19. 2. 2018
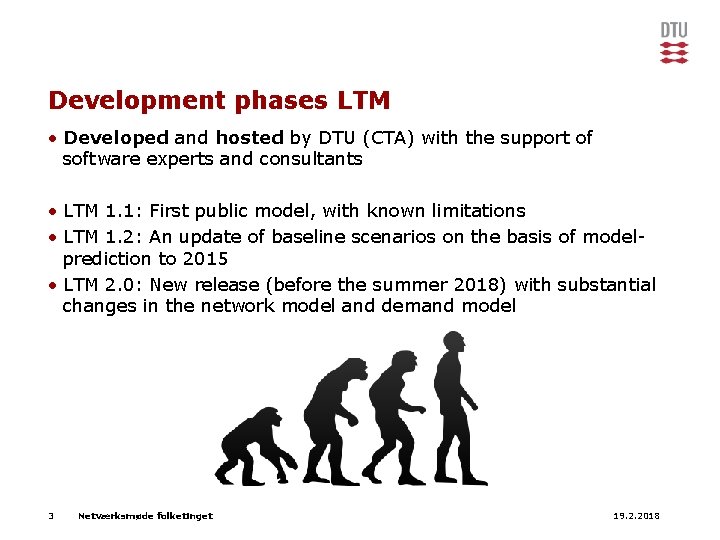
Development phases LTM • Developed and hosted by DTU (CTA) with the support of software experts and consultants • LTM 1. 1: First public model, with known limitations • LTM 1. 2: An update of baseline scenarios on the basis of modelprediction to 2015 • LTM 2. 0: New release (before the summer 2018) with substantial changes in the network model and demand model 3 Netværksmøde folketinget 19. 2. 2018
Main improvements in LTM 2. 0 • Improved car assignment model – Time-of-day assignment for Denmark and sourrounding countries – Improved modelling of crossings and thereby better modelling of congestion • Better international models • Improved modelling of aviation • Improved population synthesis and integration in interface • Improved calculation time • Better support and governance setup • …and many other things… 4 Netværksmøde folketinget 19. 2. 2018
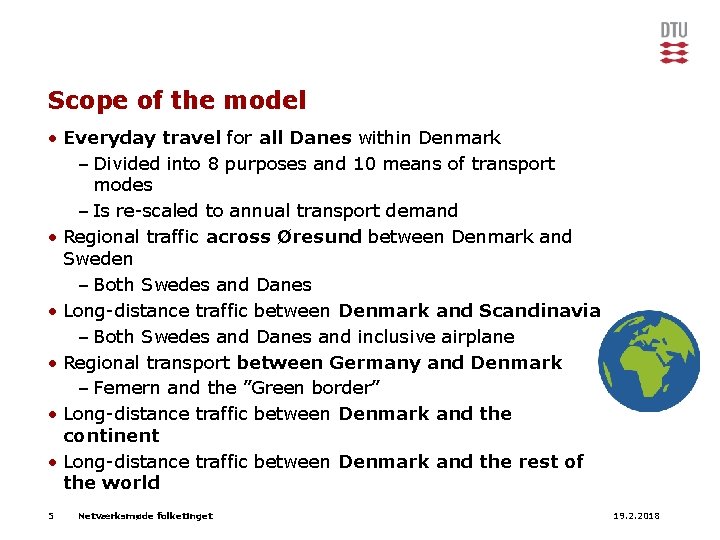
Scope of the model • Everyday travel for all Danes within Denmark – Divided into 8 purposes and 10 means of transport modes – Is re-scaled to annual transport demand • Regional traffic across Øresund between Denmark and Sweden – Both Swedes and Danes • Long-distance traffic between Denmark and Scandinavia – Both Swedes and Danes and inclusive airplane • Regional transport between Germany and Denmark – Femern and the ”Green border” • Long-distance traffic between Denmark and the continent • Long-distance traffic between Denmark and the rest of the world 5 Netværksmøde folketinget 19. 2. 2018
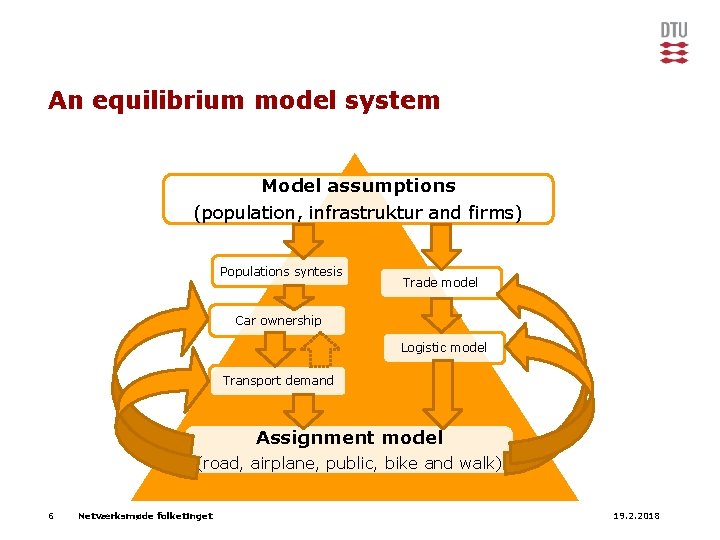
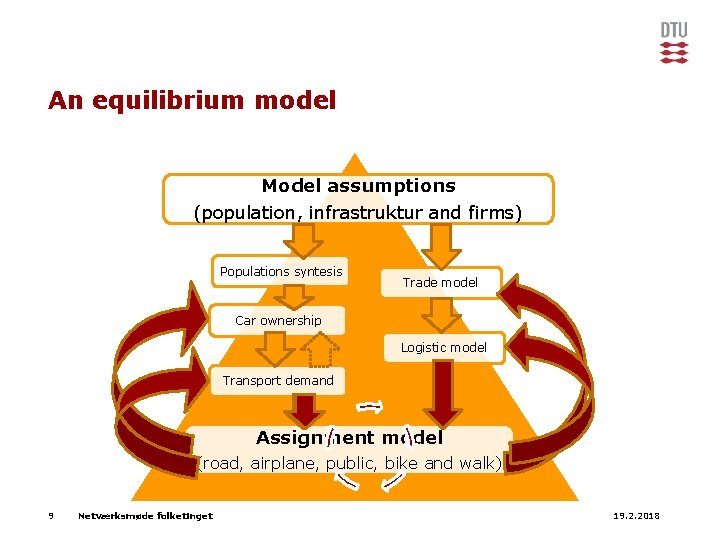
An equilibrium model system Model assumptions (population, infrastruktur and firms) Populations syntesis Trade model Car ownership Logistic model Transport demand Assignment model (road, airplane, public, bike and walk) 6 Netværksmøde folketinget 19. 2. 2018
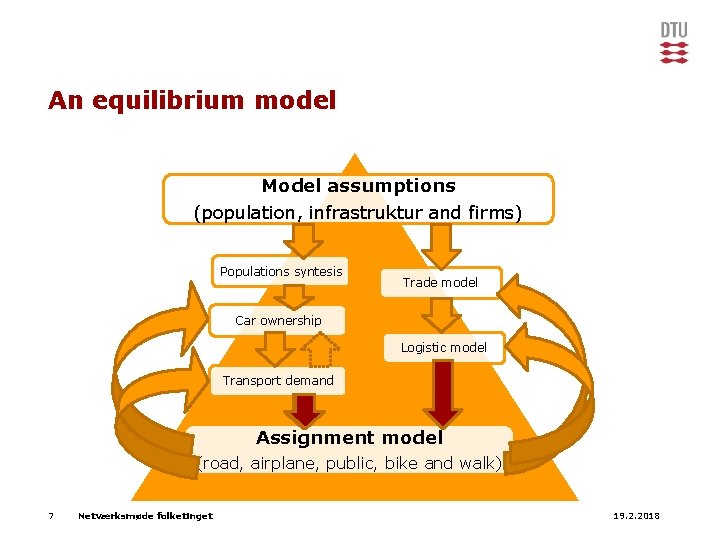
An equilibrium model Model assumptions (population, infrastruktur and firms) Populations syntesis Trade model Car ownership Logistic model Transport demand Assignment model (road, airplane, public, bike and walk) 7 Netværksmøde folketinget 19. 2. 2018
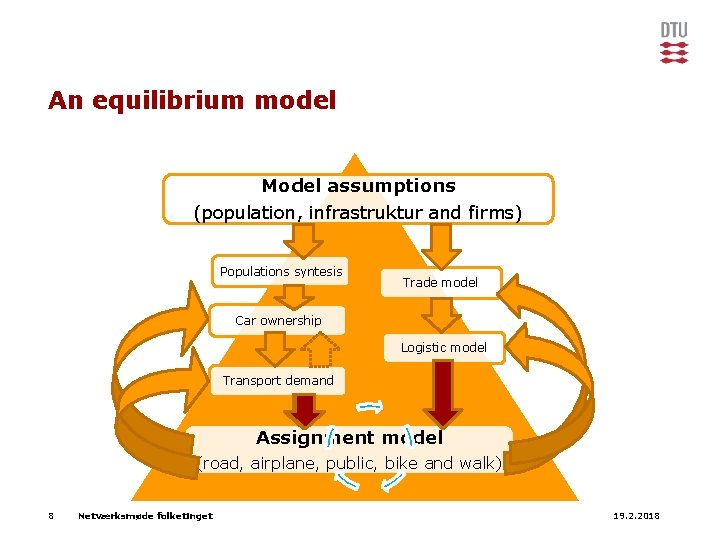
An equilibrium model Model assumptions (population, infrastruktur and firms) Populations syntesis Trade model Car ownership Logistic model Transport demand Assignment model (road, airplane, public, bike and walk) 8 Netværksmøde folketinget 19. 2. 2018
An equilibrium model Model assumptions (population, infrastruktur and firms) Populations syntesis Trade model Car ownership Logistic model Transport demand Assignment model (road, airplane, public, bike and walk) 9 Netværksmøde folketinget 19. 2. 2018
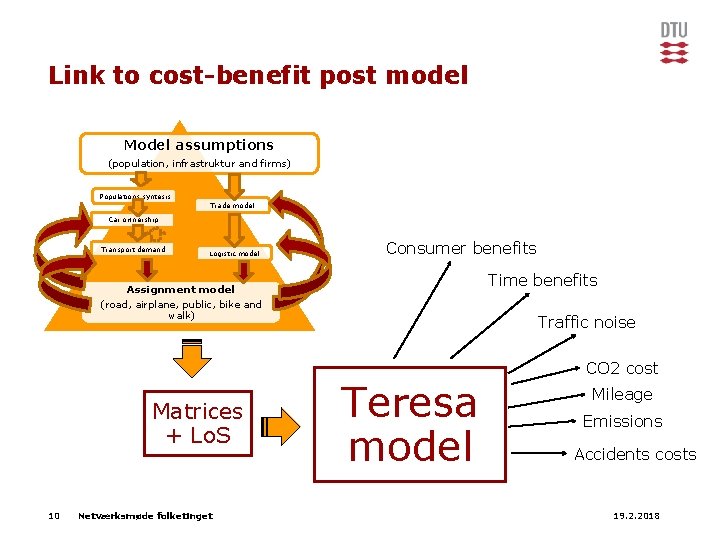
Link to cost-benefit post model Model assumptions (population, infrastruktur and firms) Populations syntesis Trade model Car ownership Transport demand Logistic model Consumer benefits Time benefits Assignment model (road, airplane, public, bike and walk) Matrices + Lo. S 10 Netværksmøde folketinget Traffic noise Teresa model CO 2 cost Mileage Emissions Accidents costs 19. 2. 2018
YALDA 11 Netværksmøde folketinget 19. 2. 2018
LTM 2. 0 Methodological Overview Jeppe Rich Professor, Transport Modelling Group DTU
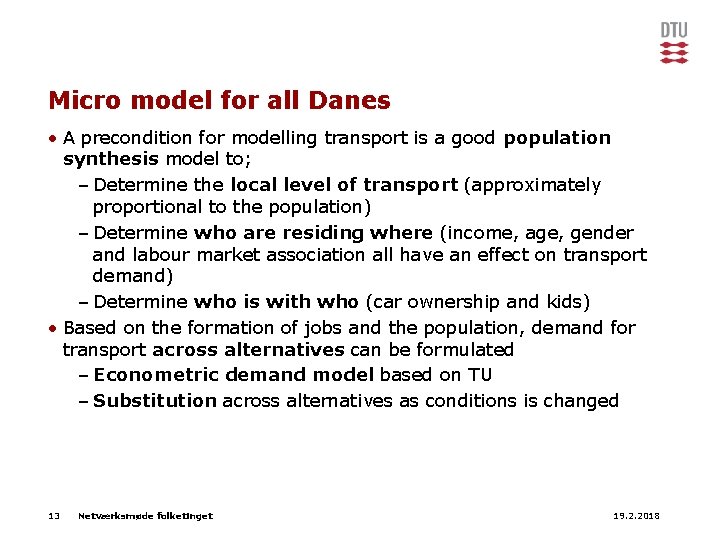
Micro model for all Danes • A precondition for modelling transport is a good population synthesis model to; – Determine the local level of transport (approximately proportional to the population) – Determine who are residing where (income, age, gender and labour market association all have an effect on transport demand) – Determine who is with who (car ownership and kids) • Based on the formation of jobs and the population, demand for transport across alternatives can be formulated – Econometric demand model based on TU – Substitution across alternatives as conditions is changed 13 Netværksmøde folketinget 19. 2. 2018
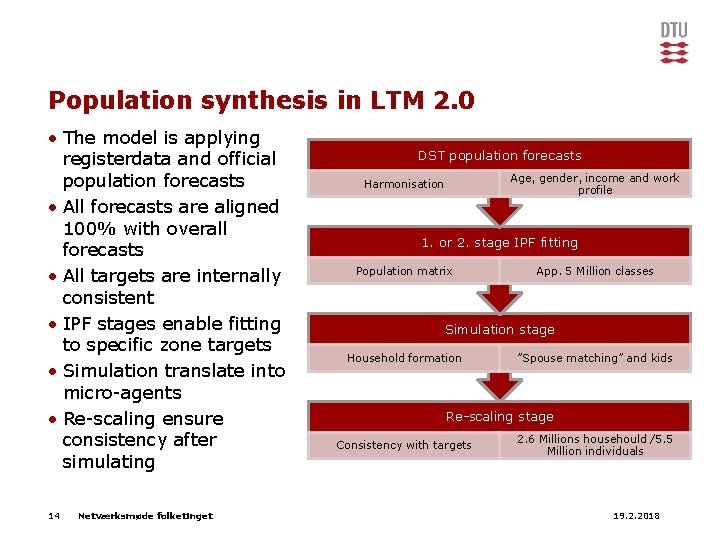
Population synthesis in LTM 2. 0 • The model is applying registerdata and official population forecasts • All forecasts are aligned 100% with overall forecasts • All targets are internally consistent • IPF stages enable fitting to specific zone targets • Simulation translate into micro-agents • Re-scaling ensure consistency after simulating 14 Netværksmøde folketinget DST population forecasts Age, gender, income and work profile Harmonisation 1. or 2. stage IPF fitting Population matrix App. 5 Million classes Simulation stage Household formation ”Spouse matching” and kids Re-scaling stage Consistency with targets 2. 6 Millions househould /5. 5 Million individuals 19. 2. 2018
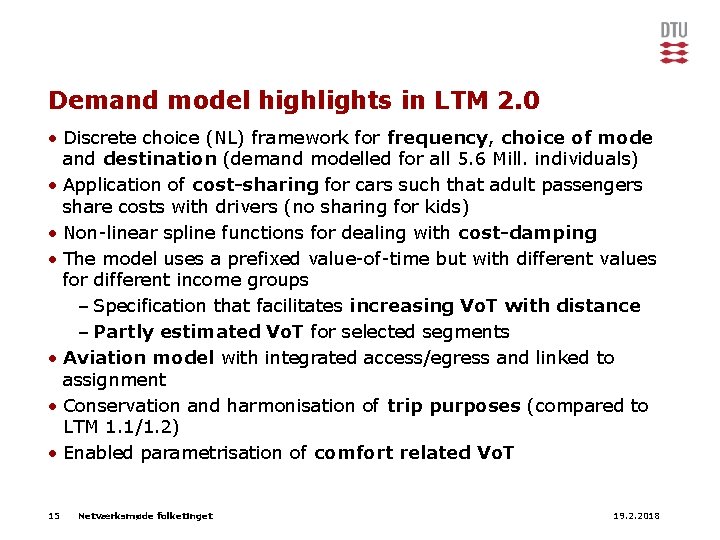
Demand model highlights in LTM 2. 0 • Discrete choice (NL) framework for frequency, choice of mode and destination (demand modelled for all 5. 6 Mill. individuals) • Application of cost-sharing for cars such that adult passengers share costs with drivers (no sharing for kids) • Non-linear spline functions for dealing with cost-damping • The model uses a prefixed value-of-time but with different values for different income groups – Specification that facilitates increasing Vo. T with distance – Partly estimated Vo. T for selected segments • Aviation model with integrated access/egress and linked to assignment • Conservation and harmonisation of trip purposes (compared to LTM 1. 1/1. 2) • Enabled parametrisation of comfort related Vo. T 15 Netværksmøde folketinget 19. 2. 2018
Modelling of congestion LTM version 2. 0 Transport Summit 2018 Thomas Kjær Rasmussen, tkra@dtu. dk
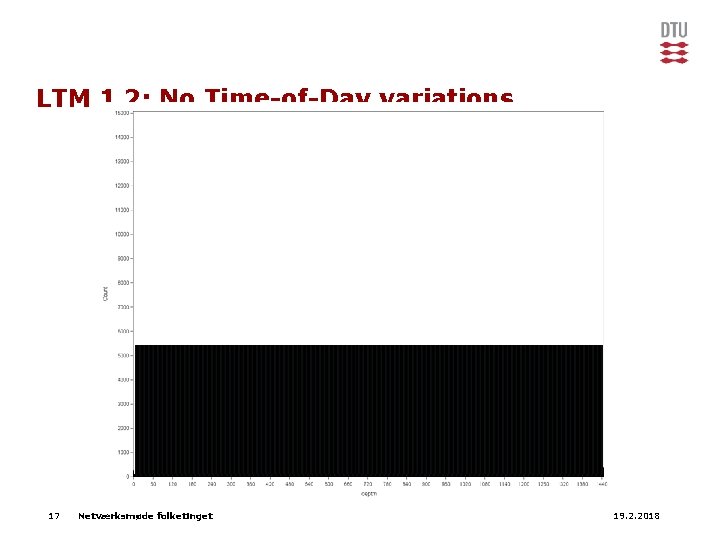
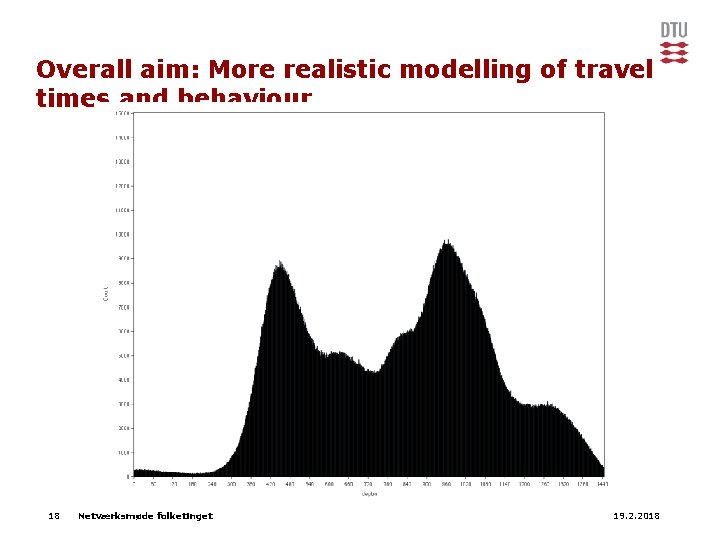
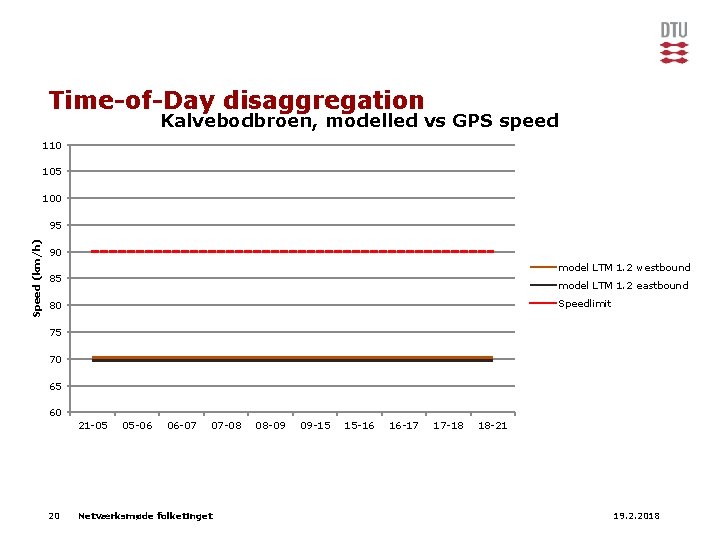
LTM 1. 2: No Time-of-Day variations 17 Netværksmøde folketinget 19. 2. 2018
Overall aim: More realistic modelling of travel times and behaviour 18 Netværksmøde folketinget 19. 2. 2018
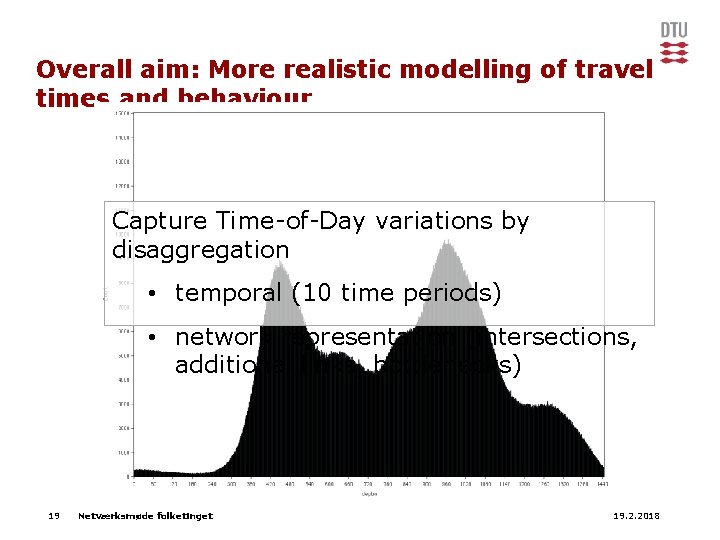
Overall aim: More realistic modelling of travel times and behaviour Capture Time-of-Day variations by disaggregation • temporal (10 time periods) • network representation (intersections, additional links, bottlenecks) 19 Netværksmøde folketinget 19. 2. 2018
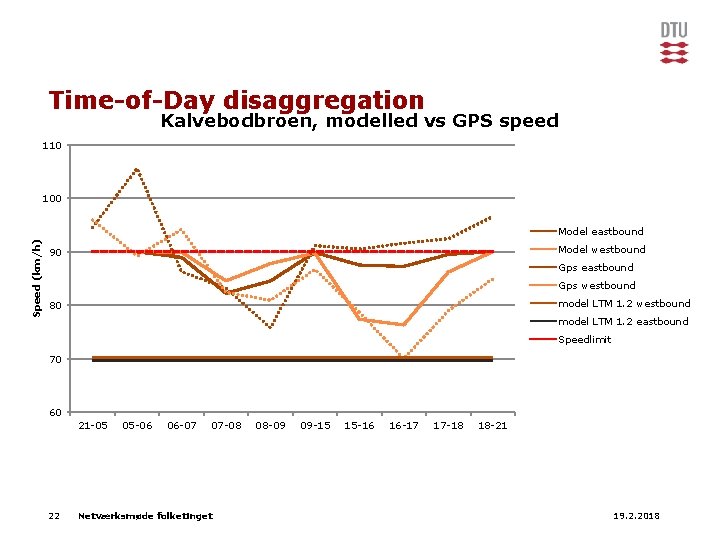
Time-of-Day disaggregation Kalvebodbroen, modelled vs GPS speed 110 105 100 Speed (km/h) 95 90 model LTM 1. 2 westbound 85 model LTM 1. 2 eastbound Speedlimit 80 75 70 65 60 21 -05 20 05 -06 06 -07 07 -08 Netværksmøde folketinget 08 -09 09 -15 15 -16 16 -17 17 -18 18 -21 19. 2. 2018
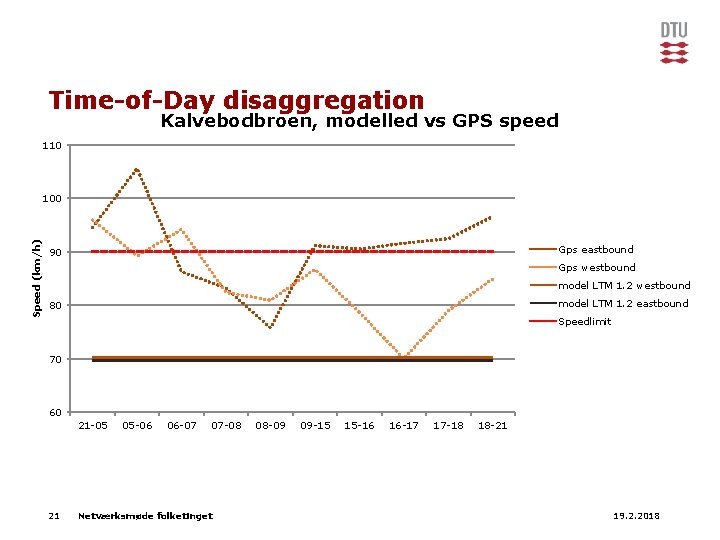
Time-of-Day disaggregation Kalvebodbroen, modelled vs GPS speed 110 Speed (km/h) 100 Gps eastbound 90 Gps westbound model LTM 1. 2 eastbound 80 Speedlimit 70 60 21 -05 21 05 -06 06 -07 07 -08 Netværksmøde folketinget 08 -09 09 -15 15 -16 16 -17 17 -18 18 -21 19. 2. 2018
Time-of-Day disaggregation Kalvebodbroen, modelled vs GPS speed 110 100 Speed (km/h) Model eastbound Model westbound 90 Gps eastbound Gps westbound model LTM 1. 2 westbound 80 model LTM 1. 2 eastbound Speedlimit 70 60 21 -05 22 05 -06 06 -07 07 -08 Netværksmøde folketinget 08 -09 09 -15 15 -16 16 -17 17 -18 18 -21 19. 2. 2018
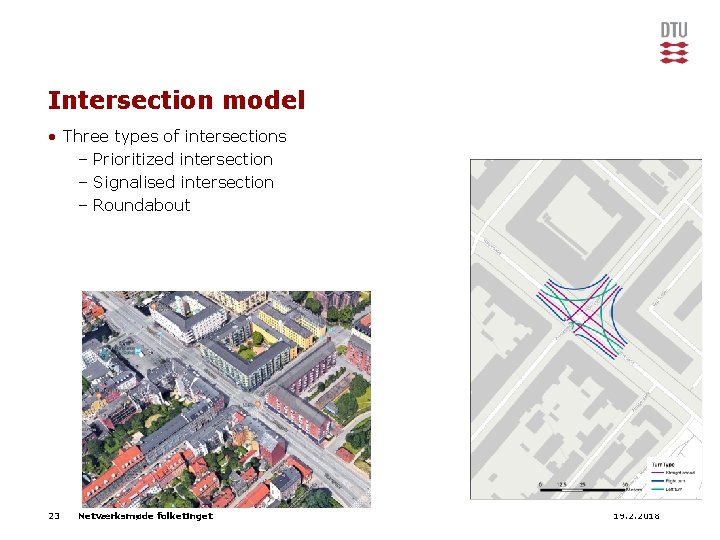
Intersection model • Three types of intersections – Prioritized intersection – Signalised intersection – Roundabout 23 Netværksmøde folketinget 19. 2. 2018
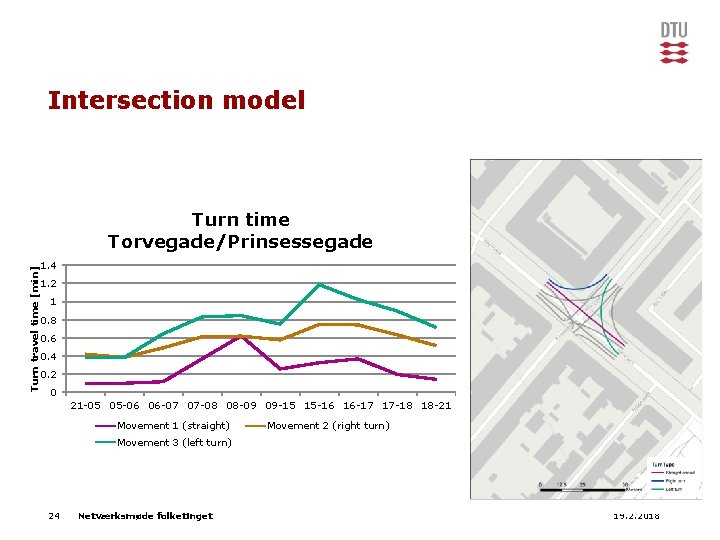
Intersection model Turn travel time [min] Turn time Torvegade/Prinsessegade 1. 4 1. 2 1 0. 8 0. 6 0. 4 0. 2 0 21 -05 05 -06 06 -07 07 -08 08 -09 09 -15 15 -16 16 -17 17 -18 18 -21 Movement 1 (straight) Movement 2 (right turn) Movement 3 (left turn) 24 Netværksmøde folketinget 19. 2. 2018
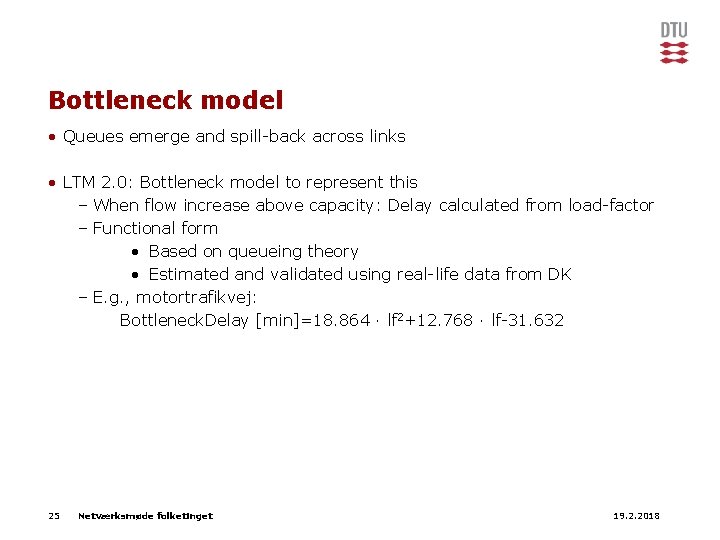
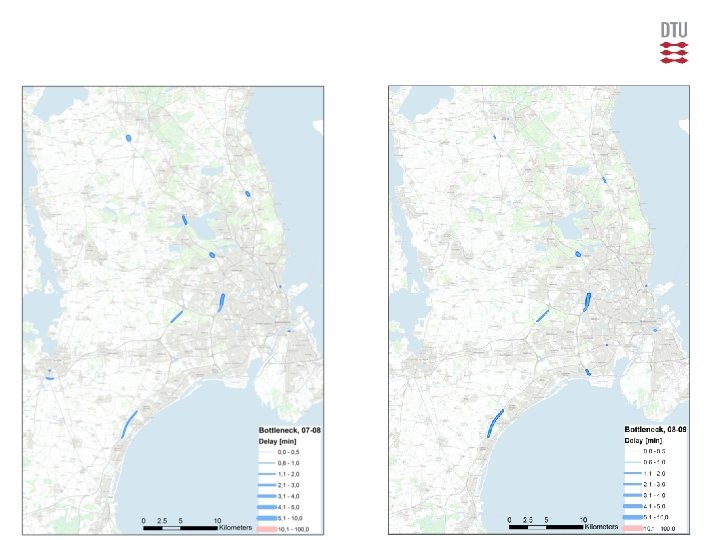
Bottleneck model • Queues emerge and spill-back across links • LTM 2. 0: Bottleneck model to represent this – When flow increase above capacity: Delay calculated from load-factor – Functional form • Based on queueing theory • Estimated and validated using real-life data from DK – E. g. , motortrafikvej: Bottleneck. Delay [min]=18. 864 ∙ lf 2+12. 768 ∙ lf-31. 632 25 Netværksmøde folketinget 19. 2. 2018
Bottleneck model 26 Netværksmøde folketinget 19. 2. 2018
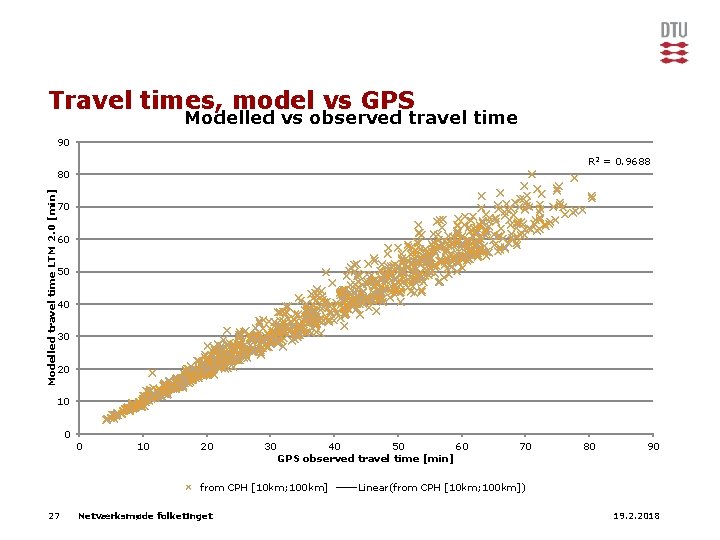
Travel times, model vs GPS Modelled vs observed travel time 90 R 2 = 0. 9688 Modelled travel time LTM 2. 0 [min] 80 70 60 50 40 30 20 10 0 0 10 20 30 40 50 60 GPS observed travel time [min] from CPH [10 km; 100 km] 27 Netværksmøde folketinget 70 80 90 Linear(from CPH [10 km; 100 km]) 19. 2. 2018
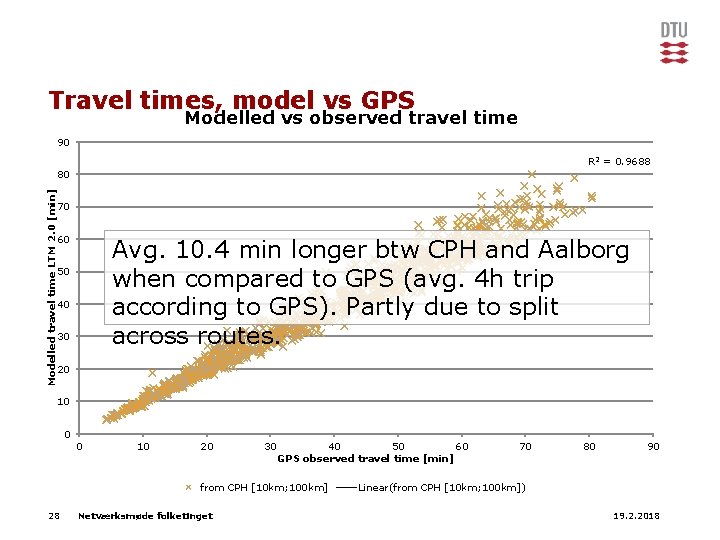
Travel times, model vs GPS Modelled vs observed travel time 90 R 2 = 0. 9688 Modelled travel time LTM 2. 0 [min] 80 70 60 Avg. 10. 4 min longer btw CPH and Aalborg when compared to GPS (avg. 4 h trip according to GPS). Partly due to split across routes. 50 40 30 20 10 0 0 10 20 30 40 50 60 GPS observed travel time [min] from CPH [10 km; 100 km] 28 Netværksmøde folketinget 70 80 90 Linear(from CPH [10 km; 100 km]) 19. 2. 2018
Beyond LTM 2. 0 Jeppe Rich Professor, Transport Modelling Group DTU
Research activities that could enter the next version of LTM • New simulation based-population synthesis (for better scalability) • Combined job and population synthesis (for improved job forecasts) • Combined frequency based and schedule based public assignment (for easier scenario exploration) • The adding of shared mobility solutions (Drive. Now/Green. Mobility/Go. More) • Time-of-day choice in the demand model (for better integration with assignment) • Improved car-ownership model with different classes (inclusive Evs) 30 Netværksmøde folketinget 19. 2. 2018
Other research activities related to LTM with a longer time horizon • Demand for autonomous transport modes – Prediction of market penetration and impact on transport • Supply effects of autonomous vehicles based on V 2 V models – Based on micro-simulation and not applicable for large-scale modelling • Possible integration with ”live models” or simulation based meta models such as Mat. Sim – Could enable an even better dynamic modelling of congestion 31 Netværksmøde folketinget 19. 2. 2018
32 Netværksmøde folketinget 19. 2. 2018