Lowering sugars in diabetes a cardiovascular waste of

Lowering sugars in diabetes – a cardiovascular waste of time? Hamish Courtney Regional Endocrine Centre Royal Victoria Hospital Belfast

 RR=2. 88 (2. 37– 3. 49)")
OASIS Study: Total Mortality Diabetes/CVD (n = 1148) RR=2. 88 (2. 37– 3. 49) Diabetes/No CVD (n = 569) No Diabetes/CVD (n = 3503) No Diabetes/No CVD (n = 2796) Event Rate RR=1. 99 (1. 52– 2. 60) RR=1. 71 (1. 44– 2. 04) RR=1. 00 3 6 9 12 15 18 21 24 Months Malmberg K et al. Circulation 2000; 102: 1014 -1019.
 Estimates of Diabetes Prevalence in World Regions 1995 Africa 2000 2025")
Estimated prevalence (millions) Estimates of Diabetes Prevalence in World Regions 1995 Africa 2000 2025 Americas Eastern Europe Mediterranean WHO Report 1997. World Health Organization. Geneva; 1997. Southeast Asia Western Pacific


How low can you go. . . safely?

UKPDS United Kingdom Prospective Diabetes Study
 342 allocated to metformin 3867 Conventional Policy 30% (n=1138)")
UKPDS Main Randomisation n=4209 (82%) 342 allocated to metformin 3867 Conventional Policy 30% (n=1138) Intensive Policy 70% (n=2729) Sulphonylurea n=1573 Insulin n=1156

Hb. A 1 c

UKPDS Microvascular Endpoints
 RR=2. 88 (2. 37– 3. 49)")
OASIS Study: Total Mortality Diabetes/CVD (n = 1148) RR=2. 88 (2. 37– 3. 49) Diabetes/No CVD (n = 569) No Diabetes/CVD (n = 3503) No Diabetes/No CVD (n = 2796) Event Rate RR=1. 99 (1. 52– 2. 60) RR=1. 71 (1. 44– 2. 04) RR=1. 00 3 6 9 12 15 18 21 24 Months Malmberg K et al. Circulation 2000; 102: 1014 -1019.

Fatal and Non-Fatal Myocardial Infarction Hazard ratio 5 p<0. 0001 1 14% change per 1% change in Hb. A 1 c 0. 5 0 5 6 7 8 9 Updated mean Hb. A 1 c UKPDS 35. BMJ 2000; 321: 405 -12 10 11

UKPDS and myocardial infarction % of patients with MI 30 Conventional Intensive p=0. 06 20 10 Risk reduction 16% (CI 95%: 0 -29%) 0 0 3 6 Years after randomisation 9 12 15 UKPDS 33 Lancet. 1998; 352: 837 -853
 Chlorpropamide (619)")
UKPDS and myocardial infarction % of patients with MI 40 Conventional (896) Chlorpropamide (619) Glibenclamide (615) Insulin (911) 30 20 10 Cv. Gv. I P =0. 66 0 0 3 6 9 Years after randomisation 12 15

Myocardial Infarction Mv. C p=0. 010 Mv. I p=0. 12
 North-American multicentre study Duration: 8 years (1961 -1969) 1027")
University Group Diabetes Program (UGDP) North-American multicentre study Duration: 8 years (1961 -1969) 1027 patients randomised into 5 groups Placebo Tolbutamide Phenformin Insulin - diet - fixed dosage 1. 5 g/d - fixed dosage 100 mg/d - fixed dosage Insulin - adjusted dosage Klimt et al. Diabetes. 1970; 19(suppl 2): 747 -783
: 789 -830")
UGDP Meinert et al. Diabetes. 1970; 19(suppl 2): 789 -830

Intensive glycaemic control Does intensive glycaemic control reduce cardiovascular outcomes in T 2 DM? - ACCORD - ADVANCE - VADT - UKPDS follow up
 62 ± 7 yrs 66")
ACCORD ADVANCE VADT Number 10251 11140 1791 Age (±SD) 62 ± 7 yrs 66 ± 6 yrs 60 ± 9 yrs Duration 10 yrs 8 yrs 11 yrs Hb. A 1 c 8. 1% 7. 5% 9. 4% Glycaemic intervention Agents <6 vs 77. 9% Any <6. 5% vs <6% vs local targets Gliclazide Any
 vs Standard (Hb. A 1")
ACCORD Glycaemic intervention Intensive (Hb. A 1 c <6%) vs Standard (Hb. A 1 c 7. 0 -7. 9%) Primary end point nonfatal MI, stroke or cardiovascular death

Glycaemic Control N Engl J Med 2008; 358: 2545 -2559
 Intensive therapy (n = 5128) Standard therapy (n =")
ACCORD: Glucose-lowering drugs Patients (%) Intensive therapy (n = 5128) Standard therapy (n = 5123) Metformin 94. 7 86. 9 SU 86. 6 73. 8 Thiazolidinedione α-Glucosidase inhibitor Incretin 91. 7 58. 3 23. 2 5. 1 17. 8 4. 9 Insulin 77. 3 55. 4 N Engl J Med 2008; 358: 2545 -2559

ACCORD Primary Outcome N Engl J Med 2008; 358: 2545 -2559
 vs Standard")
ADVANCE Glycaemic intervention Intensive using gliclazide (Hb. A 1 c <6. 5%) vs Standard (Hb. A 1 c to local guidelines) Primary end point composite macrovascular and microvascular events
 Intensive therapy (n = 4828) Standard therapy (n =")
ADVANCE: Glucose-lowering drugs Patients (%) Intensive therapy (n = 4828) Standard therapy (n = 4741) Gliclazide (modified release) 90. 5 1. 6 Other sulphonylurea 1. 9 57. 1 Metformin 73. 8 67. 0 Thiazolidinedione 16. 8 10. 9 Acarbose 19. 1 12. 6 Glinide 1. 2 2. 8 Insulin 40. 5 24. 1 ADVANCE Collaborative Group. N Engl J Med. 2008; 358: 2560 -72.
 HR")
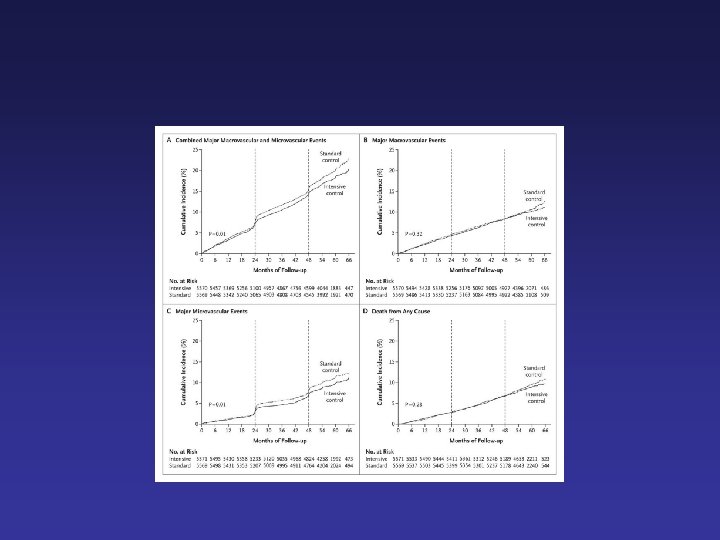
ADVANCE: primary macrovascular outcome CV death, MI, stroke 25 20 Cumulative incidence (%) HR 0. 94 (0. 84 -1. 06) P = 0. 32 15 Standard control 10 Intensive control 5 0 0 6 12 18 24 30 36 42 48 54 60 66 Follow-up (months) ADVANCE Collaborative Group. N Engl J Med. 2008; 358: 2560 -72.
 HR 0. 93 (0. 83 -1.")
ADVANCE: all-cause mortality 25 20 Cumulative incidence (%) HR 0. 93 (0. 83 -1. 06) P = 0. 28 15 Standard control 10 Intensive control 5 0 0 6 12 18 24 30 36 42 48 54 60 66 Follow-up (months) ADVANCE Collaborative Group. N Engl J Med. 2008; 358: 2560 -72.
 HR 0.")
ADVANCE: primary microvascular outcome New/worsening nephropathy, retinopathy 25 20 Cumulative incidence (%) HR 0. 86 (0. 77 -0. 97) P = 0. 01 15 Standard control 10 Intensive control 5 0 0 6 12 18 24 30 36 42 48 54 60 66 Follow-up (months) ADVANCE Collaborative Group. N Engl J Med. 2008; 358: 2560 -72.
 vs Standard (Hb. A")
VADT Glycaemic intervention Intensive (Hb. A 1 c <6. 0%) vs Standard (Hb. A 1 c to local guidelines) Primary end point composite macrovascular event

VADT Duckworth W et al. N Engl J Med 2009; 360: 129 -139

VADT Duckworth W et al. N Engl J Med 2009; 360: 129 -139

Reasons? Drugs used?
 Intensive therapy (n = 5128) Standard therapy (n =")
ACCORD: Glucose-lowering drugs Patients (%) Intensive therapy (n = 5128) Standard therapy (n = 5123) Metformin 94. 7 86. 9 SU 86. 6 73. 8 Thiazolidinedione α-Glucosidase inhibitor Incretin 91. 7 58. 3 23. 2 5. 1 17. 8 4. 9 Insulin 77. 3 55. 4 N Engl J Med 2008; 358: 2545 -2559

Reasons? Drugs used? Increase in hypoglycaemia? Increase in weight? Too rapid reduction in Hb. A 1 c?

Glycaemic Control N Engl J Med 2008; 358: 2545 -2559

Reasons? Drugs used? Increase in hypoglycaemia? Increase in weight? Too rapid reduction in Hb. A 1 c? Chance?

UKPDS and myocardial infarction % of patients with MI 30 Conventional Intensive p=0. 06 20 10 Risk reduction 16% (CI 95%: 0 -29%) 0 0 3 6 Years after randomisation 9 12 15 UKPDS 33 Lancet. 1998; 352: 837 -853
")
Post-Trial Changes in Hb. A 1 c UKPDS results presented Mean (95%CI)

Any Diabetes-related Endpoint Intervention Trial + Post-trial monitoring Median follow-up 10. 0 years Median follow-up 16. 8 years RR=0. 88 (0. 79 -0. 99) P=0. 029 Conventional Sulfonylurea/ Insulin
 Intensive (SU/Ins)")
Myocardial Infarction Hazard Ratio (fatal or non-fatal myocardial infarction or sudden death) Intensive (SU/Ins) vs. Conventional glucose control HR (95%CI)
 vs. Conventional glucose control HR (95%CI)")
All-cause Mortality Hazard Ratio Intensive (SU/Ins) vs. Conventional glucose control HR (95%CI)

Legacy Effect of Earlier Glucose Control Aggregate Endpoint 1997 2007 Any diabetes related endpoint RRR: P: 12% 0. 029 9% 0. 040 Microvascular disease RRR: P: 25% 0. 0099 24% 0. 001 Myocardial infarction RRR: P: 16% 0. 052 15% 0. 014 All-cause mortality RRR: P: 6% 0. 44 13% 0. 007 RRR = Relative Risk Reduction, P = Log Rank


Age ACCORD ADVANCE VADT ~60 s Diabetes duration ~10 yrs Macrovascular disease ~1/3 Length of follow ~5 yrs -up

ACCORD ADVANCE VADT ~60 s UKPDS Diabetes duration ~10 yrs New onset Macrovascular disease ~1/3 ~1/15 Age Length of follow ~5 yrs -up 53 17 yrs
 20")
ACCORD/ADVANCE 25 N Engl J Med 2008; 358: 2545 -2559 Cumulative incidence (%) 20 Standard control 15 10 Intensive control 5 0 0 6 12 18 24 30 36 42 48 54 60 66 Follow-up (months) N Engl J Med. 2008; 358: 2560 -72.

Glucose lowering? 1. Glucose lowering reduces microvascular complications 2. Intensive glucose lowering with complex regimens in patients with “established” diabetes is unlikely to have a short term cardiovascular benefit and may indeed be harmful

Glucose lowering? 3. The presence of a legacy effect argues for early intensive glucose lowering 4. Target Hb. A 1 c to 6. 5% except where this requires complex treatment regimens or life expectancy is less than 5 years
 Steno-2 Study Intensive Therapy")
Patients Reaching Intensive-Treatment Goals at Mean 7. 8 y, (%) Steno-2 Study Intensive Therapy Conventional Therapy P=0. 21 P<0. 001 P=0. 19 P=0. 001 P=0. 06 Glycosylated haemoglobin <6. 5% Cholesterol <175 mg/dl Triglycerides Systolic BP Diastolic BP <150 mg/dl <130 mm Hg <80 mm Hg Gæde P et al. N Engl J Med 2003; 348: 383 -393 Slide Source Lipids Online Slide Library www. lipidsonline. org
 Steno-2 primary outcome P=0. 007 Conventional Therapy Hazard ratio =")
Primary Composite Endpoint (%) Steno-2 primary outcome P=0. 007 Conventional Therapy Hazard ratio = 0. 47 (95% CI, 0. 24– 0. 73; P=0. 008) Intensive Therapy 0 12 24 36 48 60 72 Months of Follow-up Gæde P et al. N Engl J Med 2003; 348: 383 -393 84 96 Slide Source Lipids Online Slide Library www. lipidsonline. org

Steno-2 Follow up Gaede P et al. N Engl J Med 2008; 358: 580 -591 Slide Source Lipids Online Slide Library www. lipidsonline. org

Steno-2 follow up primary endpoint Gaede P et al. N Engl J Med 2008; 358: 580 -591

Steno-2 follow up secondary endpoint Gaede P et al. N Engl J Med 2008; 358: 580 -591

Glucose lowering – waste of time? § Glucose lowering, started early, may have long term cardiovascular benefits § Multifactorial risk reduction is imperative
- Slides: 58