
Lower Shale Porosities Are Better Mihai Vasilache Chris

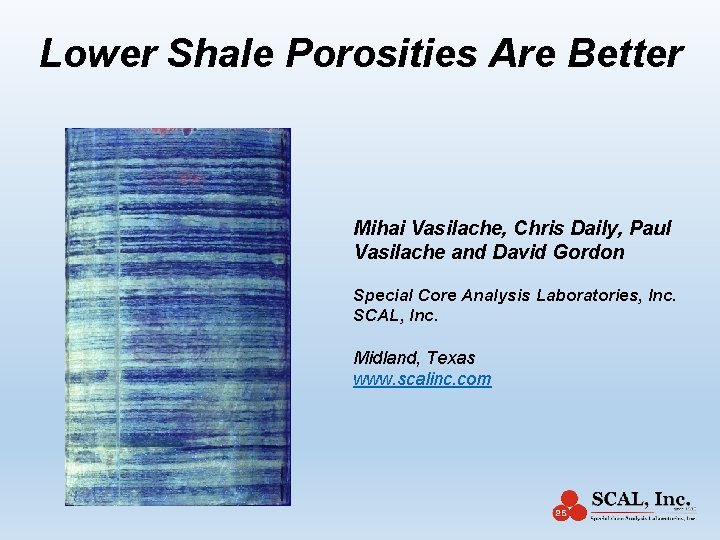
Lower Shale Porosities Are Better Mihai Vasilache, Chris Daily, Paul Vasilache and David Gordon Special Core Analysis Laboratories, Inc. SCAL, Inc. Midland, Texas www. scalinc. com
Commercial Oil and Gas Essentials Primary Reservoir • Deposition, Burial and Compaction of Mineral and Organic Material • Hydrocarbon Generation and Migration • High Generation Pressures (higher than hydrostatic plus capillary pressure) • Open system (fast slug then slower relative permeability flow). • Closed system (slow diffusion). Eventually only gas can be generated. • Trapping (the shale source rock under continuous compaction due to the small grain size transforms into a seal providing): • structural trap for the oil • molecular trapping for the gas in the shale source • Storage – Porosity, Oil Fluorescence. This is the oil reservoir rock. • Transport – Combination of Matrix and Fracture Permeability • Horizontal Drilling and Multi Stage Fracturing (connect the reservoir rock)
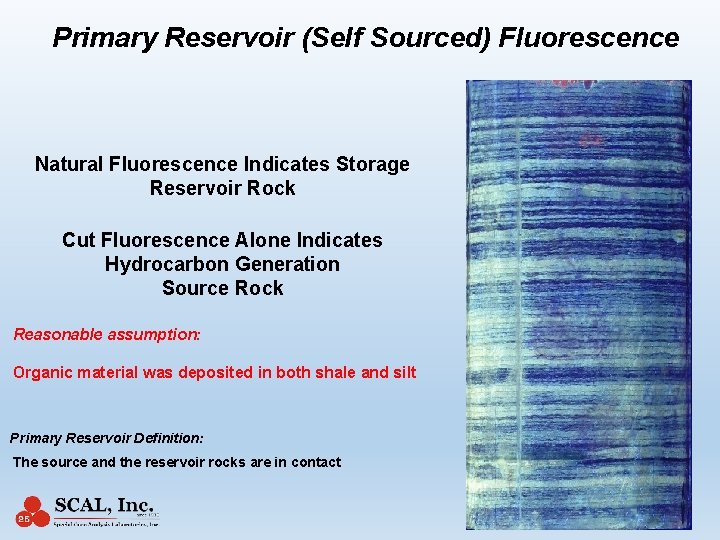
Primary Reservoir (Self Sourced) Fluorescence Natural Fluorescence Indicates Storage Reservoir Rock Cut Fluorescence Alone Indicates Hydrocarbon Generation Source Rock Reasonable assumption: Organic material was deposited in both shale and silt Primary Reservoir Definition: The source and the reservoir rocks are in contact
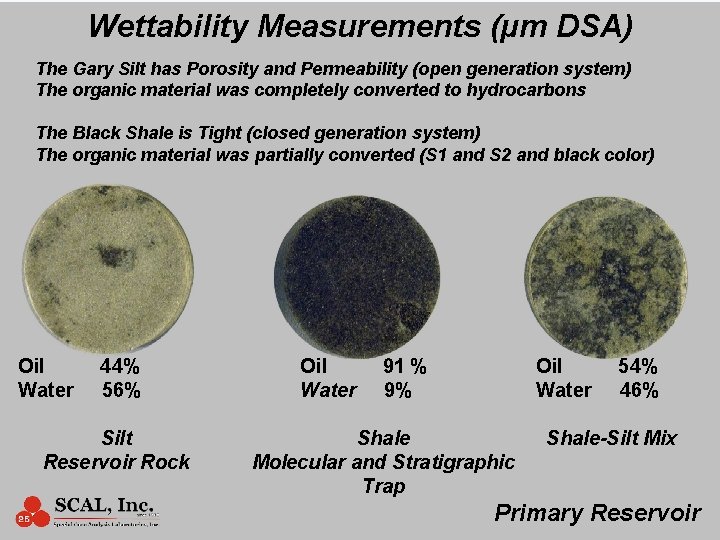
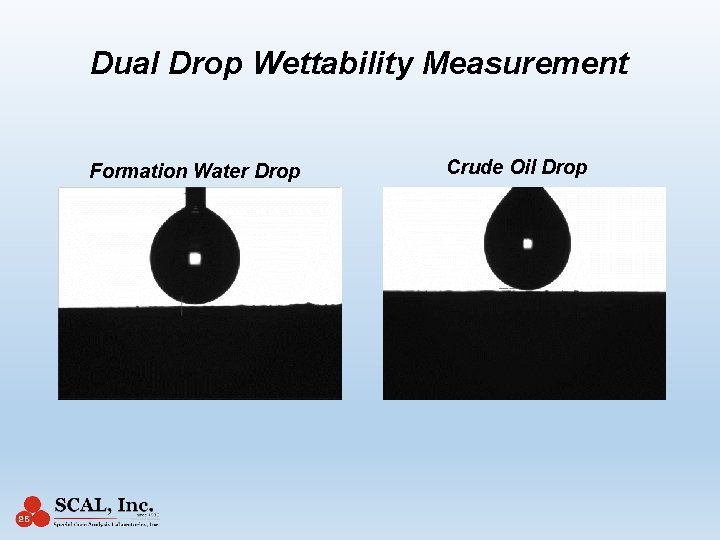
Wettability Measurements (µm DSA) The Gary Silt has Porosity and Permeability (open generation system) The organic material was completely converted to hydrocarbons The Black Shale is Tight (closed generation system) The organic material was partially converted (S 1 and S 2 and black color) Oil Water 44% 56% Silt Reservoir Rock Oil Water 91 % 9% Oil Water Shale Molecular and Stratigraphic Trap 54% 46% Shale-Silt Mix Primary Reservoir
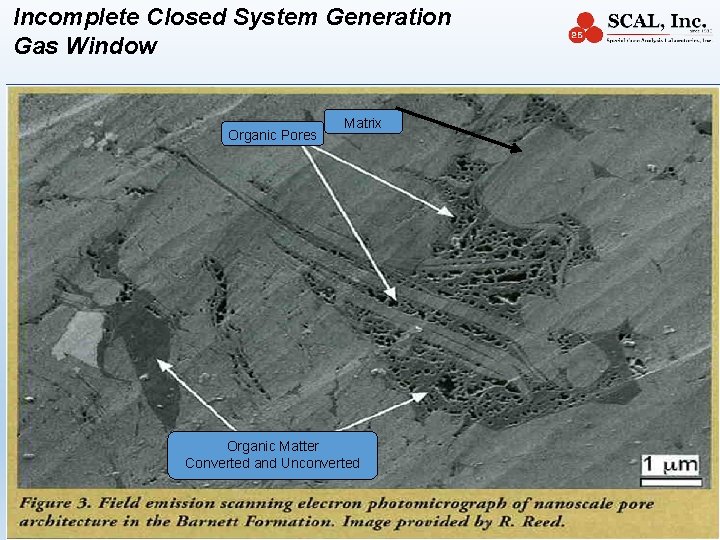
Incomplete Closed System Generation Gas Window Organic Pores Matrix Organic Matter Converted and Unconverted 6
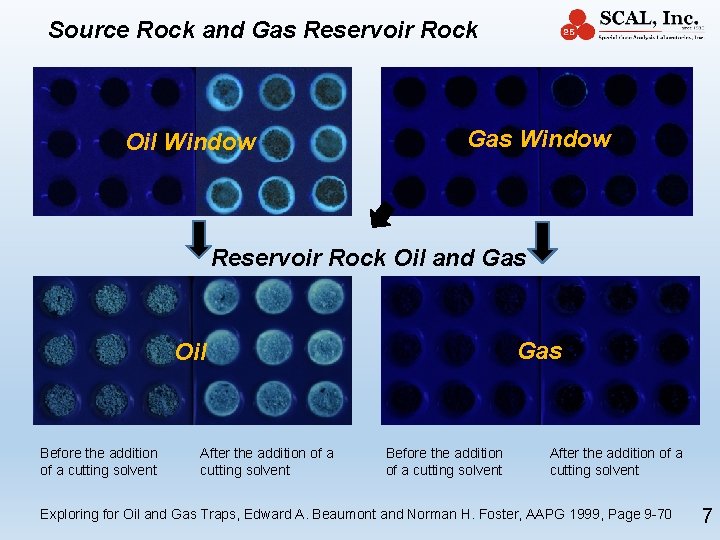
Source Rock and Gas Reservoir Rock Oil Window Gas Window Reservoir Rock Oil and Gas Oil Before the addition of a cutting solvent After the addition of a cutting solvent Exploring for Oil and Gas Traps, Edward A. Beaumont and Norman H. Foster, AAPG 1999, Page 9 -70 7
Introducing: The Organic Shale Porosity -Temperature Diagram
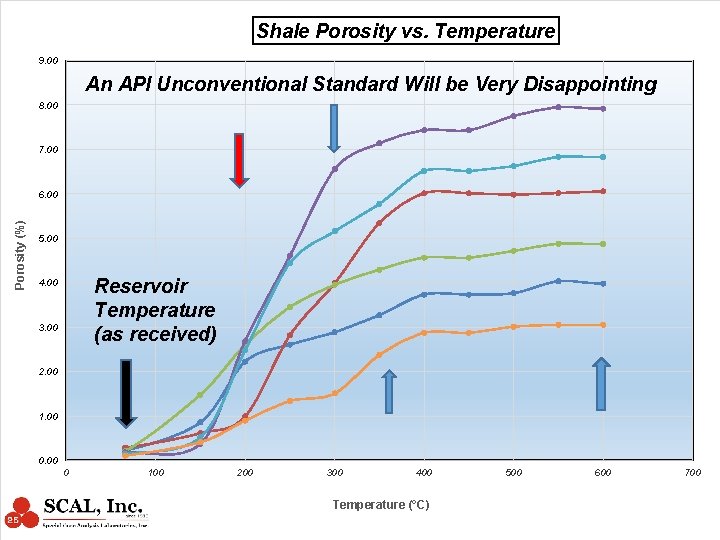
Shale Porosity vs. Temperature 9. 00 An API Unconventional Standard Will be Very Disappointing 8. 00 7. 00 Porosity (%) 6. 00 5. 00 Reservoir Temperature (as received) 4. 00 3. 00 2. 00 1. 00 0 100 200 300 400 Temperature (°C) 500 600 700
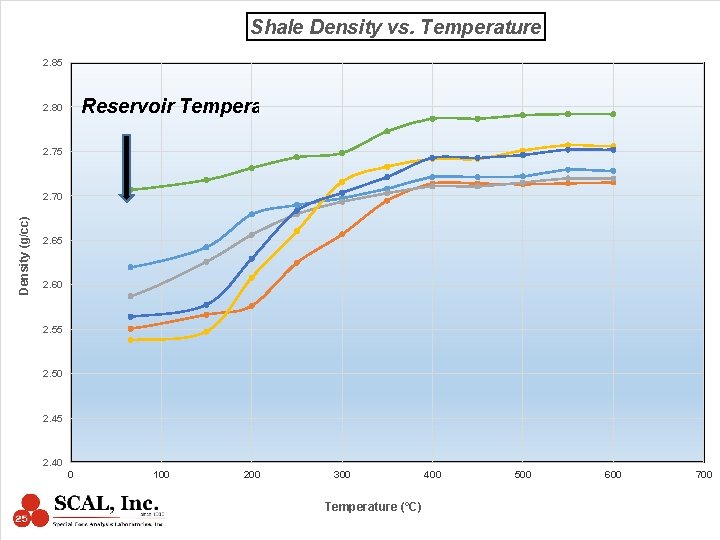
Shale Density vs. Temperature 2. 85 Reservoir Temperature 2. 80 2. 75 Density (g/cc) 2. 70 2. 65 2. 60 2. 55 2. 50 2. 45 2. 40 0 100 200 300 Temperature (°C) 400 500 600 700
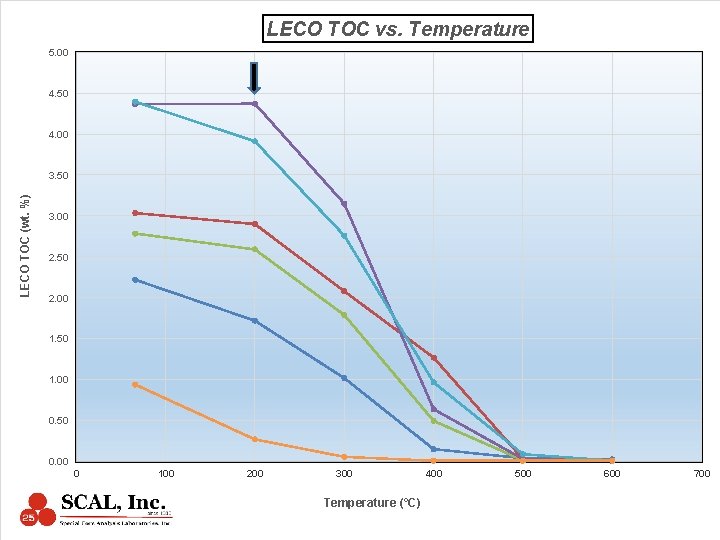
LECO TOC vs. Temperature 5. 00 4. 50 4. 00 LECO TOC (wt. %) 3. 50 3. 00 2. 50 2. 00 1. 50 1. 00 0. 50 0. 00 0 100 200 300 Temperature (°C) 400 500 600 700
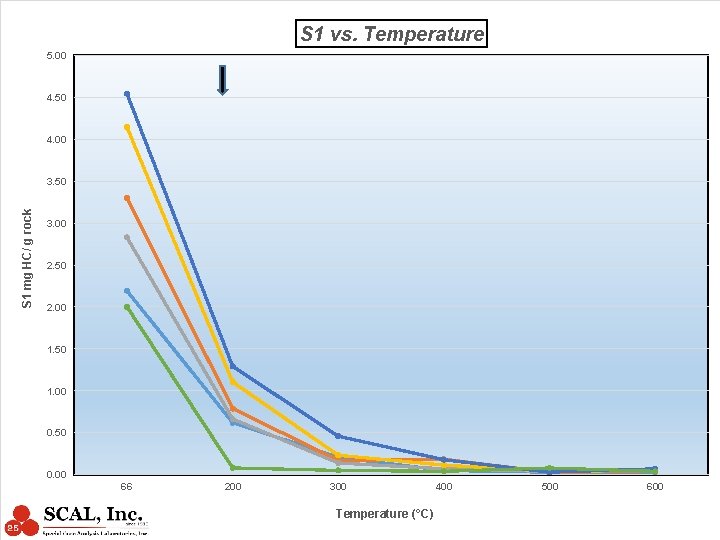
S 1 vs. Temperature 5. 00 4. 50 4. 00 S 1 mg HC/ g rock 3. 50 3. 00 2. 50 2. 00 1. 50 1. 00 0. 50 0. 00 66 200 300 Temperature (°C) 400 500 600
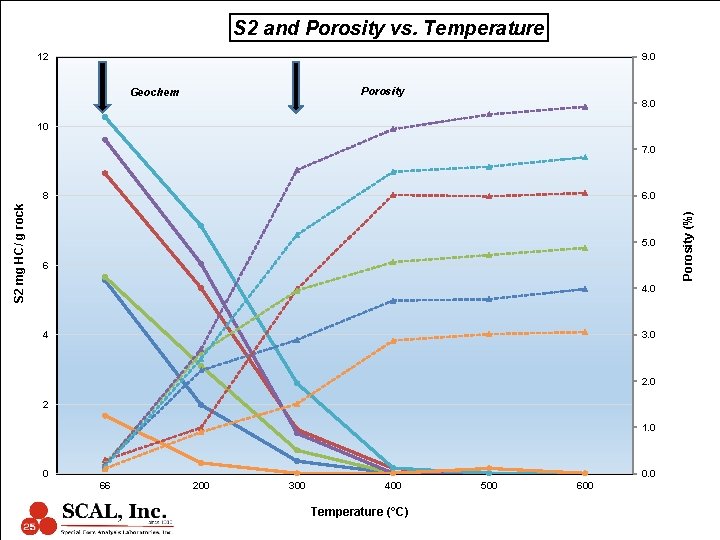
S 2 and Porosity vs. Temperature 12 9. 0 Porosity Geochem 8. 0 10 7. 0 6. 0 5. 0 6 4. 0 4 3. 0 2 1. 0 0 0. 0 66 200 300 400 Temperature (°C) 500 600 Porosity (%) S 2 mg HC/ g rock 8
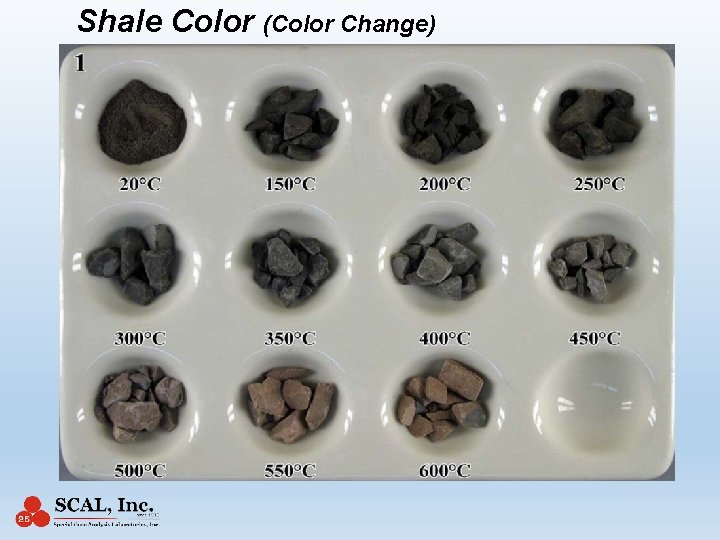
Shale Color (Color Change)
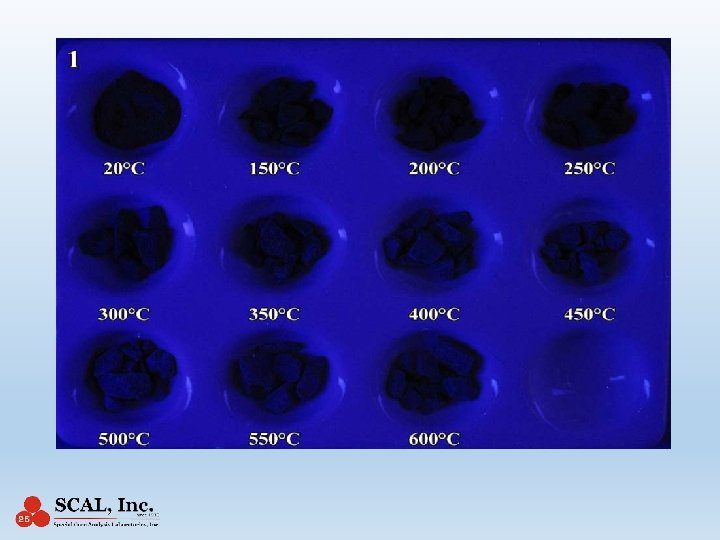
Shale Permeability 1. The laboratory permeability will also be drastically affected by the organic content changes due to laboratory temperature exposure 2. The sample grinding level also affects permeability values 3. Liquid hydrocarbons will not flow in rocks that have pores sizes smaller than the molecular size of the liquid hydrocarbons 4. Diffusion parameters describing the transport capacity of the shale are determined from the slope of the desorption isotherms
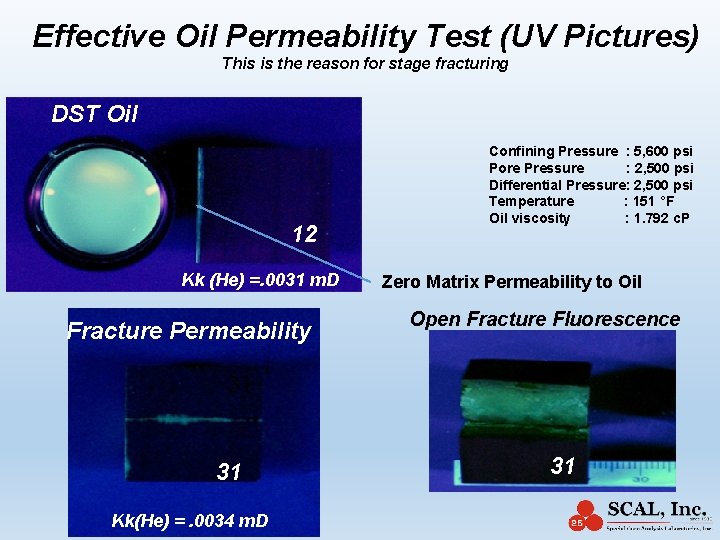
Effective Oil Permeability Test (UV Pictures) This is the reason for stage fracturing DST Oil 12 Kk (He) =. 0031 m. D Fracture Permeability Confining Pressure : 5, 600 psi Pore Pressure : 2, 500 psi Differential Pressure: 2, 500 psi Temperature : 151 °F Oil viscosity : 1. 792 c. P Zero Matrix Permeability to Oil Open Fracture Fluorescence 31 31 Kk(He) =. 0034 m. D 31
Laboratory Hydrocarbon Generation (due to stress removal) Frac Fluid with Catalyst?
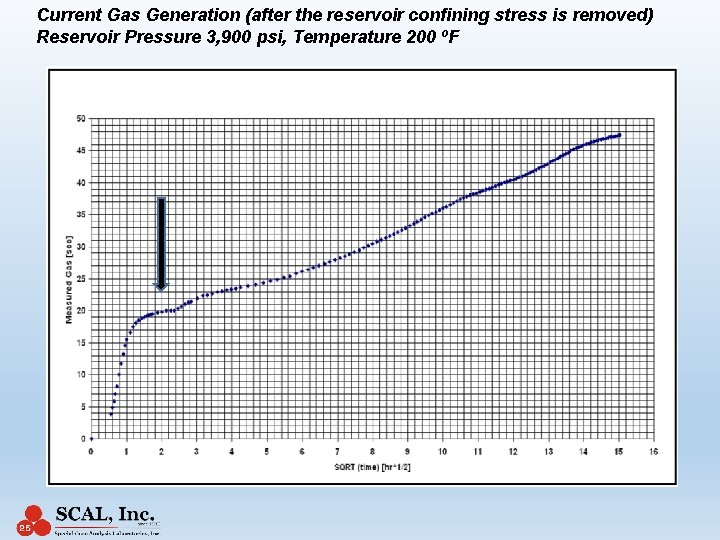
Current Gas Generation (after the reservoir confining stress is removed) Reservoir Pressure 3, 900 psi, Temperature 200 o. F
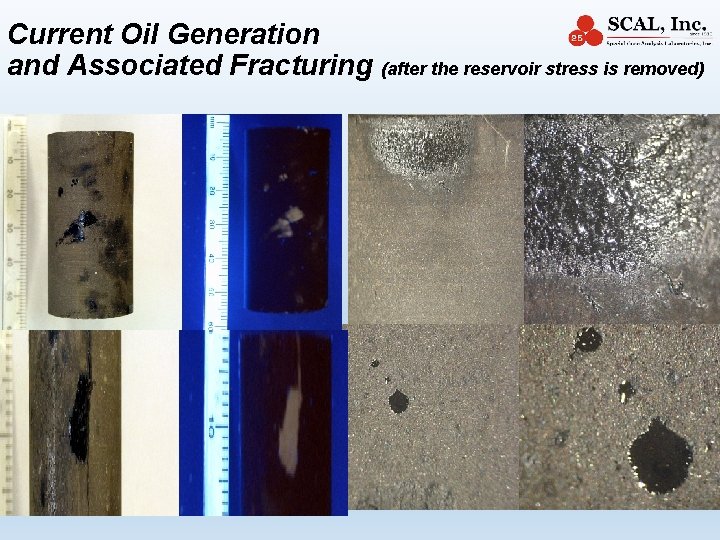
Current Oil Generation and Associated Fracturing (after the reservoir stress is removed)
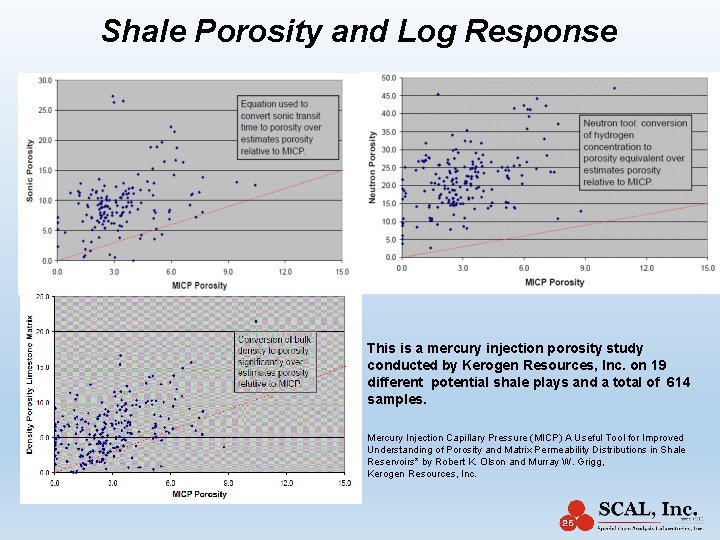
Shale Porosity and Log Response This is a mercury injection porosity study conducted by Kerogen Resources, Inc. on 19 different potential shale plays and a total of 614 samples. Mercury Injection Capillary Pressure (MICP) A Useful Tool for Improved Understanding of Porosity and Matrix Permeability Distributions in Shale Reservoirs* by Robert K. Olson and Murray W. Grigg, Kerogen Resources, Inc.
“The blind is leading the blind” In finding the highly desired large shale porosities In the absence of an API Standard Questionable shale porosity data is used to “calibrate” questionable log data and even worst attempts to calibrate laboratory data using log data
Desorption Isotherms to the Rescue 1. Non fluorescent shale (oil or gas window) will produce ONLY gas 2. Sweet zone identification Fast, independent based on hydrocarbon generation and not subject to contamination 3. Difficult to measure porosity We can accurately and independently measure gas reserves/storage using the CBM approach by measuring the total gas content (scf/ton) instead 4. Difficult to measure permeability The matrix shale gas production is controlled by diffusion and the diffusion parameters are determined from the slope of the Desorption Isotherms. Fresh, fast, uncontaminated, native state, uncrushed measurements
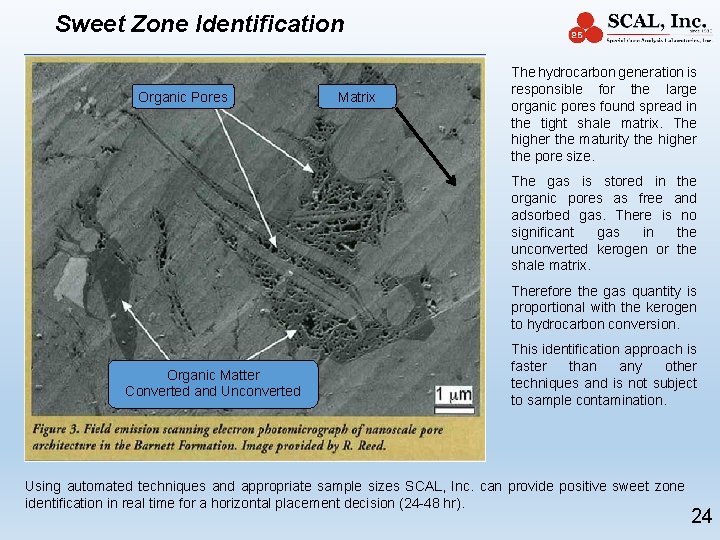
Sweet Zone Identification Organic Pores Matrix The hydrocarbon generation is responsible for the large organic pores found spread in the tight shale matrix. The higher the maturity the higher the pore size. The gas is stored in the organic pores as free and adsorbed gas. There is no significant gas in the unconverted kerogen or the shale matrix. Therefore the gas quantity is proportional with the kerogen to hydrocarbon conversion. Organic Matter Converted and Unconverted This identification approach is faster than any other techniques and is not subject to sample contamination. Using automated techniques and appropriate sample sizes SCAL, Inc. can provide positive sweet zone identification in real time for a horizontal placement decision (24 -48 hr). 24
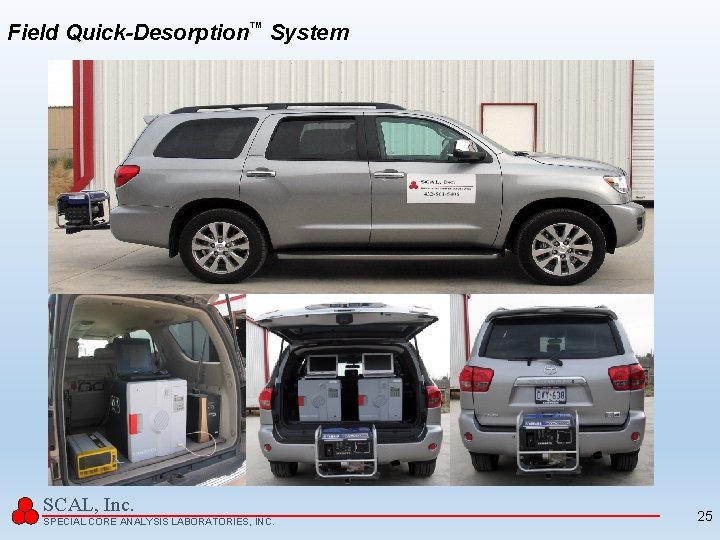
Field Quick-Desorption™ System SCAL, Inc. SPECIAL CORE ANALYSIS LABORATORIES, INC. 25
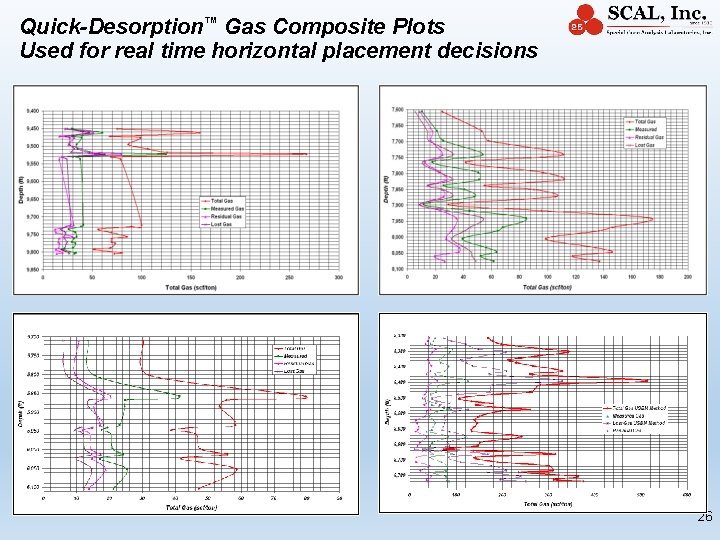
Quick-Desorption™ Gas Composite Plots Used for real time horizontal placement decisions 26
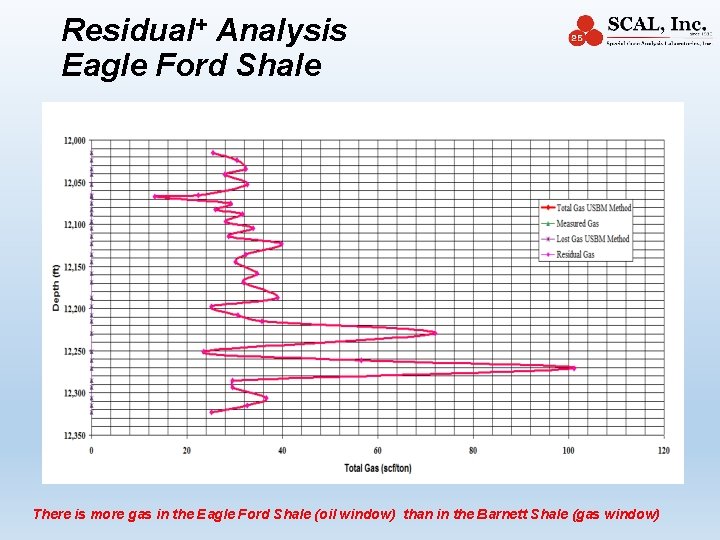
Residual+ Analysis Eagle Ford Shale There is more gas in the Eagle Ford Shale (oil window) than in the Barnett Shale (gas window)
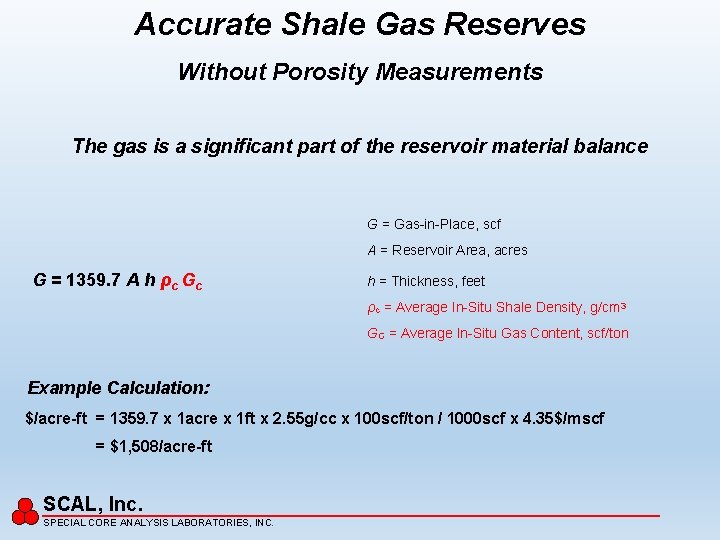
Accurate Shale Gas Reserves Without Porosity Measurements The gas is a significant part of the reservoir material balance G = Gas-in-Place, scf A = Reservoir Area, acres G = 1359. 7 A h ρc Gc h = Thickness, feet ρc = Average In-Situ Shale Density, g/cm 3 GC = Average In-Situ Gas Content, scf/ton Example Calculation: $/acre-ft = 1359. 7 x 1 acre x 1 ft x 2. 55 g/cc x 100 scf/ton / 1000 scf x 4. 35$/mscf = $1, 508/acre-ft SCAL, Inc. SPECIAL CORE ANALYSIS LABORATORIES, INC.
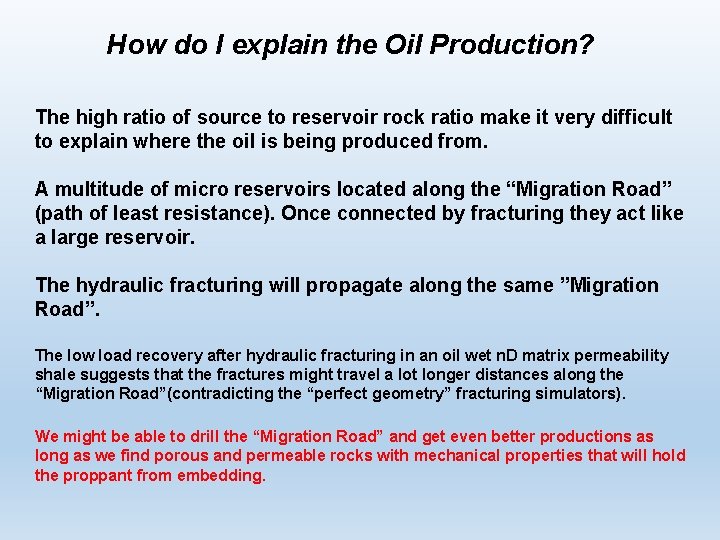
How do I explain the Oil Production? The high ratio of source to reservoir rock ratio make it very difficult to explain where the oil is being produced from. A multitude of micro reservoirs located along the “Migration Road” (path of least resistance). Once connected by fracturing they act like a large reservoir. The hydraulic fracturing will propagate along the same ”Migration Road”. The low load recovery after hydraulic fracturing in an oil wet n. D matrix permeability shale suggests that the fractures might travel a lot longer distances along the “Migration Road”(contradicting the “perfect geometry” fracturing simulators). We might be able to drill the “Migration Road” and get even better productions as long as we find porous and permeable rocks with mechanical properties that will hold the proppant from embedding.
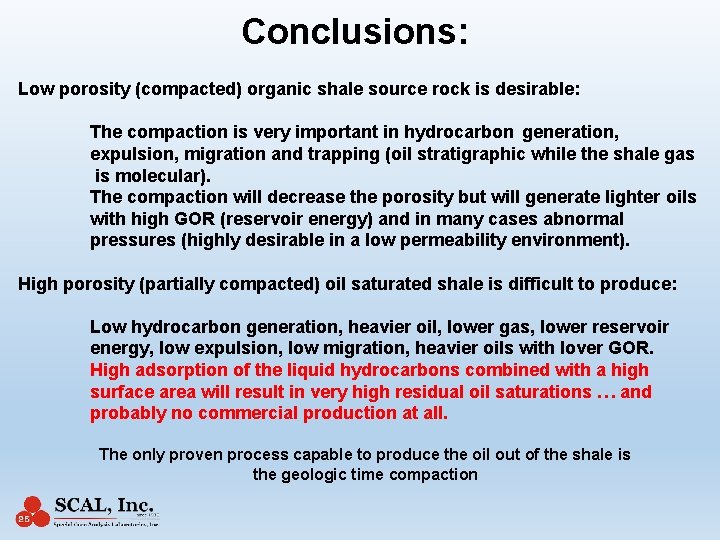
Conclusions: Low porosity (compacted) organic shale source rock is desirable: The compaction is very important in hydrocarbon generation, expulsion, migration and trapping (oil stratigraphic while the shale gas is molecular). The compaction will decrease the porosity but will generate lighter oils with high GOR (reservoir energy) and in many cases abnormal pressures (highly desirable in a low permeability environment). High porosity (partially compacted) oil saturated shale is difficult to produce: Low hydrocarbon generation, heavier oil, lower gas, lower reservoir energy, low expulsion, low migration, heavier oils with lover GOR. High adsorption of the liquid hydrocarbons combined with a high surface area will result in very high residual oil saturations … and probably no commercial production at all. The only proven process capable to produce the oil out of the shale is the geologic time compaction
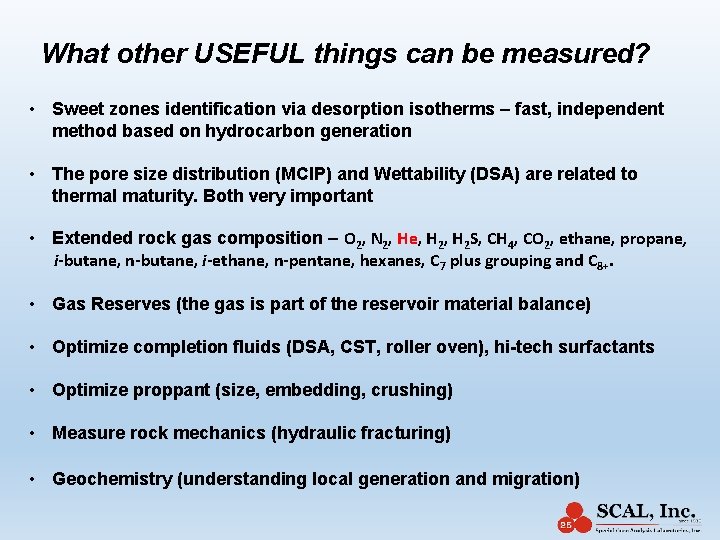
What other USEFUL things can be measured? • Sweet zones identification via desorption isotherms – fast, independent method based on hydrocarbon generation • The pore size distribution (MCIP) and Wettability (DSA) are related to thermal maturity. Both very important • Extended rock gas composition – O 2, N 2, He, H 2 S, CH 4, CO 2, ethane, propane, i-butane, n-butane, i-ethane, n-pentane, hexanes, C 7 plus grouping and C 8+. • Gas Reserves (the gas is part of the reservoir material balance) • Optimize completion fluids (DSA, CST, roller oven), hi-tech surfactants • Optimize proppant (size, embedding, crushing) • Measure rock mechanics (hydraulic fracturing) • Geochemistry (understanding local generation and migration)
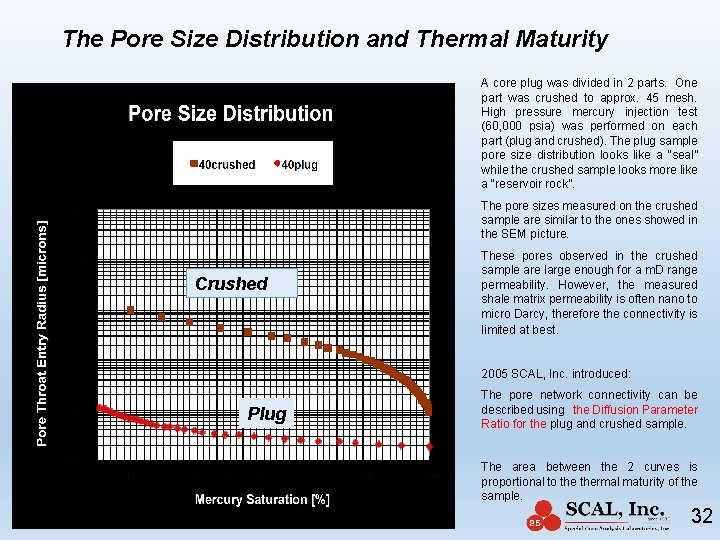
The Pore Size Distribution and Thermal Maturity A core plug was divided in 2 parts. One part was crushed to approx. 45 mesh. High pressure mercury injection test (60, 000 psia) was performed on each part (plug and crushed). The plug sample pore size distribution looks like a “seal” while the crushed sample looks more like a “reservoir rock”. The pore sizes measured on the crushed sample are similar to the ones showed in the SEM picture. Crushed These pores observed in the crushed sample are large enough for a m. D range permeability. However, the measured shale matrix permeability is often nano to micro Darcy, therefore the connectivity is limited at best. 2005 SCAL, Inc. introduced: Plug The pore network connectivity can be described using the Diffusion Parameter Ratio for the plug and crushed sample. The area between the 2 curves is proportional to thermal maturity of the sample. 32
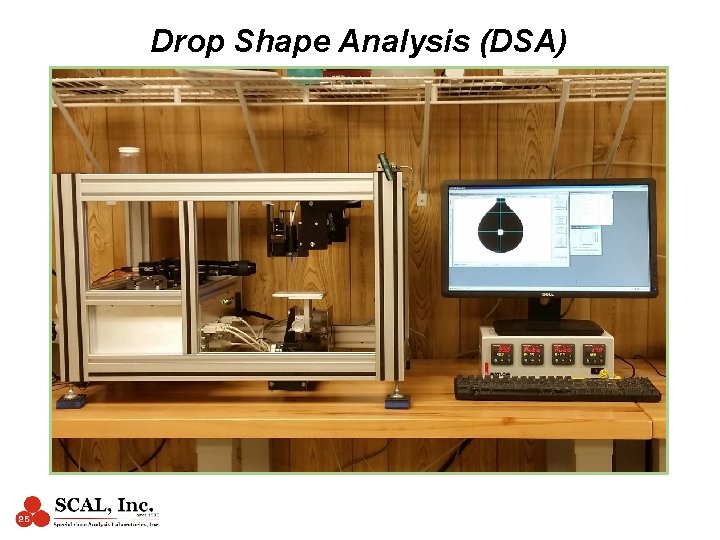
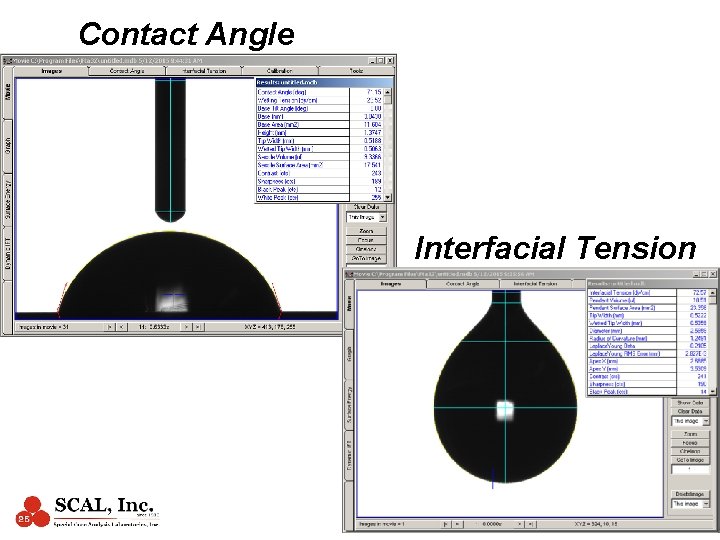
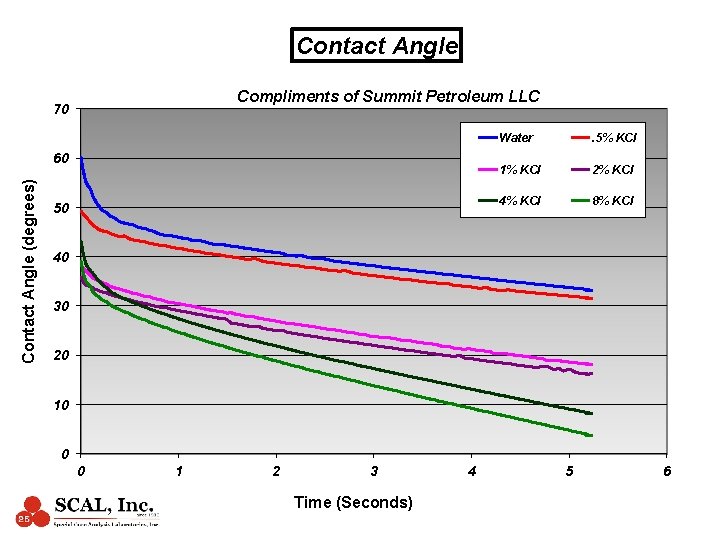
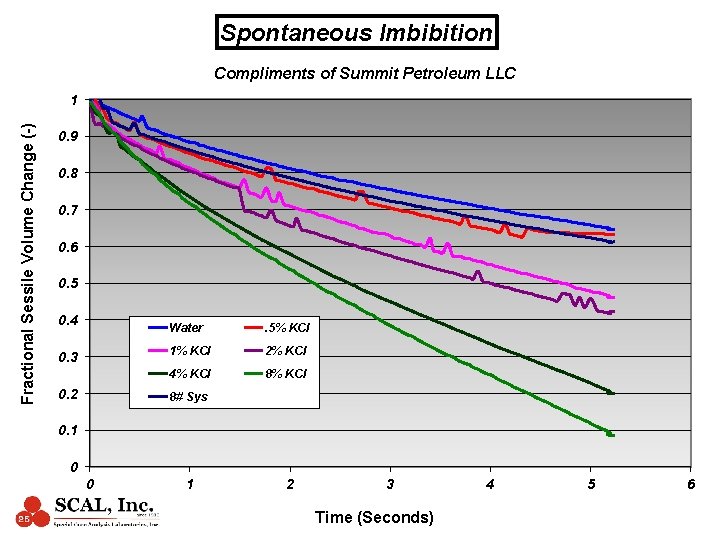
Drop Shape Analysis (DSA)
Contact Angle Interfacial Tension
Dual Drop Wettability Measurement Formation Water Drop Crude Oil Drop
Contact Angle Compliments of Summit Petroleum LLC 70 Contact Angle (degrees) 60 50 Water . 5% KCl 1% KCl 2% KCl 4% KCl 8% KCl 40 30 20 10 0 0 1 2 3 Time (Seconds) 4 5 6
Spontaneous Imbibition Compliments of Summit Petroleum LLC Fractional Sessile Volume Change (-) 1 0. 9 0. 8 0. 7 0. 6 0. 5 0. 4 0. 3 0. 2 Water . 5% KCl 1% KCl 2% KCl 4% KCl 8# Sys 0. 1 0 0 1 2 3 Time (Seconds) 4 5 6
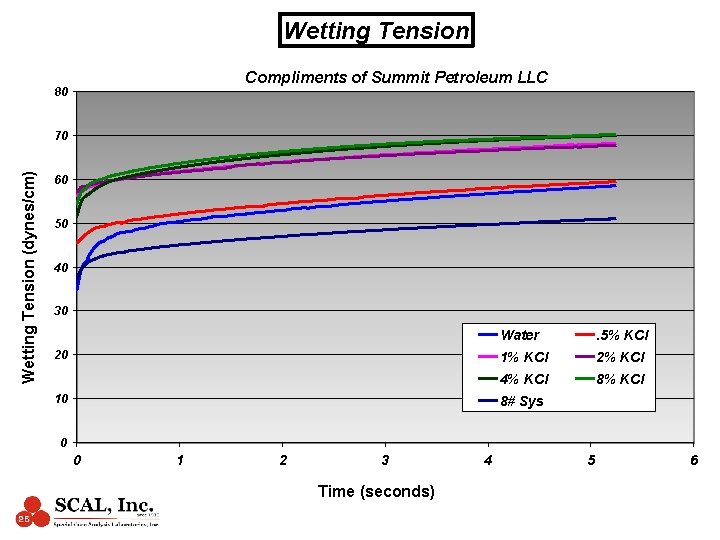
Wetting Tension Compliments of Summit Petroleum LLC 80 Wetting Tension (dynes/cm) 70 60 50 40 30 20 10 Water . 5% KCl 1% KCl 2% KCl 4% KCl 8# Sys 0 0 1 2 3 Time (seconds) 4 5 6
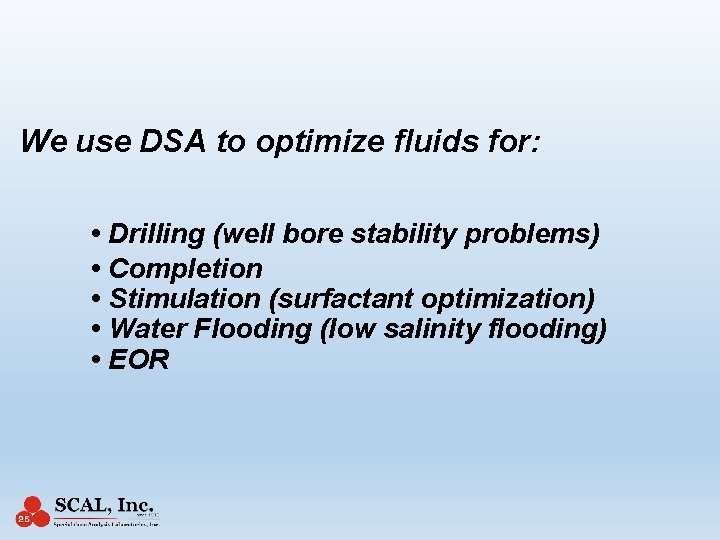
We use DSA to optimize fluids for: • Drilling (well bore stability problems) • Completion • Stimulation (surfactant optimization) • Water Flooding (low salinity flooding) • EOR
Thank you for your time! Black tight shale is actually good for oil production!
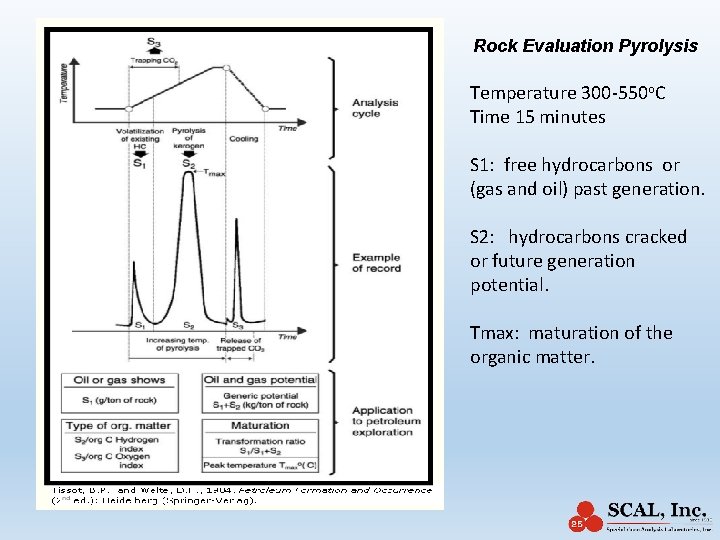
Rock Evaluation Pyrolysis Temperature 300 -550 o. C Time 15 minutes S 1: free hydrocarbons or (gas and oil) past generation. S 2: hydrocarbons cracked or future generation potential. Tmax: maturation of the organic matter.
- Slides: 41