LOS PROBLEMAS De quin procede este material biolgico

LOS PROBLEMAS • ¿De quién procede este material biológico? • ¿Qué grado de parentesco hay entre estos individuos? • ¿Qué aspecto tiene el individuo del que procede este material biológico?

SOLUCIONES • Aún no las hay para el último. Para los otros: • Hay loci polimórficos en el genoma (99. 7% DNA igual entre personas: casi 107 pb diferentes) • Es poco probable que dos individuos tengan el mismo alelo en un locus polimórfico • Es muy improbable que dos individuos tengan los mismos alelos en varios loci polimórficos (no ligados) • La probabilidad es mayor para individuos emparentados

Remove a portion of the mixed stain SDS, EDTA and proteinase K (cell lysis buffer) Incubate at 37 o. C Centrifuge Perpetrator’s sperm mixed with victim’s epithelial cells sperm pellet SDS, EDTA and proteinase K + DTT “Male Fraction” REMOVE supernatant DTT lyses sperm heads sperm pellet “Female Fraction” Figure 3. 2, J. M. Butler (2005) Forensic DNA Typing, 2 nd Edition © 2005 Elsevier Academic Press
 from vaginal epithelial cells (female fraction)")
Differential extraction used to separate sperm (male fraction) from vaginal epithelial cells (female fraction) female Alelos de un locus Evidence (female fraction) Alelos de otro locus male female Evidence (male fraction) Suspect Victim The four samples typically associated with a forensic DNA case…

Forensic Casework DNA Profiles Profiler Plus STR kit results Crime scene evidence (MIXTURE of victim and perpetrator) suspect All of the suspect’s alleles are included in the evidentiary DNA profile
 (A) Polimorfismos de secuencia ----AGACTAGACATT-------AGATTAGGCATT------- (B) Polimorfismos de")
TIPOS DE POLIMORFISMOS (DIFERENCIAS ENTRE ALELOS) (A) Polimorfismos de secuencia ----AGACTAGACATT-------AGATTAGGCATT------- (B) Polimorfismos de tamaño -----(AATG)(AATG)-----3 repeticiones -----(AATG)-----2 repeticiones Figure 2. 5, J. M. Butler (2005) Forensic DNA Typing, 2 nd Edition © 2005 Elsevier Academic Press

¿CÓMO DETECTAR LOS POLIMORFISMOS? • Por digestión con enzimas de restricción e hibridación: RFLPs • Por PCR • …

RFLPs DE POLIMORFISMOS DE SECUENCIA Dianas de un enzima de restricción Hibridación con la sonda

RFLPs DE POLIMORFISMOS DE TAMAÑO Dianas de un enzima de restricción Hibridación con la sonda A , B

Locus A Allele 1 Allele 2 4 Homologous pair of chromosomes 5 Allele 2 Allele 1 Homologous pair of chromosomes 3 6 Locus B Figure 2. 6, J. M. Butler (2005) Forensic DNA Typing, 2 nd Edition © 2005 Elsevier Academic Press

RFLP del polimorfismo en tamaño de UN locus: el sospechoso A no puede ser descartado, el B sí

POLIMORFISMOS DE TAMAÑO EN SECUENCIAS REPETIDAS
 Flanking regions Repeat region GAGGACCACCAGGAAG 16 bp repeat")
Minisatellite Marker (D 1 S 80) Flanking regions Repeat region GAGGACCACCAGGAAG 16 bp repeat unit STR Marker (TH 01) (STR: Short Tandem Repeats, microsatélites) Flanking regions Repeat region TCAT 4 bp repeat unit Figure 5. 1, J. M. Butler (2005) Forensic DNA Typing, 2 nd Edition © 2005 Elsevier Academic Press

VENTAJAS DE LOS STRs • Abundantes a lo largo del genoma (más de 20. 000 de 4 nt se han detectado en el genoma humano y en total pueden ser alrededor del 3%, con un STR cada cerca de 10. 000 nt) • Muy variables (se ha llegado a estimar que más de un millón de alelos en total) • Pueden detectarse por PCR: poco DNA necesario (0. 5 -2 ng vs. alrededor de 25 ng para RFLP) • Su pequeño tamaño hace que se puedan detectar con DNA algo degradado
 Fluorescent dye label AATG 7 repeats 8 repeats the repeat")
Short Tandem Repeats (STRs) Fluorescent dye label AATG 7 repeats 8 repeats the repeat region is variable between samples while the flanking regions where PCR primers bind are constant Homozygote = both alleles are the same length Heterozygote = alleles differ and can be resolved from one another

195 bp 170 bp TCAT repeat unit Different primer sets produce different PCR product sizes for the same STR allele

8 repeats Locus 1 10 repeats 8 repeats Locus 2 9 repeats The polymerase chain reaction (PCR) is used to amplify STR regions and label the amplicons with fluorescent dyes using locus-specific primers

DNA samples are loaded onto a polyacrylamide gel Sample Separation STR alleles separate during electrophoresis through the gel Sample Detection (Post-Electrophoresis) 505 nm scan to detect 585 nm scan to detect fluorescein-labels TMR-labels Figure 13. 10, J. M. Butler (2005) Forensic DNA Typing, 2 nd Edition © 2005 Elsevier Academic Press
 Forensic DNA Typing, 2 nd Edition ©")
Figure 13. 11, J. M. Butler (2005) Forensic DNA Typing, 2 nd Edition © 2005 Elsevier Academic Press
 Capillary or Gel")
Principles of Sample Separation and Detection Labeled DNA fragments (PCR products) Capillary or Gel Lane Sample Detection Size Separation Ar+ LASER CCD Panel (488 nm) Color Separation Detection region Fluorescence ABI Prism spectrograph
 TAMRA (Yellow) JOE (Green) ROX")
Fluorescent Dyes Used in 4 -Color Detection FAM (Blue) TAMRA (Yellow) JOE (Green) ROX (Red)
 5 -FAM JOE")
Fluorescent Emission Spectra for ABI Dyes (Sustituye hoy día al TAMRA) 5 -FAM JOE NED ROX Normalized Fluorescent Intensity 100 80 60 40 20 0 520 540 Laser excitation (488, 514. 5 nm) 560 580 600 620 640 WAVELENGTH (nm) ABI 310 Filter Set F
 Fill with Polymer Solution Argon Ion Laser 50 -100 m x")
Capillary Electrophoresis (CE) Fill with Polymer Solution Argon Ion Laser 50 -100 m x 27 cm - + Burn capillary window DNA Separation occurs in minutes. . . Inlet (cathode) 5 -20 k. V Outlet (anode) Data Acquisition and Analysis

ABI Prism 310 Genetic Analyzer capillary Syringe with polymer solution Injection electrode Outlet buffer Autosampler tray Inlet buffer

Close-up of ABI Prism 310 Sample Loading Area Electrode Capillary Sample Vials Autosampler Tray

Increasing Sample Throughput with Parallel Processing ABI 3100 16 capillary array ABI 310 single capillary

ABI 3100 Array Detection
 Advantages of Multiplex PCR –Increases information obtained per unit")
Multiplex PCR (Parallel Sample Processing) Advantages of Multiplex PCR –Increases information obtained per unit time (increases power of discrimination) –Reduces labor to obtain results –Reduces template required (smaller sample consumed)

An Example Forensic STR Multiplex Kit Amp. Fl. STR® Profiler Plus™ Kit available from PE Biosystems (Foster City, CA) 200 bp Color Separation 100 bp 300 bp Size Separation D 3 A v. WA D 8 D 5 FGA 400 bp No solapan los rangos: no pueden confundirse los loci 5 -FAM (blue) D 21 D 18 JOE (green) D 13 D 7 NED (yellow) ROX (red) Rango de tamaño de alelos de cada locus GS 500 -internal lane standard 9 STRs amplified along with sex-typing marker amelogenin in a single PCR reaction
 16 ANÁLISIS (UNO")
TODOS LOCI EN UN ANÁLISIS Amp. Fl. STR® Identifiler™ (Applied Biosystems) 16 ANÁLISIS (UNO POR LOCUS) D 8 S 1179 D 3 S 1358 TH 01 VWA D 19 S 433 AMEL D 21 S 11 D 5 S 818 D 7 S 820 D 13 S 317 TPOX FGA CSF 1 PO D 16 S 539 D 18 S 51 D 2 S 1338

¿CÓMO IDENTIFICAR LOS DIFERENTES ALELOS DE UN LOCUS?

STR genotyping is performed by comparison of sample data to allelic ladders

Separate PCR products from various samples amplified with primers targeted to a particular STR locus Polyacrylamide Gel Combine Re-amplify Find representative alleles spanning population variation Figure 5. 3, J. M. Butler (2005) Forensic DNA Typing, 2 nd Edition © 2005 Elsevier Academic Press
 (24 alleles) D 3")
D 8 S 1179 D 21 S 11 (12 alleles) (24 alleles) D 3 S 1358 (8 alleles) D 19 S 433 (15 alleles) (10 alleles) (8 alleles) (9 alleles) (8 alleles) (10 alleles) D 16 S 539 (14 alleles) (2 alleles) (10 alleles) D 13 S 317 TPOX D 5 S 818 CSF 1 PO TH 01 VWA AMEL D 7 S 820 139 bp 160 bp 250 bp* Yellow panel D 18 S 51 (23 alleles) Red panel FGA high (19 alleles) 200 bp Green panel (14 alleles) FGA low 150 bp 100 bp D 2 S 1338 Blue panel (9 alleles) 300 bp Orange panel 340 bp 350 bp LIZ-labeled GS 500 DNA sizing standard Figure 5. 6, J. M. Butler (2005) Forensic DNA Typing, 2 nd Edition © 2005 Elsevier Academic Press

Commercial STR Kits Kit Contents: Allelic Ladders for Genotyping PCR Component Mix Primer Mix Positive Control DNA Sample Cost to User: $15 -30 per DNA sample tested Currently 2 Suppliers: Applied Biosystems and Promega Corporation

Core STR Loci for the United States Position of Forensic STR Markers on Human Chromosomes 13 CODIS Core STR Loci TPOX D 3 S 1358 D 8 S 1179 D 5 S 818 FGA CSF 1 PO 1997 TH 01 VWA D 7 S 820 AMEL Sex-typing D 13 S 317 D 16 S 539 D 18 S 51 D 21 S 11 AMEL

Core STR Loci for Europe Position of Forensic STR Markers on Human Chromosomes 13 SGM Plus Loci D 2 S 441 SE 33 (Germany) D 3 S 1358 SE 33 D 2 S 1338 TH 01 D 8 S 1179 VWA 1995 1999 2005 D 10 S 1248 FGA European loci overlap with 8 U. S. loci AMEL D 19 S 433 D 16 S 539 D 18 S 51 D 22 S 1045 D 21 S 11 Sex-typing AMEL

ENSAYO DE LA AMELOGENINA PARA CONOCER EL SEXO AMEL Sex-typing AMEL

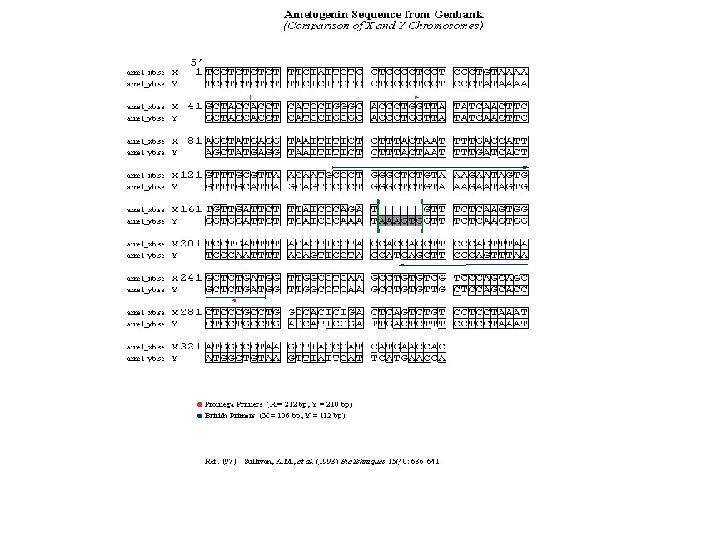
EL LOCUS DE LA AMELOGENINA ES DIFERENTE EN LOS CROMOSOMAS X E Y 6 bp deletion X (en intrón 1) Y X = 106 bp Y = 112 bp Amp. Fl. STR kits and Power. Plex 16 Female: X, X X = 212 bp Y = 218 bp Power. Plex 1. 1 Male: X, Y Figure 5. 11, J. M. Butler (2005) Forensic DNA Typing, 2 nd Edition © 2005 Elsevier Academic Press
 Evidence (male fraction) Suspect Victim")
female X X male female Y Evidence (female fraction) Evidence (male fraction) Suspect Victim
 DNA amount (log scale) 100 ng")
Importance of DNA Quantitation (prior to multiplex PCR) DNA amount (log scale) 100 ng High levels of DNA create interpretation challenges (more artifacts to review) -A Too much DNA § Off-scale peaks § Split peaks (+/-A) § Locus-to-locus imbalance +A 10 ng 2. 0 ng 1 ng Well-balanced STR multiplex STR Kits Work Best in This Range 0. 5 ng 0. 1 ng 0. 01 ng Too little DNA § Heterozygote peak imbalance § Allele drop-out § Locus-to-locus imbalance Stochastic effect when amplifying low levels of DNA produces allele dropout

¿ES MUCHO UN NANOGRAMO DE DNA HUMANO? • Tamaño genoma haploide humano: ~3. 109 pb • Peso molecular par de bases: 618 gr/mol • 1 mol de DNA haploide humano pesa: (~3. 109 pb) x (618 gr/mol/pb) = 1, 85. 1012 gr/mol • 1 mol = 6, 02. 1023 moléculas • Masa de UN genoma haploide humano: (1, 85. 1012 gr/mol) / (6, 02. 1023) = 3, 08. 10 -12 gr = 3, 08 pg • Una célula diploide humana tiene ~6 pg de DNAg • 1 ng de DNAg en ~167 células diploides (1000/6) • En 1 ng de DNAg hay ~167 x 2 = 334 copias de cada locus

¿QUÉ PASA SI EL DNA ESTÁ DEGRADADO?
 Agarose yield gel results Smear of degraded DNA fragments High molecular weight DNA")
(A) Agarose yield gel results Smear of degraded DNA fragments High molecular weight DNA in a tight band (B) Degraded DNA sample D 5 S 818 Good quality Degraded DNA D 13 S 317 D 7 S 820 D 16 S 539 Cuanto mayor es el producto de PCR peor señal con DNA degradado CSF 1 PO Penta D Figure 7. 1, J. M. Butler (2005) Forensic DNA Typing, 2 nd Edition © 2005 Elsevier Academic Press

mini. STRs: new tool for degraded DNA Conventional PCR primer mini. STR primer Smaller PCR products work better with low copy number or fragmented DNA templates STR repeat region mini. STR primer Conventional PCR primer Conventional STR test (COfiler™ kit) Más señal 150 bp smaller Mini. STR assay (using Butler et al. 2003 primers) Figure 7. 2, J. M. Butler (2005) Forensic DNA Typing, 2 nd Edition © 2005 Elsevier Academic Press

Human Identity Testing with Multiplex STRs Two different individuals Amp. Fl. STR® SGM Plus™ kit amelogenin D 19 D 3 DNA Size (base pairs) D 8 TH 01 VWA D 21 D 16 D 18 D 2 FGA probability of a random match: ~1 in 3 trillion amelogenin D 3 D 19 D 8 VWA TH 01 Results obtained in less than 5 hours with a spot of blood the size of a pinhead D 16 D 21 FGA D 18 Simultaneous Analysis of 10 STRs and Gender ID D 2

¿CÓMO SE CALCULA LA PROBABILIDAD DE QUE DOS PERSONAS DISTINTAS TENGAN LOS MISMOS ALELOS EN UN LOCUS?
 Blacks")
STR Allele Frequencies 45 40 TH 01 Marker Frequency 35 30 Caucasians (N=427) Blacks (N=414) Hispanics (N=414) 25 20 15 10 5 *Proc. Int. Sym. Hum. ID 0 (Promega) 1997, p. 34 6 7 8 9 9. 3 Number of repeats 10

La frecuencia de los alelos varía entre poblaciones Es más probable compartir un alelo frecuente que uno raro ** Figure 20. 3, J. M. Butler (2005) Forensic DNA Typing, 2 nd Edition © 2005 Elsevier Academic Press

Trabajo previo: calcular frecuencias de los distintos alelos en la población The 11, 12 genotype was seen 54 times in 302 samples (604 examined chromosomes) Table 20. 2, J. M. Butler (2005) Forensic DNA Typing, 2 nd Edition © 2005 Elsevier Academic Press
 are below the 5/2 N minimum allele")
Allele frequencies denoted with an asterisk (*) are below the 5/2 N minimum allele threshold recommended by the National Research Council report (NRCII) The Evaluation of Forensic DNA Evidence published in 1996. Allele Frequency Tables Butler et al. (2003) JFS 48(4): 908 -911 Einum et al. (2004) JFS 49(6) Caucasian African American N= 302 N= 7, 636 N=258 N= 7, 602 Allele 11 0. 0017* 0. 0009 Allele 11 -- 0. 0003* 12 0. 0017* 0. 0007 12 -- 0. 0045 13 -- 0. 0031 13 0. 0019* 0. 0077 14 Most common 15 allele 15. 2 0. 1027 0. 1240 14 0. 0892 0. 0905 0. 2616 -- 0. 2690 -- 15 0. 3023 0. 2920 15. 2 0. 0019* 0. 0010 16 0. 2533 0. 2430 16 0. 3353 0. 3300 17 0. 2152 0. 2000 17 0. 2054 0. 2070 18 0. 15232 0. 1460 18 0. 0601 0. 0630 19 0. 01160 0. 0125 19 0. 0039* 0. 0048 20 0. 0017* 0. 0001* 20 D 3 S 1358 African American

¿Cuán probable es que alguien más de esta población tenga este conjunto de alelos? Amp. Fl. STR® Identifiler™ (Applied Biosystems) TH 01 D 19 D 3 AMEL D 8 D 5 VWA D 21 TPOX D 13 D 7 CSF D 16 D 18 D 2 FGA What would be entered Locus allele value 1 in Combined into a DNA The Random Match Probability for this profile in the U. S. Caucasian population is 16 0. 2533 17 12 0. 2152 9. 17 P database for D 3 S 1358 1 in 837 trillion (10 ) searching: VWA 17 0. 2815 18 0. 2003 8. 87 81 R 16, 17 O FGA 21 0. 1854 22 0. 2185 12. 35 1005 17, 18 D (2 pq) 21, 22 D 8 S 1179 12 0. 1854 14 0. 1656 16. 29 16, 364 2 x 0. 2533 x 0. 2152 = 0, 109 U 12, 14(2 pq) D 21 S 11 28 0. 1589 30 0. 2782 11. 31 185, 073 C 2 x 0. 2815 x 0. 2003 = 0, 113 28, 30 D 18 S 51 14 0. 1374 16 0. 1391 26. 18 4, 845, 217 T 14, 16 D 5 S 818 12 0. 3841 13 0. 1407 9. 25 44, 818, 259 12, 1311, 14 - D 13 S 317 11 0. 3394 14 0. 0480 30. 69 1. 38 x 109 R 9, 9 D 7 S 820 9 0. 1772 31. 85 4. 38 x 1010 U 9, 11 L D 16 S 539 9 0. 1126 11 0. 3212 13. 8 6. 05 x 1011 2 6, 6 p E THO 1 6 0. 2318 18. 62 1. 13 x 1013 8, 8(0. 1772)2 = 0, 031 10, 10 TPOX 8 0. 5348 3. 50 3. 94 x 1013 CSF 1 PO 10 0. 2169 21. 28 8. 37 x 1014

ESAS PROBABILIDADES SON PARA INDIVIDUOS NO EMPARENTADOS. SI LO ESTÁN LA SITUACIÓN ES DIFERENTE

The Same 13 Locus STR Profile in Different Populations 1 in 837 trillion 1 in 0. 84 quadrillion (1015) in U. S. Caucasian population (NIST) 1 in 2. 46 quadrillion (1015) in U. S. Caucasian population (FBI)* 1 in 1. 86 quadrillion (1015) in Canadian Caucasian population* 1 in 16. 6 quadrillion (1015) in African American population (NIST) 1 in 17. 6 quadrillion (1015) in African American population (FBI)* 1 in 18. 0 quadrillion (1015) in U. S. Hispanic population (NIST) These values are for unrelated individuals assuming no population substructure (using only p 2 and 2 pq) NIST study: Butler, J. M. , et al. (2003) Allele frequencies for 15 autosomal STR loci on U. S. Caucasian, African American, and Hispanic populations. J. Forensic Sci. 48(4): 908 -911. (http: //www. cstl. nist. gov/biotech/strbase/NISTpop. htm) *http: //www. csfs. ca/pplus/profiler. htm
 Parentage (Paternity) Testing Random man Alleged Mother father (known parent) ? Rules of")
(A) Parentage (Paternity) Testing Random man Alleged Mother father (known parent) ? Rules of Inheritance child (B) TEST DE PATERNIDAD: DESCARTAR Reverse Parentage Testing (Missing Persons Investigation) Alleged mother Alleged father ? 1) Child has two alleles for each autosomal marker (one from mother and one from biological father) 2) Child will have mother’s mitochondrial DNA haplotype (barring mutation) 3) Child, if a son, will have father’s Ychromosome haplotype (barring mutation) Missing child Figure 23. 1, J. M. Butler (2005) Forensic DNA Typing, 2 nd Edition © 2005 Elsevier Academic Press

Human Genome 23 Pairs of Chromosomes + mt. DNA Located in cell nucleus http: //www. ncbi. nlm. nih. gov/genome/guide/ Autosomes 2 copies per cell Located in mitochondria (multiple copies in cell cytoplasm) mt. DNA 1 2 3 4 5 6 7 8 9 10 11 12 13 14 15 16 17 18 19 20 21 22 X Y Nuclear DNA 3. 2 billion bp Sexchromosomes 16, 569 bp Mitochondrial DNA 100 s of copies per cell Figure 2. 3, J. M. Butler (2005) Forensic DNA Typing, 2 nd Edition © 2005 Elsevier Academic Press
 Mendelian Inheritance mother father A, B C, D B, C child (B) Example")
(A) Mendelian Inheritance mother father A, B C, D B, C child (B) Example 11, 14 8, 12 Obligate paternal allele 12, 14 8, 14 11, 12 12, 14 8, 11 14 14 11 Figure 23. 2, J. M. Butler (2005) Forensic DNA Typing, 2 nd Edition © 2005 Elsevier Academic Press
 Direct comparison DNA profile from mass disaster victim D")
IDENTIFICACIÓN DE UNA VÍCTIMA (A) Direct comparison DNA profile from mass disaster victim D 5 S 818 D 7 S 820 D 13 S 317 D 16 S 539 CSF 1 PO DNA profile from direct reference (toothbrush believed to have belonged to the victim) Figure 24. 1, J. M. Butler (2005) Forensic DNA Typing, 2 nd Edition © 2005 Elsevier Academic Press Penta D
 Kinship analysis victim D 5 S 818 ? wife")
IDENTIFICACIÓN DE UNA VÍCTIMA (B) Kinship analysis victim D 5 S 818 ? wife D 13 S 317 D 7 S 820 D 16 S 539 CSF 1 PO Penta D 11, 13 8, 12 8, 9 10, 12 8, 10 wife son 11, 13 8, 14 8, 9 9, 13 10, 10 9, 10 son Predicted victim profile 11, ? or ? , 13 ? , 14 9, ? ? , 13 ? , 10 9, ? victim (father) mass disaster victim profile 12, 13 11, 14 9, 9 11, 13 10, 10 9, 12 actual profile Reconstrucción del genotipo del padre a partir de los genotipos de la madre y del hijo para saber si es compatible con el observado en la víctima Figure 24. 1, J. M. Butler (2005) Forensic DNA Typing, 2 nd Edition © 2005 Elsevier Academic Press

Mutation Observed in Family Trio father mother 14, 18 15, 17 son 15, 18 Normal Transmission of Alleles (No Mutation) 14, 18 15, 17 13, 17 Paternal Mutation Butler, J. M. (2001) Forensic DNA Typing, Figure 6. 9, ©Academic Press
 Paternal")
STR Measured Mutation Rates http: //www. cstl. nist. gov/biotech/strbase/mutation. htm Maternal Meioses (%) Paternal Meioses (%) Either Parent Total Mutations Rate CSF 1 PO 70/179, 353 (0. 04) 727/504, 342 (0. 14) 303 1, 100/683, 695 0. 16% FGA 134/238, 378 (0. 06) 1, 481/473, 924 (0. 31) 495 2, 110/712, 302 0. 30% TH 01 23/189, 478 (0. 01) 29/346, 518 (0. 008) 23 75/535, 996 0. 01% TPOX 16/299, 186 (0. 005) 43/328, 067 (0. 01) 24 83/627, 253 0. 01% VWA 133/400, 560 (0. 03) 907/646, 851 (0. 14) 628 1, 668/1, 047, 411 0. 16% D 3 S 1358 37/244, 484 (0. 02) 429/336, 208 (0. 13) 266 732/580, 692 0. 13% D 5 S 818 84/316, 102 (0. 03) 537/468, 366 (0. 11) 303 924/784, 468 0. 12% D 7 S 820 43/334, 886 (0. 01) 550/461, 457 (0. 12) 218 811/796, 343 0. 10% D 8 S 1179 54/237, 235 (0. 02) 396/264, 350 (0. 15) 225 675/501, 585 0. 13% D 13 S 317 142/348, 395 (0. 04) 608/435, 530 (0. 14) 402 1, 152/783, 925 0. 15% D 16 S 539 77/300, 742 (0. 03) 350/317, 146 (0. 11) 256 683/617, 888 0. 11% D 18 S 51 83/130, 206 (0. 06) 623/278, 098 (0. 22) 330 1, 036/408, 304 0. 25% D 21 S 11 284/258, 795 (0. 11) 454/306, 198 (0. 15) 423 1, 161/564, 993 0. 21% Penta D 12/18, 701 (0. 06) 10/15, 088 (0. 07) 21 43/33, 789 0. 13% Penta E 22/39, 121 (0. 06) 58/44, 152 (0. 13) 55 135/83, 273 0. 16% D 2 S 1338 2/25, 271 (0. 008) 61/81, 960 (0. 07) 31 94/107, 231 0. 09% D 19 S 433 22/28, 027 (0. 08) 16/38, 983 (0. 04) 37 75/67, 010 0. 11% F 13 A 01 FES/FPS 1/10, 474 (0. 01) 3/18, 918 (0. 02) 37/65, 347 (0. 06) 79/149, 028 (0. 05) 3 None reported 41/75, 821 82/167, 946 0. 05% F 13 B LPL SE 33 (ACTBP 2) 2/13, 157 (0. 02) 0/8, 821 (<0. 01) 0/330 (<0. 30) 8/27, 183 (0. 03) 9/16, 943 (0. 05) 330/51, 610 (0. 64) 1 4 None reported 11/40, 340 13/25, 764 330/51, 940 0. 03% 0. 05% 0. 64% 13 CODIS core loci STR Locus *Data used with permission from American Association of Blood Banks (AABB) 2002 Annual Report.

LAS MUTACIONES DE STRs Las mutaciones afectan a las pruebas de paternidad pero NO a los estudios forenses del tipo evidenciasospechoso • Las mutaciones ocurren y ello debe tenerse en consideración • Su frecuencia suele ser 1 en ~1000 meiosis • Suelen ocurrir más por el lado paterno que por el materno • No todos loci STR mutan con la misma frecuencia

PARA SABER MÁS 520 pp, unos 50€
- Slides: 64