LORAIN COUNTY REVENUE ANALYSIS Lorain County Revenue Interest


 No data available for 2015 estimate from state")
 Revenue ***From 2007 to 2015 there was")


- Slides: 18
LORAIN COUNTY REVENUE ANALYSIS
Lorain County Revenue
Interest Revenue % rates for investment earnings credited to the General Fund 5. 06% 2. 78% 2. 56% 2. 01% 1. 45% 1. 10% 0. 94% 1. 13% ***From 2007 to 2015 there was a decrease in revenue of $49. 2 million due to a decline in interest rates *** 0. 07%
Conveyance Fees Revenue Due to the decline in the real estate market beginning in 2008, Lorain County saw a decrease of approx. $10. 8 million in revenue from conveyance fees.
Ohio Housing Trust Fund In 2003, the Ohio Legislature doubled the cost of recording fees charged by the Lorain County Recorder and the additional fees were to be sent to the State. By doing this, it created a permanent, dedicated funding source for the Ohio Housing Trust Fund and it was no longer reliant on the State’s general fund.
Since October of 2003, Lorain County has paid approx. $17. 2 M to the State, of which 1% for admin costs (approx $14, 000/year) have been sent back. Since 2009, $3, 737, 780 of the approx. $17. 2 M sent to the State has come back to Lorain County to various organizations via grants to assist with homeless shelters, rehab assistance and transitional housing. * The first $50 million of fees received by the state each year are deposited into the Housing Trust Fund. Anything over that is deposited into the state general revenue fund. (2004 – 2007 $62, 524, 872). *No data available for 2004 to 2008. On average $600, 000 a year has been awarded to Lorain County organizations via grants.
The first $50 million of fees received by the state each year are deposited into the Housing Trust Fund. Anything over that is deposited into the state general revenue fund. For years 2004 thru 2007 funds in excess of $62. 5 million were deposited to the state’s general revenue fund due annual collections being over $50 million. For years 2008 thru 2014 annual collections did not reach the $50 million threshold. Therefore, there were no excess funds deposited to the state’s general revenue fund.
Ohio Housing Trust Fund ***Only the 1 st and 2 nd quarter collections for 2013 have been received***
Casino Revenue In 2009 when voters approved Issue 3, the state estimated that the casinos would generate at least $470 million in annual tax revenue. A full 90% of casino tax revenue is distributed to local governments and school districts and 10% is being shared among state agencies for casino commission.
Since the first casino opened in May 2012, a total of $784, 606, 184 in gross casino revenue has been collected by the state thru June 2015. $78, 460, 612 has gone into the state coffers for: n Casino Control Commission Fund n Ohio State Racing Commission Fund n Law Enforcement Training Fund n Problem Gambling & Addictions Fund $266, 766, 101 has gone into the state’s student fund which has taken the burden off of the state’s general fund.
State Estimates vs Actual Receipts (Casino) No data available for 2015 estimate from state Shortfall of $95, 838 Shortfall of $1, 165, 414 Shortfall of $2, 495, 924
Personal Property & State Reimbursement (CAT Tax) Revenue ***From 2007 to 2015 there was a revenue net loss of $2, 736, 534. ***
Public Utilities Revenue ***From 2007 to 2015 there was a revenue net loss of $688, 438. ***
Local Government Revenue ***From 2007 to 2015 there was a revenue net loss of $8, 249, 829. ***
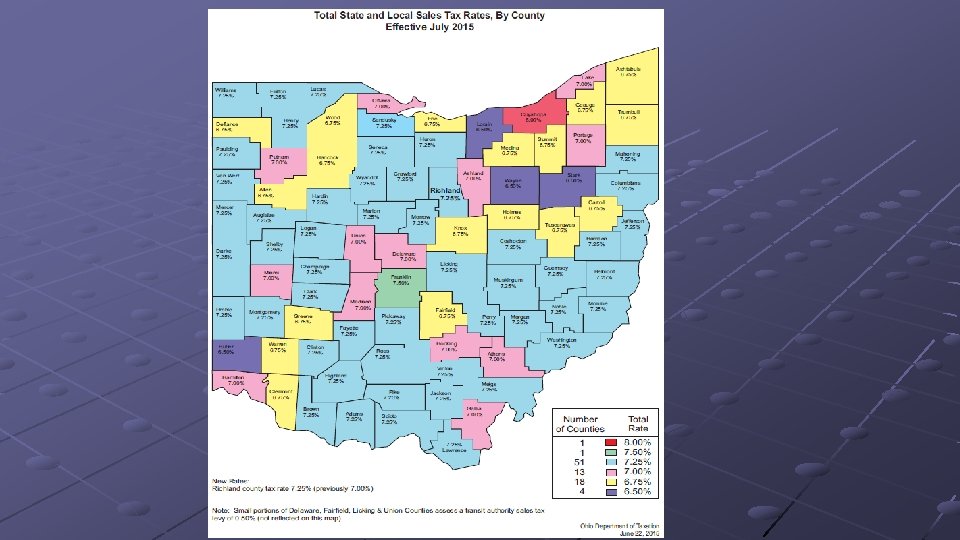
History of State of Ohio Sales Tax 1935 – Enacted and set at 3% 1967 – Increased to 4% 1981 – Increased to 5% 2003 – Increased to 6% 2005 – Decreased to 5. 5% 2013 – Increased to 5. 75%
State Sales Tax Revenue ***$107 M actual revenue through June 2015***
Guaranteed Inside Millage by County **Putnam 1. 3 – Crawford 1. 4 – Cuyahoga 1. 5 – Hancock 1. 5 – Van Wert 1. 5** **Lorain County – 1. 6**