LORAIN COUNTY REVENUE ANALYSIS Lorain County Revenue 64


 In 2003, the Ohio Legislature doubled the cost of")
 Of the $17. 2 million submitted to the State")

 In 2009 when voters approved Issue 3, the state estimated that")
 $78. 4 million has gone into the state coffers for: n")
 operations in Ohio was")
 $600, 000 $511, 445, 832 $500, 000 $400, 000 Ohio Lottery")
 Revenue The Commercial Activity Tax (CAT) was")
 Revenue $900, 000 $800, 000 $700, 000")

 In 2001, the public utility tax was enacted to replace")

 Since 1989, the state has provided local subdivisions with an")
 The county’s share is determined each year based on the")


- Slides: 28
LORAIN COUNTY REVENUE ANALYSIS
Lorain County Revenue $64, 000 $60, 000 $58, 339, 478 $58, 959, 176 $56, 000 $52, 013, 640 $52, 000 $50, 050, 571 $50, 556, 121 $49, 171, 482 $48, 838, 466 $47, 387, 887 $48, 000 $46, 763, 976 Es t 20 15 - 20 14 20 13 20 12 20 11 20 10 20 09 20 08 20 07 $44, 000
Interest Revenue $9, 000 $8, 320, 286 % = rates for investment earnings credited to the General Fund $8, 000 $7, 000 $6, 044, 106 $6, 000 $5, 000 5. 06% $4, 000 $3, 001, 346 $3, 000 2. 78% $2, 000 $2, 213, 785 $1, 596, 210 2. 56% $1, 000 $1, 230, 109 2. 01% 1. 45% 1. 10% $1, 031, 901 $1, 164, 178 $1, 100, 745 0. 94% 1. 13% 0. 07% ***From 2007 to 2015 there was a decrease in revenue of $49. 2 million due to a decline in interest rates *** 201 5 201 4 201 3 201 2 201 1 201 0 200 9 200 8 200 7 $0
Conveyance Fees Revenue $5, 000 $4, 500, 000 $4, 329, 892 $4, 000 $3, 500, 000 $3, 145, 438 $3, 000 $3, 457, 342 $2, 854, 326 $2, 634, 560 $2, 500, 000 $3, 410, 061 $2, 839, 693 $3, 100, 000 $2, 429, 504 $2, 000 $1, 500, 000 $1, 000 $500, 000 Due to the decline in the real estate market beginning in 2008, Lorain County has seen a decrease of approximately $10. 8 million to date in revenue from conveyance fees. 20 15 20 14 20 13 20 12 20 11 20 10 20 09 20 08 20 07 $0
Recording Fees $1, 400, 000 $1, 239, 300 $953, 574 $1, 000 $971, 752 $965, 745 20 11 $1, 052, 311 20 10 $1, 174, 400 $1, 200, 000 $1, 247, 523 $1, 100, 000 $1, 002, 892 $800, 000 $600, 000 $400, 000 $200, 000 Due to the decline in the collection of fees beginning in 2008, Lorain County has seen a decrease of approximately $1. 5 million to date in revenue from recording fees. 20 15 20 14 20 13 20 12 20 09 20 08 20 07 $0
Ohio Housing Trust Fund $17. 2 million in fees submitted on behalf of Lorain County $2, 500, 000 $2, 252, 652 $2, 076, 737 $2, 000 $2, 004, 029 $1, 509, 172 $1, 461, 278 $1, 500, 000 $1, 116, 352 $1, 069, 310 $1, 012, 575 $1, 047, 465 $1, 240, 924 $1, 096, 399 $1, 000 $846, 263 $500, 000 $448, 826 YT D 20 15 20 14 20 13 20 12 20 11 20 10 20 09 20 08 20 07 20 06 20 05 20 04 20 03 $0
Ohio Housing Trust Fund (continued) In 2003, the Ohio Legislature doubled the cost of recording fees charged by the Lorain County Recorder and the additional fees were to be sent to the State. By doing this, it created a permanent, dedicated funding source for the Ohio Housing Trust Fund and it was no longer reliant on the State’s general fund.
Ohio Housing Trust Fund (continued) Of the $17. 2 million submitted to the State from Lorain County, approximately $164, 000 has been sent back and deposited into the general fund for admin costs. An estimated $6. 7 million of the $17. 2 million submitted has come back via grants to assist with homeless shelters, rehab assistance and transitional housing within the county. Over $62. 5 million has been redirected to the state’s general revenue fund.
State Estimates vs Actual Receipts for Casino Revenue No data available for 2015 estimate from state **Actuals fell below state estimates for Lorain County by approximately $3. 8 million**
Casino Revenue (continued) In 2009 when voters approved Issue 3, the state estimated that the casinos would generate at least $643 million in annual casino tax revenue. (This was prior to the authorization of VLTs) Since May 2012, an average of $196 million per year in annual casino tax revenue has been collected by the state thru June 2015. 90% of casino tax revenue is distributed to local governments and school districts and 10% is being shared among state agencies.
Casino Revenue (continued) $78. 4 million has gone into the state coffers for: n Casino Control Commission Fund n Ohio State Racing Commission Fund n Law Enforcement Training Fund n Problem Gambling & Addictions Fund $266 million has gone into the state’s student fund which has taken the burden off of the state’s general fund. The remaining $439 million has been distributed to the 88 counties and casino host cities.
Racetrack/Racino Revenue In 2009 legislation authorizing VLT (video lottery terminals) operations in Ohio was passed. Revenues from these machines are not taxed, like casino revenues are. Gross proceeds from VLTs are split between the horse racetrack operators (66. 5%) and the Ohio Lottery (33. 5%). Profits are then transferred to the State Lottery Education Fund and used to help pay for the state’s share of education. No funds are distributed to local governments. Revenue loss for Lorain County due to racetrack gambling is estimated at $4. 8 million since 2012.
Racetrack/Racino Revenue (continued) $600, 000 $511, 445, 832 $500, 000 $400, 000 Ohio Lottery $289, 533, 337 $300, 000 $200, 000 Racino $261, 510, 426 $148, 043, 023 $110, 073, 961 $100, 000 $0 $55, 450, 791 $3, 710, 352 $7, 365, 327 2012 2013 2014 2015 Thru June
Personal Property & State Reimbursement (CAT Tax) Revenue The Commercial Activity Tax (CAT) was enacted in 2005. Funds collected by the state were used to make payments to school districts and local governments to mitigate the revenue loss from personal property taxes that the state began to phase out in 2005. Lorain County received funds collected for the CAT tax from 2005 thru 2010. Reimbursements from the state began to phase out in 2011. Effective 2013, 50% of CAT tax collections are deposited into the state’s general revenue fund, 35% to schools and 15% to local governments.
Personal Property & State Reimbursement (CAT Tax) Revenue $900, 000 $800, 000 $700, 000 $600, 000 $0 $0 20 15 $365 $0 20 14 20 13 $1, 499 $0 20 12 $1, 452 $164, 732 20 11 ***From 2007 to 2015 there was a revenue net loss of $2, 736, 534. *** $220 $0 CAT $751, 739 $18, 556 20 10 $738, 266 $34, 139 20 09 $551, 821 $204, 853 20 08 $485, 234 $393, 219 20 07 $0 $0 20 05 20 03 $0 20 04 $0 $100, 000 $503, 518 $219, 099 $200, 000 20 06 $804, 077 $300, 000 $800, 610 $400, 000 Personal Property $805, 021 $500, 000
Public Utility Revenue $200, 000 $182, 722 $186, 081 $182, 722 $180, 000 $181, 502 $163, 311 $172, 236 $160, 000 $140, 000 $120, 000 $100, 000 $78, 231 $80, 000 $60, 000 $40, 000 ***From 2007 to 2015 there was a revenue net loss of $688, 438. *** $0 $0 20 15 $0 20 14 20 11 20 10 20 09 20 08 20 07 20 06 20 05 20 04 20 03 $0 20 12 $0 20 13 $20, 000
Public Utility Revenue (continued) In 2001, the public utility tax was enacted to replace losses to local governments and school districts due to the reduction in tangible personal property tax assessment rates. Currently, 88% is paid into the state’s general revenue fund, 9% to schools and 3% to local governments.
Local Government Revenue $10, 000 $9, 466, 753 $9, 410, 862 $9, 159, 934 $9, 104, 419 From 2003 funding levels…. . 2007 – Shift in population $8, 000 2009 – 50% reduction $7, 000 2012 – 28. 6% reduction $5, 654, 680 $5, 566, 649 $6, 000 $4, 775, 956 $5, 000 $4, 839, 832 2013 – 39. 7% reduction $4, 836, 564 $4, 000 $3, 455, 335 $2, 624, 299 $2, 565, 595 $2, 623, 534 $3, 000 $2, 000 $1, 000 20 15 20 14 20 13 20 12 20 11 20 10 9 20 08 20 07 20 06 20 05 20 04 20 03 $0
Local Government Revenue (continued) Since 1989, the state has provided local subdivisions with an additional share of state tax revenues based on each county’s share of the state population. Between 2001 – 2007, local subdivisions began seeing a freeze as revenue was distributed based on the amount they received during the previous year. In 2008, the state restructured the local government funds based on a 3. 68% share of all general revenue tax collections vs the older system of revenue sharing that varied based on the tax.
Local Government Revenue (continued) The county’s share is determined each year based on the county’s population as a share of the total state’s population. Due to changes in local government formulas, Lorain County has lost a total of $48. 9 million in revenue since 2003.
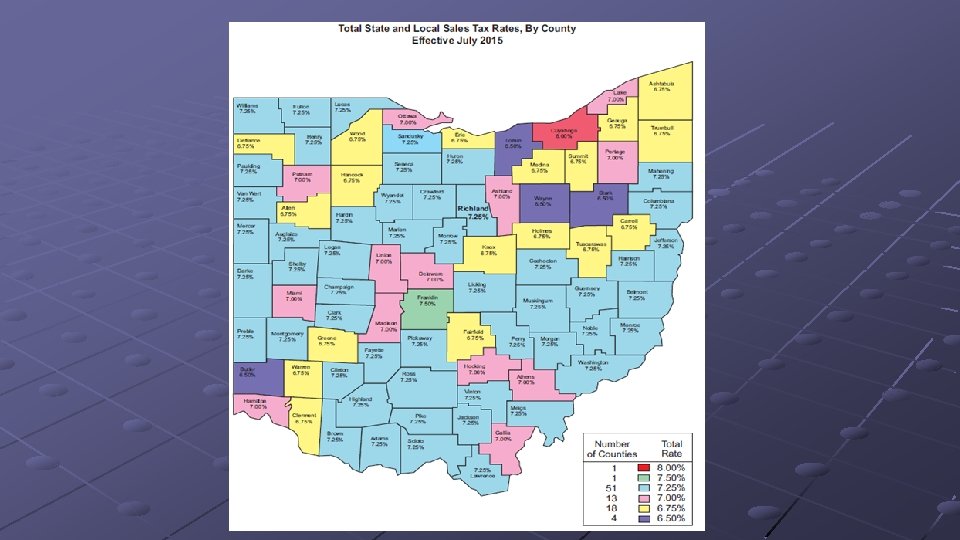
History of State of Ohio Sales Tax 1935 – Enacted and set at 3% [VALUE]% 2003 1967 – Increased to 4% [VALUE]% 1981 [VALUE]% 1967 1981 – Increased to 5% 2003 – Increased to 6% 5. 75% 2013 [VAL UE]% 2005 [VALUE]% 1935 2013 – Increased to 5. 75% 1935 1937 1939 1941 1943 1945 1947 1949 1951 1953 1955 1957 1959 1961 1963 1965 1967 1969 1971 1973 1975 1977 1979 1981 1983 1985 1987 1989 1991 1993 1995 1997 1999 2001 2003 2005 2007 2009 2011 2013 2015 2005 – Decreased to 5. 5% Sales Tax Rate
2015 est 00 0, 0 , 00 14 $2 30 5, 2 , 95 08 $2 52 0, 2 , 07 92 $1 4, 4 90 , 38 80 $1 48 4, 9 , 51 71 $1 7, 2 86 , 87 62 $1 9, 0 90 , 63 53 $1 81 1, 4 , 30 72 $1 18 8, 0 , 73 70 $1 9, 5 18 , 39 67 $1 17 1, 4 , 76 69 $1 28 9, 7 $250, 000 2014 2013 2012 2011 2010 2009 2008 2007 2006 2005 2004 8, 8 84 $1 74 , 94 , 35 $200, 000 2003 49 $1 State Sales Tax Revenue $150, 000 $100, 000 $50, 000 $0
Lorain County Sales Tax Scenarios 2005 – Sales Tax Revenue • If increased by. 25% sales tax receipts would have been $22. 1 million at 0. 5% was $14. 7 million • If increased by. 50% sales tax receipts would have been $29. 4 million 2013 – Sales Tax Revenue • If increased by. 25% sales tax receipts would have been $25. 6 million at 0. 5% was $17. 1 million • If increased by. 50% sales tax receipts would have been $34. 2 million
Current/Guaranteed Inside Millage by County 11 -1. 6 Hancock - 1. 5 / Lorain – 1. 6 2 1 -2. 10 24 1 -2. 60 40 Inside Millage 1 -3. 10 12 1 -3. 60 6 1 -4. 10 3 1 -4. 60 1 0 5 10 15 20 Counties 25 30 35 40
Lorain County Transit Funding $4, 500, 000 $1, 200, 000 $4, 000 $1, 000 $3, 500, 000 $3, 000 $500, 000 $1, 040, 000 $2, 500, 000 $274, 532 $225, 506 $283, 705 $2, 000 $1, 500, 000 County State Federal $500, 000 $325, 334 $243, 492 $337, 018 $2, 554, 305 $2, 604, 258 $1, 000 $2, 274, 590 $261, 429 $50, 000 $183, 335 $50, 000 $131, 362 $50, 000 $109, 500 $50, 000 $102, 778 $954, 203 $778, 364 $895, 684 $961, 682 $914, 355 $885, 250 2011 2012 2013 2014 2015 $283, 977 $1, 715, 341 $1, 523, 263 $100, 000 $500, 000 $1, 368, 739 $100, 000 $0 2004 2005 2006 2007 2008 2009 ***$4, 548, 795 in federal funds returned due to lack of local funding***
In Conclusion…. As of July 2015, the State of Ohio has a balance of $2. 8 billion in it’s rainy day fund. Lorain County, like most other jurisdictions in the state, has $0 funds set aside. Lorain County has lost an estimated $113. 7 million in revenue since 2003 due to the declining collection of fees and cuts at the State level.
LORAIN COUNTY REVENUE ANALYSIS