Looking Beneath the Surface What we can learn

Looking Beneath the Surface What we can learn from the Minnesota TIMSS Science Results William H. Schmidt Michigan State University

2007 Grade 4 Mathematics © 2008 Center for Research in Mathematics and Science Education, Michigan State University

2007 Grade 8 Mathematics © 2008 Center for Research in Mathematics and Science Education, Michigan State University

Grade 8 Mathematics Mean Teaching Emphasis 2007 TIMSS 1995 TEST EMPHASIS © 2008 Center for Research in Mathematics and Science Education, 2007 Michigan State University

2007 Grade 4 Science © 2008 Center for Research in Mathematics and Science Education, Michigan State University

Grade 4 Science: 1995 & 2007

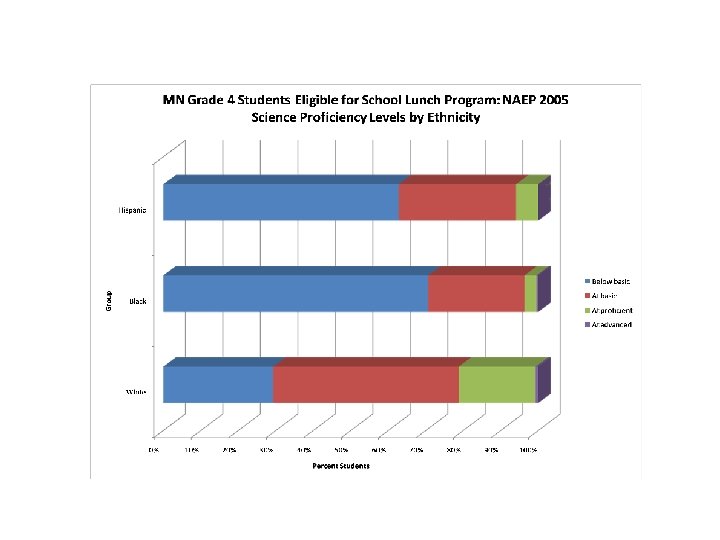
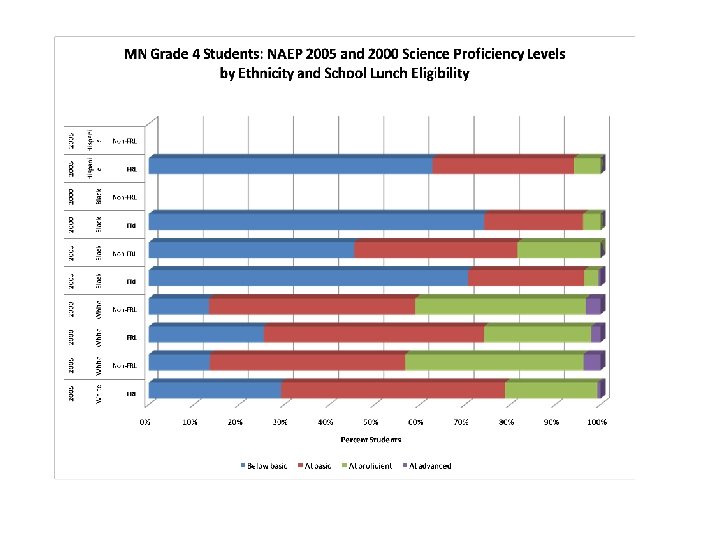
2005 NAEP Grade 4 Science

2007 Grade 8 Science © 2008 Center for Research in Mathematics and Science Education, Michigan State University

Grade 8 Science: 1995 & 2007

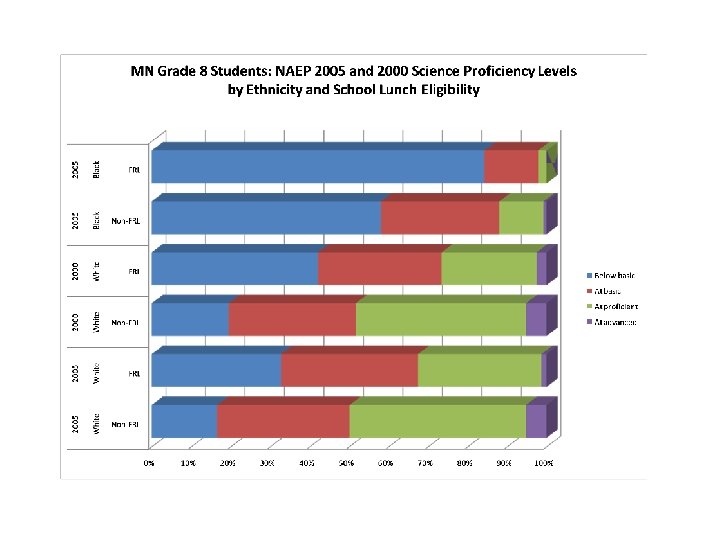
2005 NAEP Grade 8 Science

Grade 4 Science 1

Grade 4 Science 2

Comparing MN and the US: Grade 4 Science

MN Grade 4 Student Science Performance > 75% Correct 1995 Earth Processes Earth in the Universe Plants & Animals 2007 Scientific Processes Between 50 to 74% Correct 10 of 14 Topics 14 of 14 Topics < 50% Correct The 1995 Scores have been adjusted to account for the differences in difficulty of the 1995 & 2007 tests.

Grade 8 Science 1

Grade 8 Science 2

Grade 8 Science 3

Comparing MN and the US: Grade 8 Science

MN Grade 8 Student Science Performance 1995 2007 > 75% Correct Between 50 to 74% Correct 11 of 17 Topics 8 of 17 Topics Properties & Classification of Matter < 50% Correct Physical Changes Chemical Changes Forces and Motion Science, Technology, & Society Scientific Processes Life Cycles & Genetics Structure of Matter Energy and Physical Processes The 1995 Scores have been adjusted to account for the differences in difficulty of the 1995 & 2007 tests.

Grade 4 Earth Features: Average Percent Correct by SES

Grade 4 Life Cycles and Genetics: Average Percent Correct by SES

Grade 4 Physical and Chemical Changes: Average Percent Correct by SES

Grade 4 Environmental and Resource Issues: Average Percent Correct by SES

Grade 8 Earth in the Universe: Average Percent Correct by SES

Grade 8 Human Biology and Health: Average Percent Correct by SES

Grade 8 Science, Technology and Society: Average Percent Correct by SES

Grade 8 Earth in the Universe: Average Percent Correct by SES
")
Instructional Content Constructs v. Curricular Coherence Curricular Structure v. Curricular Focus Exposure Time (OTL) v. Curricular Rigor Level of Cognitive Complexity

2003 MN Science Curriculum

Grade 4 Science Mean Teaching Emphasis 2007 TIMSS TEST 1995 EMPHASIS 2007

Grade 4 Teachers’ Reported Percent Teaching Time on Science Topics by School SES 75 percent or more FRL 25 50 to 74. 9 percent FRL Percent Students Eligible for FRL 37 40 41 22 25 to 49. 9 percent FRL 34 28 10 to 24. 9 percent FRL 34 31 Less than 10 percent FRL 0 26 13 33 5 31 37 33 20 40 60 Percent Teaching Time Life Science 0 Physical Science 6 27 3 80 100 Earth Science © 2008 Center for Research in Mathematics and Science Education, 120 Other Topics Michigan State University

Grade 4 Teachers’ Reported Percent Teaching Time on Science Topics by School SES © 2008 Center for Research in Mathematics and Science Education, Michigan State University

Mean Percent of Grade 4 Science Teaching Time Topic Highest SES Lowest SES Difference Life Science 37 25 4+ Weeks Earth Science 27 41 5 Weeks

Grade 4 MN Teachers’ Yearly Total Science Instructional Time by SES © 2008 Center for Research in Mathematics and Science Education, Michigan State University

MN Students Overall Percent Correct on TIMSS 2007 Science Fourth Grade Test by Percentage of FRL Students in School © 2008 Center for Research in Mathematics and Science Education, Michigan State University

Grade 8 Science Mean Teaching Emphasis 1995 EMPHASIS 2007 TIMSS TEST 2007

Grade 8 Teachers’ Reported Percent Teaching Time on Science Topics by School SES 75 percent or more FRL 39 50 to 74. 9 percent Percent Students Eligible FRL for FRL 4 25 to 49. 9 percent FRL 11 8 10 to 24. 9 percent FRL 6 Less than 10 percent FRL 7 0 53 8 9 7 4 3 75 12 3 66 9 9 2 6 78 15 20 46 13 40 60 Percent Teaching Time Biology 2 Chemistry Physics 80 Earth Science © 2008 Center for Research in Mathematics and Science Education, 100 120 Other Topics Michigan State University

Grade 8 Teachers’ Reported Percent Teaching Time on Science Topics by School SES © 2008 Center for Research in Mathematics and Science Education, Michigan State University

Mean Percent of Grade 8 Science Teaching Time Topic Highest SES Lowest SES Difference Biology 7 39 11+ Weeks Earth Science 46 53 2+ Weeks Physics 15 3 2+ Weeks Other Topics 13 2 4 Weeks

Grade 8 MN Teachers’ Yearly Total Science Instructional Time by SES © 2008 Center for Research in Mathematics and Science Education, Michigan State University

MN Students Overall Percent Correct on TIMSS 2007 Science Eighth Grade Test by Percentage of FRL Students in School © 2008 Center for Research in Mathematics and Science Education, Michigan State University
- Slides: 45