Looking Back Looking Forward Title III at Mid

Looking Back, Looking Forward: Title III at Mid Michigan Community College

Title III Basics • $2 million, 5 year federal grant that aimed to improve student retention, graduation, and transfer rates. • Began in 2011, Ends September 30, 2015 • MMCC has progressively taken over the funding of all grant initiatives • MMCC “matched” grant funding by providing over approx. $650, 000 to support grant initiatives throughout the five years of the grant • Grant has given more than $100, 000 to the MMCC Endowment; the MMCC Foundation has matched that amount (and more).

The Landscape Before Title III MMCC Fall Enrollment By Year 6000 5217 5000 4463 3502 4000 3000 2460 2000 1000 0 2001 2002 2003 2004 2005 2006 2007 2008 2009 2010 2011 2012 2013 2014

The Landscape Before Title III MMCC Fall Enrollment By Year Title III Grant Awarded 6000 5217 5000 4463 3502 4000 3000 2460 2000 1000 0 2001 2002 2003 2004 2005 2006 2007 2008 2009 2010 2011 2012 2013 2014

Pre-Grant Challenges: -Fragmented, underutilized student services and academic support programs -Multi-campus communication issues -Services and programs are fragmented and underutilized by students; disconnected from each other and the college community -Errors are routinely made in scheduling students as there is no annual schedule of classes. -No protocol designed to assist students in identifying goals -No structured time with advisors -Ineffective orientation programs (short sessions at the beginning of each semester) -Virtually no self-directed goal assessment and/or individualized learning plans. Data Sources: 2010 Advising Presentation to Board of Trustees; Annual Instructional Report 2009; 2009 AQIP Portfolio Feedback Report; Five Year Master Plan 2009; Student Satisfaction Survey (2008); ACS Report 2009; IT Technology Committee Report 2009 Advisor to Student Ratio 2011 (Before Title III) Present 1: 1, 400 1: 428

SMART Advising App Feeds information from Colleague and SARS into an easy to use interface ○ ○ ○ ○ Math & reading scores Program of Study Contact information Transcript (completion ratio & GPA) Financial Aid Status Previous Institutions Attended Course Schedule Advising Notes

Pre-Grant Challenge: -Services are disconnected from each other and the college community -Errors are routinely made in scheduling students. Data Sources: 2009 -2010 Accuplacer Results; 2009 -2010; Admissions Applications data; 2009 -2010 MMCC Human Resource Statistics; Strategic Council Presentation 2009 -2010; Enrollment Management Reports (2008 -2010) Faculty Mentor Program • 44 Faculty Mentors from 29 Disciplines • 13 Faculty Mentors Participated More Than Once Accounting Art and Graphic Design Astronomy Automotive Technology Biology Business Information Systems Chemistry Computer Aided Drafting Computer Information Systems Education English History Language Law Enforcement and Corrections Math Medical Assistant Nursing Pharmacy Tech Physical Therapist Assistant Physics Plastics Technology Psychology Radiography Social Science Sociology Web Design Welding

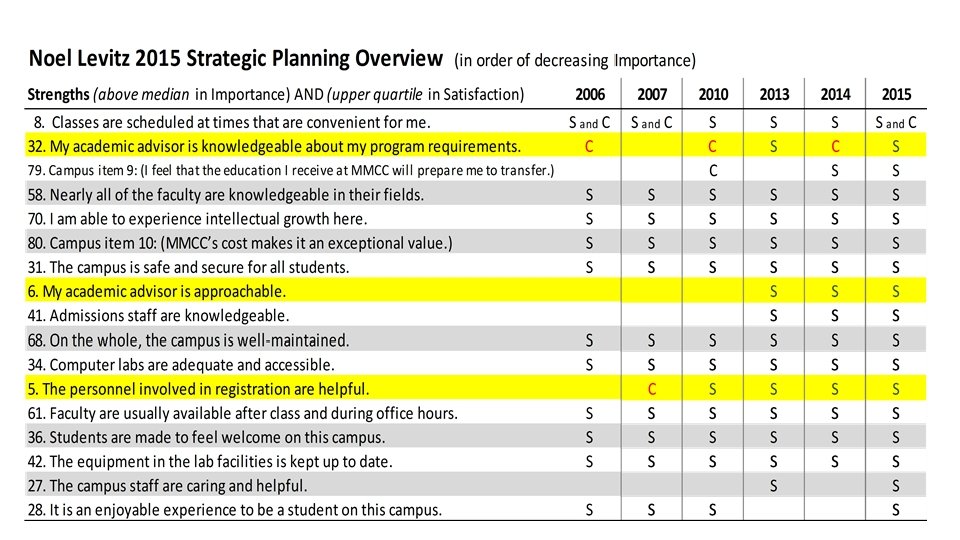
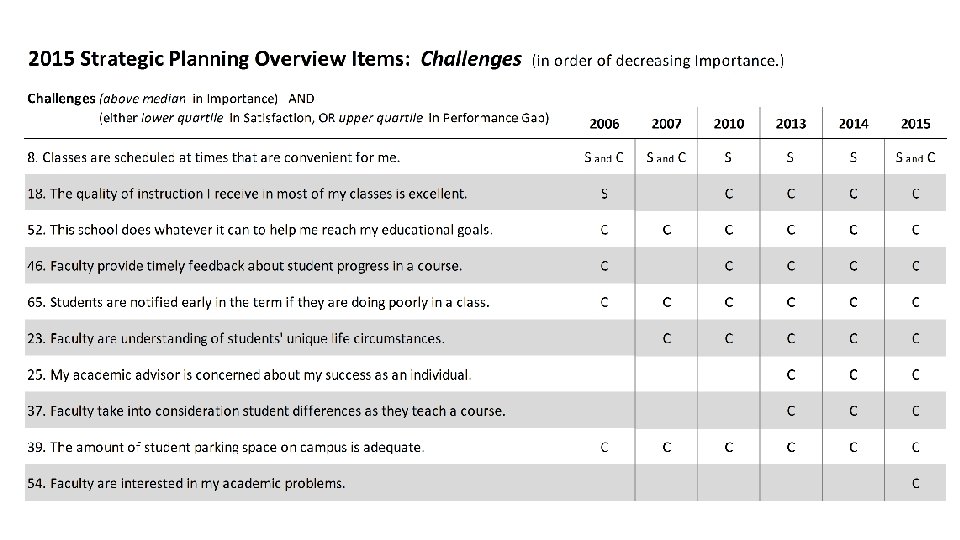
Then and Now: Noel Levitz Student Satisfaction Data: Advising This school does whatever it can to help me reach my educational goals. Counselling staff care about students as individuals. My academic advisor is knowledgeable about the transfer requirements of other schools. My academic advisor is knowledgeable about my program requirements. My academic advisor is concerned about my success as an individual My academic advisor helps me set goals to work toward. My academic advisor is approachable. 4. 2 4. 4 4. 6 4. 8 2006 ** Measured on a 7 point Scale: 5 5. 2 5. 4 2015 1= not very satisfied, 4= neutral, 5= somewhat satisfied, 6=satisfied, 7= very satisfied 5. 6 5. 8 6

Pre-Grant Challenge: Students not empowered to manage their academic experience Data Sources: 2009 -2010 Accuplacer Results; 2009 -2010; Admissions Applications data; 2009 -2010 MMCC Human Resource Statistics; Strategic Council Presentation 2009 -2010; Enrollment Management Reports (2008 -2010) Number of Students Participating in Navigation Classes or Workshops 140 123 120 100 • • • 80 60 40 20 6 11 15 27 18 15 0 Winter Fall 2013 Winter Fall 2014 Winter 2013 2014 2015 Spring 2015 The Navigation Classes and Workshops Cover: Fall 2015 Time Management Study Skills Goal Setting Financial Aid Support Services

Pre-Grant Challenge: Students not empowered to manage their academic experience Data Sources: 2009 -2010 Accuplacer Results; 2009 -2010; Admissions Applications data; 2009 -2010 MMCC Human Resource Statistics; Strategic Council Presentation 2009 -2010; Enrollment Management Reports (2008 -2010) “Orientation” at Community Party, Workshops, Huron ISD Number of Students Participating in Navigation Classes or Workshops 140 120 100 Navigation Class Pilot Navigation Workshops Begin 80 Navigation Classes for Huron ISD classes begin 123 60 40 20 6 11 15 27 18 15 0 Winter Fall 2013 Winter Fall 2014 Winter 2013 2014 2015 Spring 2015 Fall 2015 The Navigation Classes and Workshops Cover: • • • Time Management Study Skills Goal Setting Financial Aid Support Services

Pre-Grant Challenge: Unacceptable numbers of undeclared students Data Sources: 2009 -2010 Accuplacer Results; 2009 -2010; Admissions Applications data; 2009 -2010 MMCC Human Resource Statistics; Strategic Council Presentation 2009 -2010; Enrollment Management Reports (2008 -2010) 1, 200 1, 100 2012 - present Title III Career Efforts Begin Career Workshops 20 1, 000 800 Student Appointments 1545 600 Career Expos 4 400 Classroom Visits 54 129 200 0 2012 68 75 2013 2014 22 2015 Number Using Focus 2: 961

Pre-Grant Challenges: -Low retention rates fall to fall -Low graduation/program completion rates Data Sources: 2009 -2010 Accuplacer Results; 2009 -2010; Admissions Applications data; 2009 -2010 MMCC Human Resource Statistics; Strategic Council Presentation 2009 -2010; Enrollment Management Reports (2008 -2010)

Pre-Grant Challenge: Services and programs are fragmented and underutilized by students; disconnected from each other and the college community Data Sources: 2009 -2010 Accuplacer Results; 2009 -2010; Admissions Applications data; 2009 -2010 MMCC Human Resource Statistics; Strategic Council Presentation 2009 -2010; Enrollment Management Reports (2008 -2010)
: “The Retention Management System is an")
Faculty and Students On Retention Management System (RMS): “The Retention Management System is an integral part of our institution… The RMS team works effectively, positively, and – most importantly I think – with care and understanding to build a bridge to these students…Thank you for both creating and staffing a team that is truly engaged and cares about the continued success of our students. ” -English faculty member comment “I do appreciate the advice and concern. It means a lot as a student to know that teachers and other employees of the school are willing to put in time and effort to make sure students succeed. ” – Student comment

Pre-Grant Challenge: -Services and programs are fragmented and underutilized by students; disconnected from each other and the college community 2010 Advising Presentation to Board of Trustees; Annual Instructional Report 2009; 2009 AQIP Portfolio Feedback Report; Five Year Master Plan 2009; Student Satisfaction Survey (2008); ACS Report 2009; IT Technology Committee Report 2009 Average GPA of MMCC Students 2011 (fall) 2011 (winter) 2012 (fall) 2012 (winter) 2014 (winter) 2. 26 2. 34 2. 29 2. 42 Average GPA of students who Received Tutoring Services 2011 (fall) 2012 (winter) 2013 (winter) 2014 (winter) 2. 65 2. 35 2. 75 2. 81 2. 95

Then and Now: Noel Levitz Student Satisfaction: LLS Academic Support Services adequately meet the needs of students Tutoring Services are readily available Library Staff are helpful and approachable Library Services are adequate 4. 77 4. 87 4. 97 5. 07 5. 17 5. 27 5. 37 5. 47 5. 57 5. 67 2006 ** Measured on a 7 point Scale: 2015 1= not very satisfied, 4=neutral, 5= somewhat satisfied, 6=satisfied, 7= very satisfied

But Back to the Big Picture…

Retention, Graduation, and Transfer IPEDS Rates 2009 -2013 Retention Graduation Transfer 2009 46 15 25 2010 50 9 26 2011 50 9 45 2012 52 9 48 2013 54 9 51 • 2014 Data will be available in the fall 2015. • GOALS SET IN THE TITLE III GRANT: Graduation 18%; Transfer 45%; Retention 56%

Retention, Graduation, and Transfer IPEDS Rates 2009 -2013 Retention Graduation Transfer 2009 46 15 25 2010 50 9 26 2011 50 9 45 2012 52 9 48 2013 54 9 51 • 2014 Data will be available in the fall 2015. • GOALS SET IN THE TITLE III GRANT: Graduation 18%; Transfer 45%; Retention 56%;

Retention, Graduation, and Transfer IPEDS Rates 2009 -2013 Retention Graduation Transfer 2009 46 15 25 2010 50 9 26 2011 50 9 45 2012 52 9 48 2013 54 9 51 • 2014 Data will be available in the fall 2015. • GOALS SET IN THE TITLE III GRANT: Retention 56%; Graduation 18%; Transfer 45%

Reflection and Discussion “When you climb a mountain, it is as much the mountain that lifts you as your legs. ” -Shoji Hamada
- Slides: 23