
Longevity The dark side Sam Gutterman FSA FCAS
- Slides: 10
Longevity The dark side Sam Gutterman, FSA, FCAS, MAAA, Hon. FIA Longevity 12 – Chicago, September 29 -30, 2016
Longevity – the dark side • Recent U. S. experience • Factors to consider, focusing on the effects of human behavior and differences between population segments 2
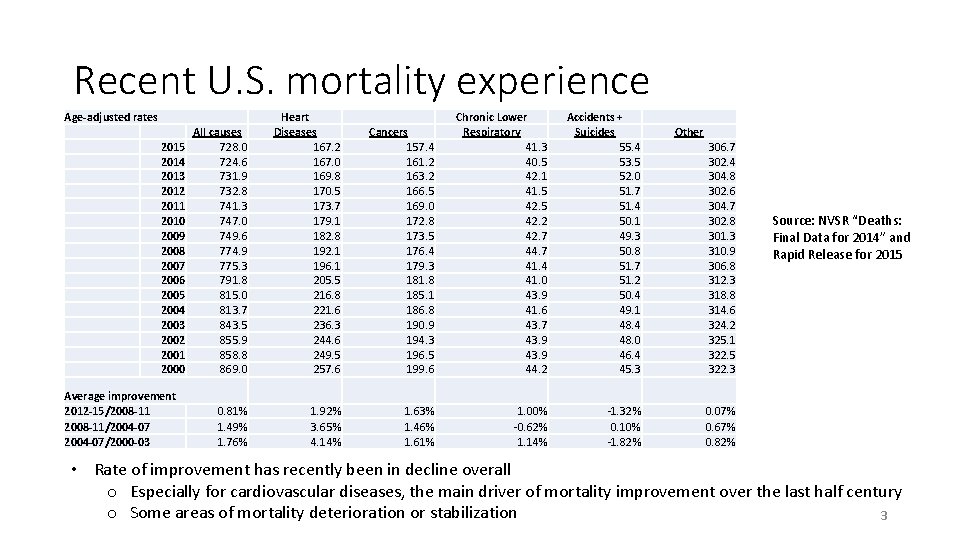
Recent U. S. mortality experience Age-adjusted rates 2015 2014 2013 2012 2011 2010 2009 2008 2007 2006 2005 2004 2003 2002 2001 2000 Average improvement 2012 -15/2008 -11/2004 -07/2000 -03 All causes 728. 0 724. 6 731. 9 732. 8 741. 3 747. 0 749. 6 774. 9 775. 3 791. 8 815. 0 813. 7 843. 5 855. 9 858. 8 869. 0 Heart Diseases 167. 2 167. 0 169. 8 170. 5 173. 7 179. 1 182. 8 192. 1 196. 1 205. 5 216. 8 221. 6 236. 3 244. 6 249. 5 257. 6 Cancers 157. 4 161. 2 163. 2 166. 5 169. 0 172. 8 173. 5 176. 4 179. 3 181. 8 185. 1 186. 8 190. 9 194. 3 196. 5 199. 6 Chronic Lower Respiratory 41. 3 40. 5 42. 1 41. 5 42. 2 42. 7 44. 7 41. 4 41. 0 43. 9 41. 6 43. 7 43. 9 44. 2 Accidents + Suicides 55. 4 53. 5 52. 0 51. 7 51. 4 50. 1 49. 3 50. 8 51. 7 51. 2 50. 4 49. 1 48. 4 48. 0 46. 4 45. 3 0. 81% 1. 49% 1. 76% 1. 92% 3. 65% 4. 14% 1. 63% 1. 46% 1. 61% 1. 00% -0. 62% 1. 14% -1. 32% 0. 10% -1. 82% Other 306. 7 302. 4 304. 8 302. 6 304. 7 302. 8 301. 3 310. 9 306. 8 312. 3 318. 8 314. 6 324. 2 325. 1 322. 5 322. 3 Source: NVSR “Deaths: Final Data for 2014” and Rapid Release for 2015 0. 07% 0. 67% 0. 82% • Rate of improvement has recently been in decline overall o Especially for cardiovascular diseases, the main driver of mortality improvement over the last half century o Some areas of mortality deterioration or stabilization 3
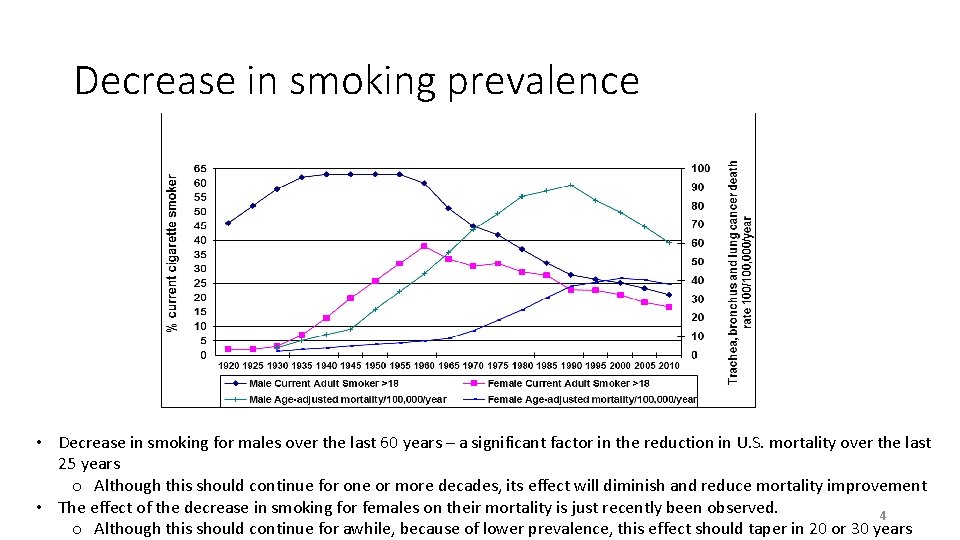
Decrease in smoking prevalence • Decrease in smoking for males over the last 60 years – a significant factor in the reduction in U. S. mortality over the last 25 years o Although this should continue for one or more decades, its effect will diminish and reduce mortality improvement • The effect of the decrease in smoking for females on their mortality is just recently been observed. 4 o Although this should continue for awhile, because of lower prevalence, this effect should taper in 20 or 30 years
Obesity – delayed effect • Increase in adult and childhood obesity over last 40 years is well documented – now up to 35. 7% for U. S. adults • Although obesity mortality paradox has arisen in certain areas where the effect of obesity on mortality is favorable (e. g. , older ages, those with current health conditions) o Overall should contribute to mortality deterioration in the future o Possibly with a long lagged effect 5
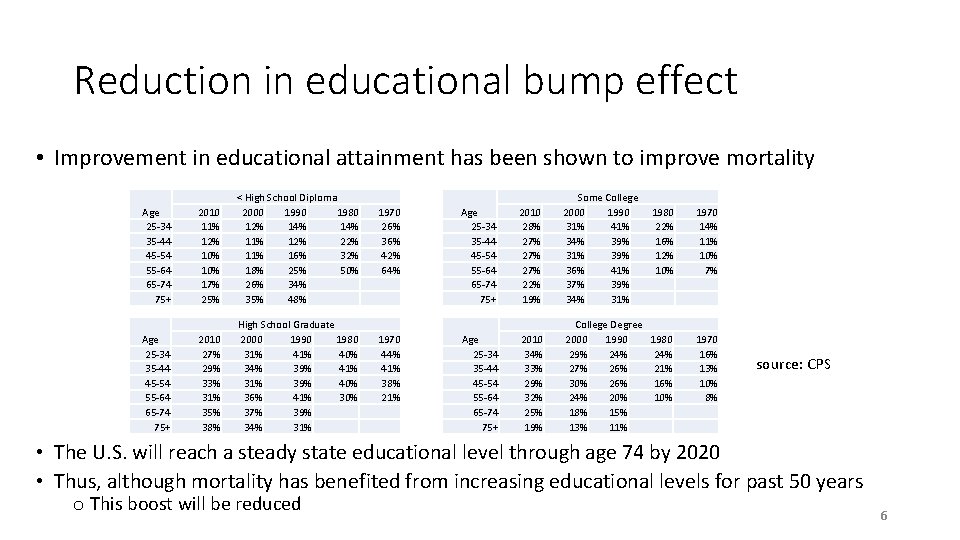
Reduction in educational bump effect • Improvement in educational attainment has been shown to improve mortality Age 25 -34 35 -44 45 -54 55 -64 65 -74 75+ 2010 11% 12% 10% 17% 25% < High School Diploma 2000 1990 1980 12% 14% 11% 12% 22% 11% 16% 32% 18% 25% 50% 26% 34% 35% 48% Age 25 -34 35 -44 45 -54 55 -64 65 -74 75+ 2010 27% 29% 33% 31% 35% 38% High School Graduate 2000 1990 1980 31% 40% 34% 39% 41% 39% 40% 36% 41% 30% 37% 39% 34% 31% 1970 26% 36% 42% 64% 1970 44% 41% 38% 21% Age 25 -34 35 -44 45 -54 55 -64 65 -74 75+ 2010 28% 27% 27% 22% 19% Some College 2000 1990 31% 41% 34% 39% 31% 39% 36% 41% 37% 39% 34% 31% Age 25 -34 35 -44 45 -54 55 -64 65 -74 75+ 2010 34% 33% 29% 32% 25% 19% College Degree 2000 1990 1980 29% 24% 27% 26% 21% 30% 26% 16% 24% 20% 18% 15% 13% 11% 1980 22% 16% 12% 10% 1970 14% 11% 10% 7% 1970 16% 13% 10% 8% source: CPS • The U. S. will reach a steady state educational level through age 74 by 2020 • Thus, although mortality has benefited from increasing educational levels for past 50 years o This boost will be reduced 6
Cardiovascular – the easy stuff is behind us • Improvements in mortality due to cardiovascular diseases have been the great driver of mortality improvement over the last half century in economically developed countries o But significant low hanging fruit have been identified (improved diagnostics and treatment of risk factors such as high blood pressure and cholesterol) and to a great extent harvested 7
Other factors • Inequality o Mortality improvement of those with lower incomes have been smaller than those with higher income o Related to higher risk factors, e. g. , smoking, obesity, education • Aging o Mortality improvement at older ages have historically been more difficult to achieve (“age gradient”) o Increase in frequency of multiple health conditions in the elderly o Nothing on the horizon that would counter this trend • Marrieds o Those who are married have traditionally had better mortality experience o Will this continue as rate of marriage has decreased? • Drug abuse, suicides 8
Unknown unknowns • Future drivers of favorable mortality improvement will likely emerge o Enhanced medical treatment, pharmaceuticals, technology breakthroughs, self-driving cars • But there also possible drivers of unfavorable mortality improvement o Pandemics, antimicrobial resistance (700, 000 per annum globally now; 10 m by 2050? ), natural and man-made disasters (increasing with future climate change), conflicts/terrorism 9
Summary • Recently in the U. S. , there has been a slowdown in mortality improvement • In the future o Previous improvement in cardiovascular disease mortality will be tough to duplicate o Adverse effects of human behavior will be difficult to offset in any case § Favorable effects of decreasing smoking prevalence will diminish § Longer exposure to high prevalence of obesity § Suicides and drug overdoses may be difficult to overcome § Although some population segments will become increasingly fit, sedentary living may more than offset in other segments • Favorable influences are bound to arise, but it is easy to forget that unfavorable influences may also emerge 10