LongerTerm Trends Dian Seidel SPARC Temperature Trends Panel


 Berlin Analysis (Ulrike) Reanalysis (not considering)")

 • Hadley Atmospheric Temperature (Had.")


 datasets compared with satellite.")

- Slides: 13
Longer-Term Trends Dian Seidel SPARC Temperature Trends Panel Meeting 19 -21 July 2006 Abingdon
Outline • • Datasets Considerations for our paper Recently published results Possible approaches for our paper
Datasets • • Radiosonde Rocketsonde (Chantal? ) Berlin Analysis (Ulrike) Reanalysis (not considering)
Considerations • Summarize published results and/or make new calculations? • What can we learn (or report) that we didn’t know circa Ramaswamy et al. (Rev. Geophys. 2001)? – Effect of homogeneity adjustments on trends (Lanzante et al. 2003; Free et al. , JGR 2005; Thorne et al. , JGR 2005; CCSP 2006) – Time-segmented trends (Seidel and Lanzante, JGR 2004; Ramaswamy et al. , Science 2006) – Details of volcanic signal (Free and Angell, JGR 2002; Santer et al. , JGR 2001; above studies) – Statistical issues (Nishizawa and Yoden, JGR 2005) • Use only homogeneity-adjusted datasets?
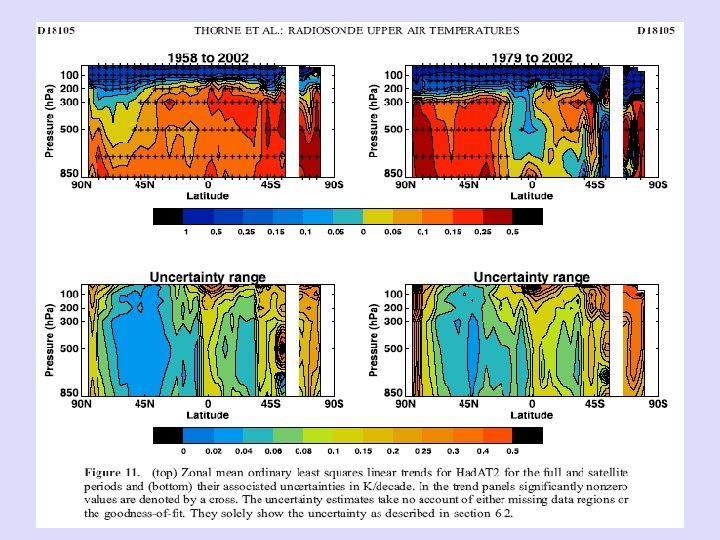
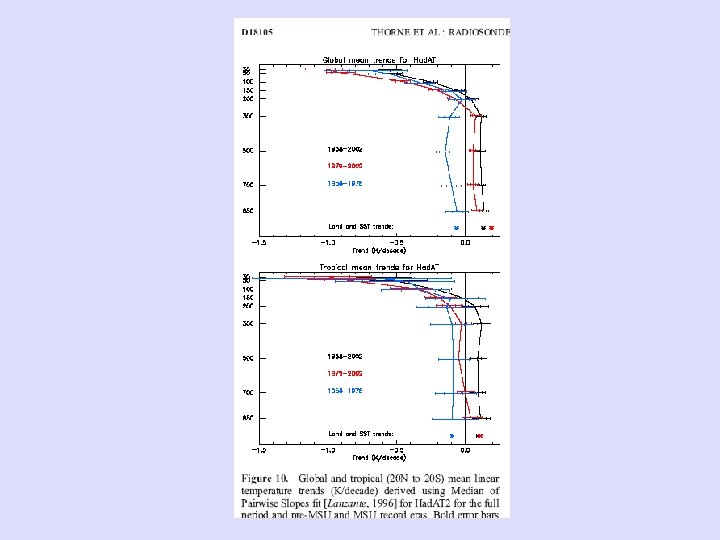
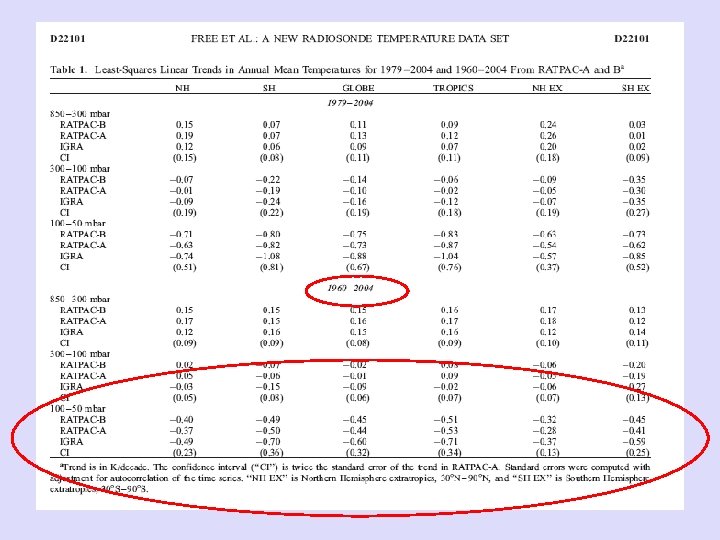
Radiosonde Datasets 1958 -present (Update of 3/2005 Reading Report) • Hadley Atmospheric Temperature (Had. AT) – – – UK Met Office (Thorne et al. JGR 2005) 9 levels, including 300, 200, 150, 100, 50, and 30 h. Pa Gridded product Adjustments based on Lanzante et al. (2003) and neighbor comparisons Available now at http: //hadobs. metoffice. com/hadat/ • Radiosonde Atmospheric Temperature Products for Assessing Climate (RATPAC) – NOAA (Free et al. JGR 2005) – 16 levels, including 300, 250, 200, 150, 100, 70, 50 and 30 h. Pa – Two datasets: • Large-scale (~30 deg bands) anomaly time series based on Lanzante et al. (2003) adjustments through 1979, then first-difference method and metadata • Station data with no adjustments post-1979, also 10 -deg zonal data – Available now at http: //www. ncdc. noaa. gov/oa/cab/ratpac/index. php
RATPAC and Had. AT Coverage Source: CCSP report
Source: CCSP report Note great discrepancy between datasets in early years – RATPAC more variable, with larger Agung signal.
Temperature Trends in the Lower Atmosphere For further information on CCSP Synthesis and Assessment Product 1. 1 http: //www. climatescience. gov/
Note good agreement between sonde (and surface) datasets compared with satellite.
Possible Approaches • No discussion of pre-satellite errors – Pro: keeps paper shorter and more focused – Con: ignores developments with sonde data • Text-only review of recent literature – Pro: addresses new developments without adding much length – Con: doesn’t allow presentation of new analysis • Text-with-figure(s) presentation of some pre 1979 observations – Pro: most thorough approach – Cons: longer paper, more work