
LOGO www qut edu au Managing media for
- Slides: 33
LOGO www. qut. edu. au Managing media for natural disasters: An analysis of Nepalese media contents using news frames and PPRR cycle Bharat Raj Poudel Prof. Gerry Fitzgerald Adj. Prof. Meen Bahadur Poudyal Chhetri
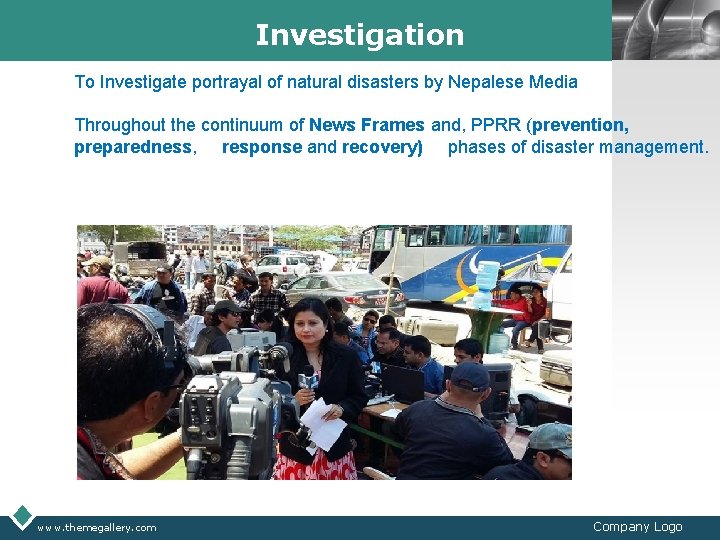
Investigation LOGO To Investigate portrayal of natural disasters by Nepalese Media Throughout the continuum of News Frames and, PPRR (prevention, preparedness, response and recovery) phases of disaster management. www. themegallery. com Company Logo
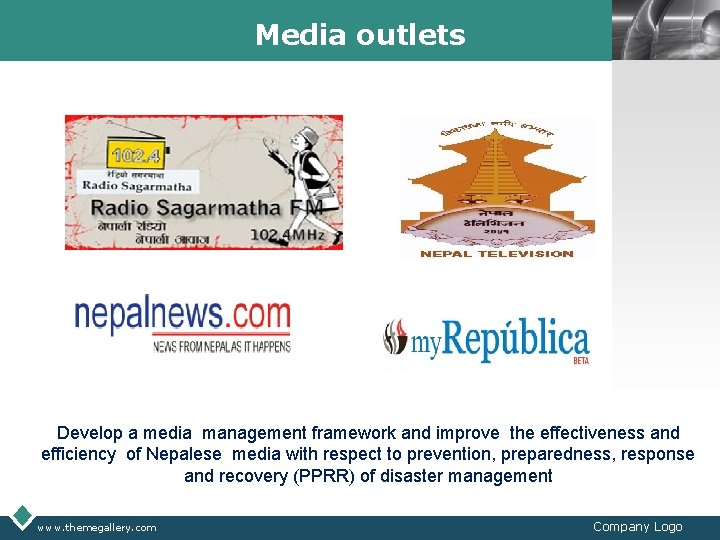
Media outlets LOGO Develop a media management framework and improve the effectiveness and efficiency of Nepalese media with respect to prevention, preparedness, response and recovery (PPRR) of disaster management www. themegallery. com Company Logo
Questions/Objectives MEDIA PORTRAYAL THROUGHOUT PHASES OF DM EFFECTIVE ROLE OF MEDIA SIGNIFICANT COMPONENTS BEST MODEL/FRAMEWORK DESCRIBE: CURRENT STATUS OF MEDIA MANAGEMENT IN DISASTERS IDENTIFY: SIGNIFICANT ISSUES ASSOCIATED DETERMINE: THE CHARACTERISTICS OF EFFECTIVE MEDIA MANAGEMENT DEVELOP: A FRAMEWORK /MODEL www. qut. edu. au LOGO
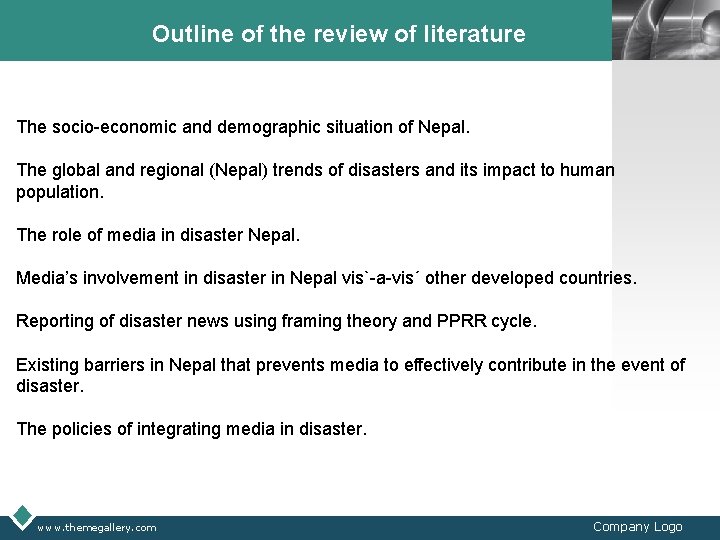
Outline of the review of literature LOGO The socio-economic and demographic situation of Nepal. The global and regional (Nepal) trends of disasters and its impact to human population. The role of media in disaster Nepal. Media’s involvement in disaster in Nepal vis`-a-vis´ other developed countries. Reporting of disaster news using framing theory and PPRR cycle. Existing barriers in Nepal that prevents media to effectively contribute in the event of disaster. The policies of integrating media in disaster. www. themegallery. com Company Logo
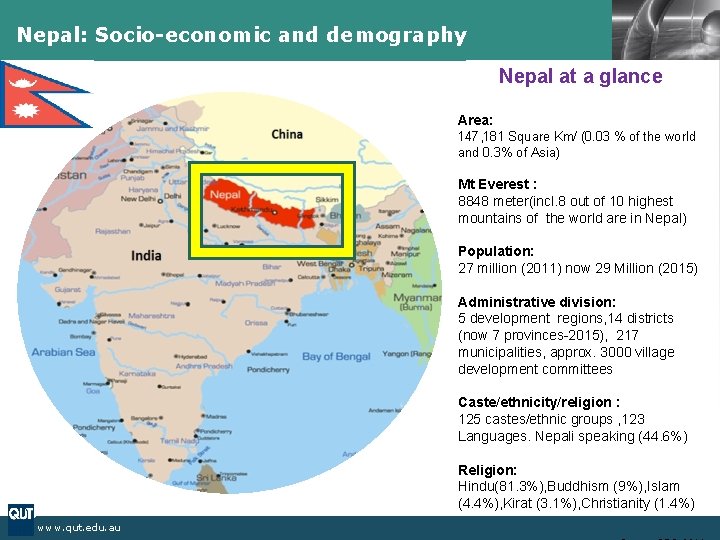
Nepal: Socio-economic and demography LOGO Nepal at a glance Area: 147, 181 Square Km/ (0. 03 % of the world and 0. 3% of Asia) Mt Everest : 8848 meter(incl. 8 out of 10 highest mountains of the world are in Nepal) Population: 27 million (2011) now 29 Million (2015) Administrative division: 5 development regions, 14 districts (now 7 provinces-2015), 217 municipalities, approx. 3000 village development committees Caste/ethnicity/religion : 125 castes/ethnic groups , 123 Languages. Nepali speaking (44. 6%) Religion: Hindu(81. 3%), Buddhism (9%), Islam (4. 4%), Kirat (3. 1%), Christianity (1. 4%) www. qut. edu. au
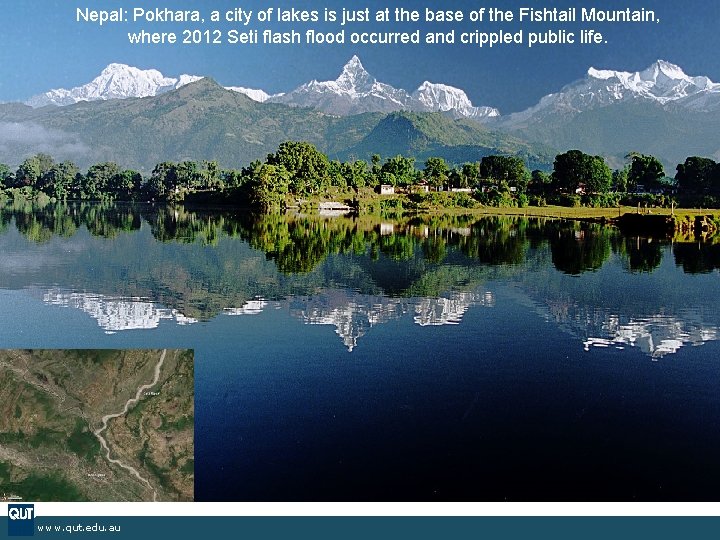
Nepal: Pokhara, a city of lakes is just at the base of the Fishtail Mountain, Nepalwhere 2012 Seti flash flood occurred and crippled public life. LOGO www. qut. edu. au
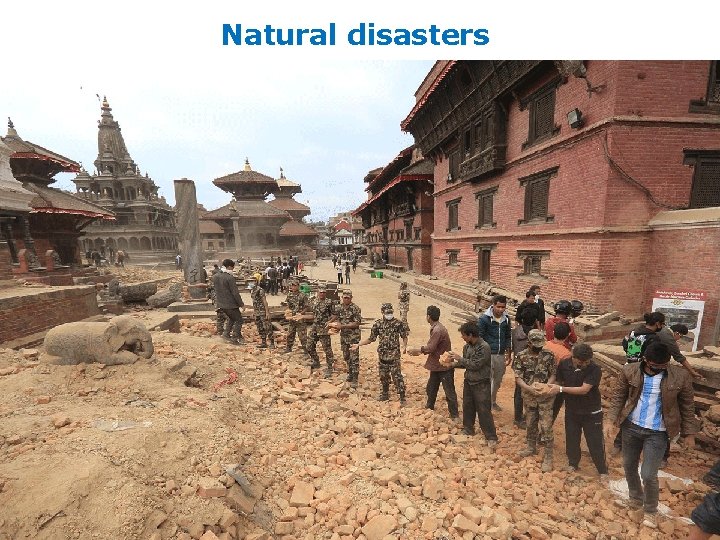
Natural disasters www. themegallery. com Source: Mo. HA, 2012 Company Logo
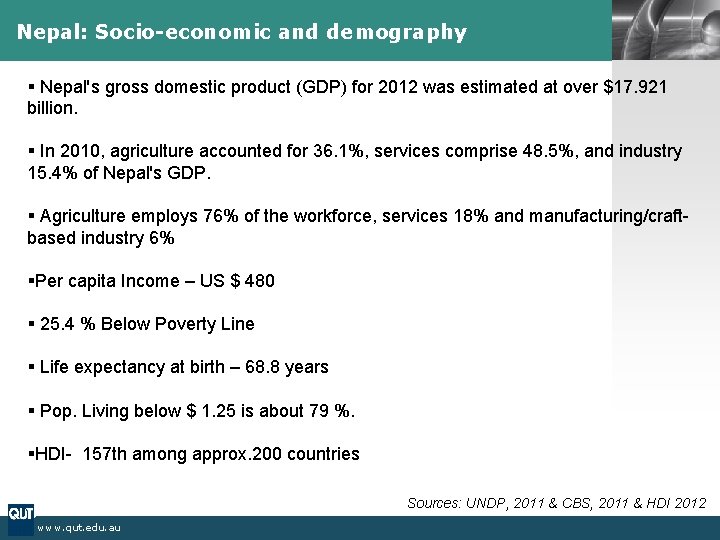
Nepal: Socio-economic and demography LOGO § Nepal's gross domestic product (GDP) for 2012 was estimated at over $17. 921 billion. § In 2010, agriculture accounted for 36. 1%, services comprise 48. 5%, and industry 15. 4% of Nepal's GDP. § Agriculture employs 76% of the workforce, services 18% and manufacturing/craftbased industry 6% §Per capita Income – US $ 480 § 25. 4 % Below Poverty Line § Life expectancy at birth – 68. 8 years § Pop. Living below $ 1. 25 is about 79 %. §HDI- 157 th among approx. 200 countries Sources: UNDP, 2011 & CBS, 2011 & HDI 2012 www. qut. edu. au
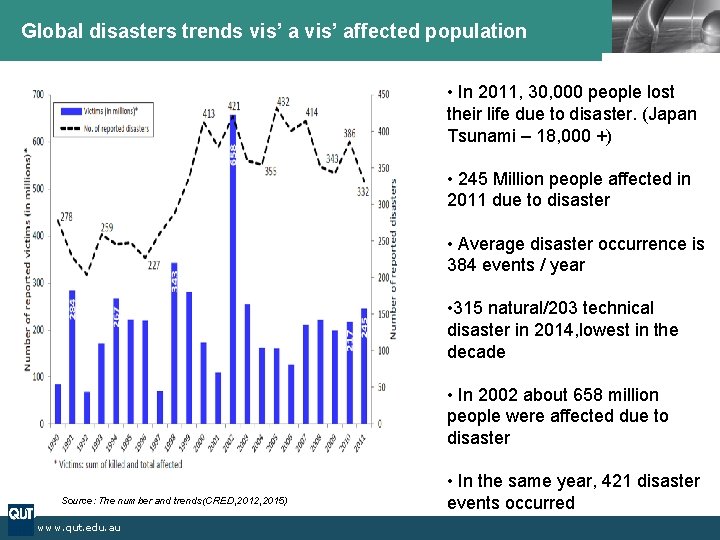
Global disasters trends vis’ affected population LOGO • In 2011, 30, 000 people lost their life due to disaster. (Japan Tsunami – 18, 000 +) • 245 Million people affected in 2011 due to disaster • Average disaster occurrence is 384 events / year • 315 natural/203 technical disaster in 2014, lowest in the decade • In 2002 about 658 million people were affected due to disaster Source: The number and trends(CRED, 2012, 2015) www. qut. edu. au • In the same year, 421 disaster events occurred
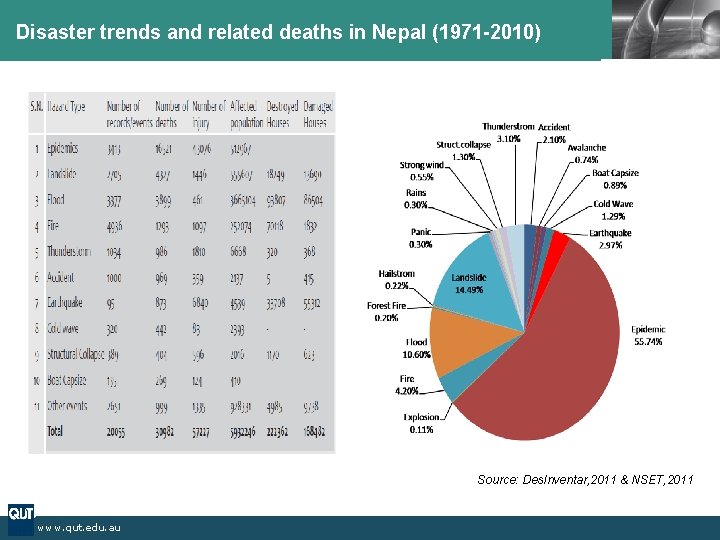
Disaster trends and related deaths in Nepal (1971 -2010) LOGO Source: Des. Inventar, 2011 & NSET, 2011 www. qut. edu. au
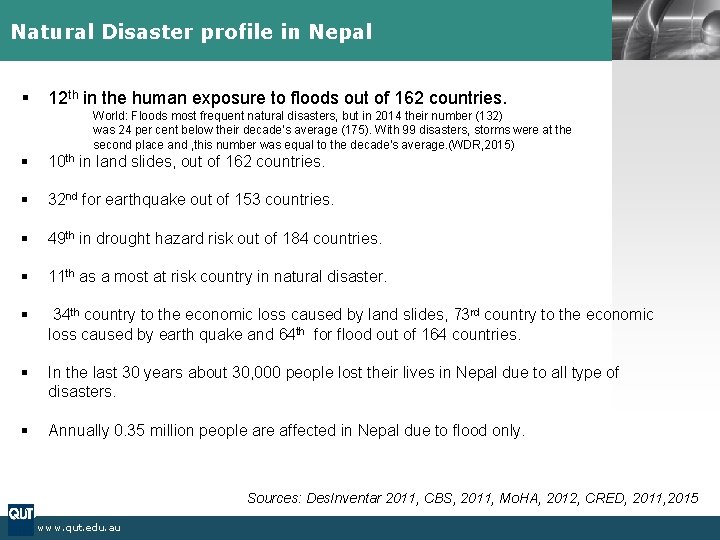
Natural Disaster profile in Nepal § LOGO 12 th in the human exposure to floods out of 162 countries. World: Floods most frequent natural disasters, but in 2014 their number (132) was 24 per cent below their decade’s average (175). With 99 disasters, storms were at the second place and , this number was equal to the decade’s average. (WDR, 2015) § 10 th in land slides, out of 162 countries. § 32 nd for earthquake out of 153 countries. § 49 th in drought hazard risk out of 184 countries. § 11 th as a most at risk country in natural disaster. § 34 th country to the economic loss caused by land slides, 73 rd country to the economic loss caused by earth quake and 64 th for flood out of 164 countries. § In the last 30 years about 30, 000 people lost their lives in Nepal due to all type of disasters. § Annually 0. 35 million people are affected in Nepal due to flood only. Sources: Des. Inventar 2011, CBS, 2011, Mo. HA, 2012, CRED, 2011, 2015 www. qut. edu. au
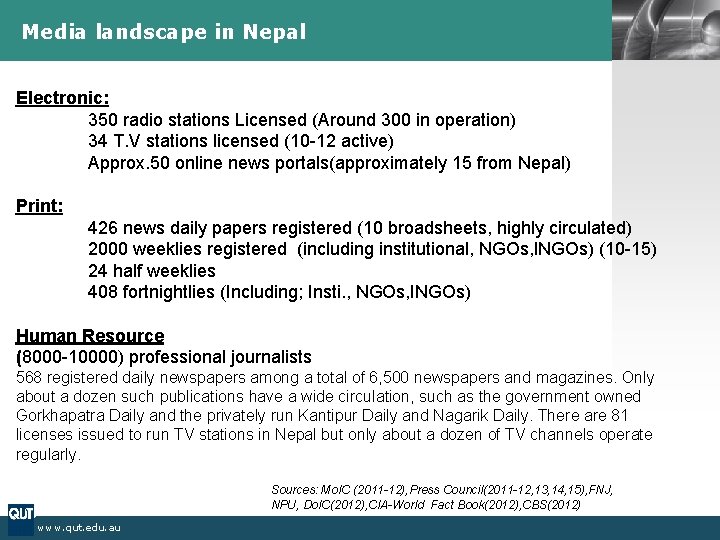
Media landscape in Nepal LOGO Electronic: 350 radio stations Licensed (Around 300 in operation) 34 T. V stations licensed (10 -12 active) Approx. 50 online news portals(approximately 15 from Nepal) Print: 426 news daily papers registered (10 broadsheets, highly circulated) 2000 weeklies registered (including institutional, NGOs, INGOs) (10 -15) 24 half weeklies 408 fortnightlies (Including; Insti. , NGOs, INGOs) Human Resource (8000 -10000) professional journalists 568 registered daily newspapers among a total of 6, 500 newspapers and magazines. Only about a dozen such publications have a wide circulation, such as the government owned Gorkhapatra Daily and the privately run Kantipur Daily and Nagarik Daily. There are 81 licenses issued to run TV stations in Nepal but only about a dozen of TV channels operate regularly. Sources: Mo. IC (2011 -12), Press Council(2011 -12, 13, 14, 15), FNJ, NPU, Do. IC(2012), CIA-World Fact Book(2012), CBS(2012) www. qut. edu. au
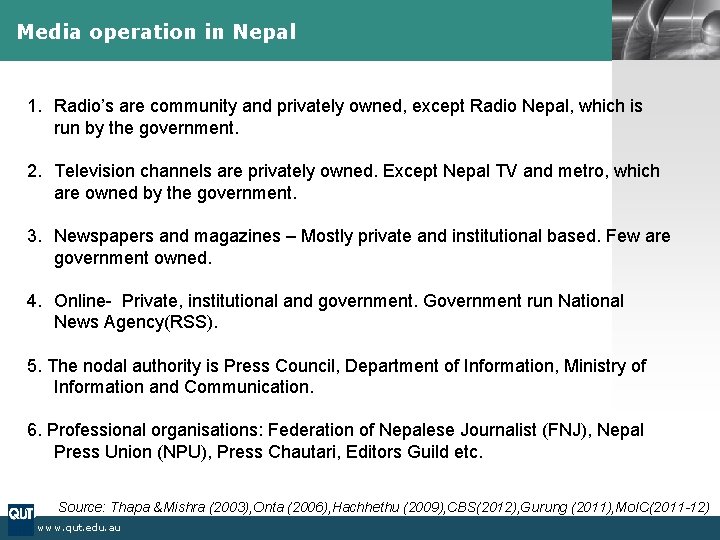
Media operation in Nepal LOGO 1. Radio’s are community and privately owned, except Radio Nepal, which is run by the government. 2. Television channels are privately owned. Except Nepal TV and metro, which are owned by the government. 3. Newspapers and magazines – Mostly private and institutional based. Few are government owned. 4. Online- Private, institutional and government. Government run National News Agency(RSS). 5. The nodal authority is Press Council, Department of Information, Ministry of Information and Communication. 6. Professional organisations: Federation of Nepalese Journalist (FNJ), Nepal Press Union (NPU), Press Chautari, Editors Guild etc. Source: Thapa &Mishra (2003), Onta (2006), Hachhethu (2009), CBS(2012), Gurung (2011), Mo. IC(2011 -12) www. qut. edu. au
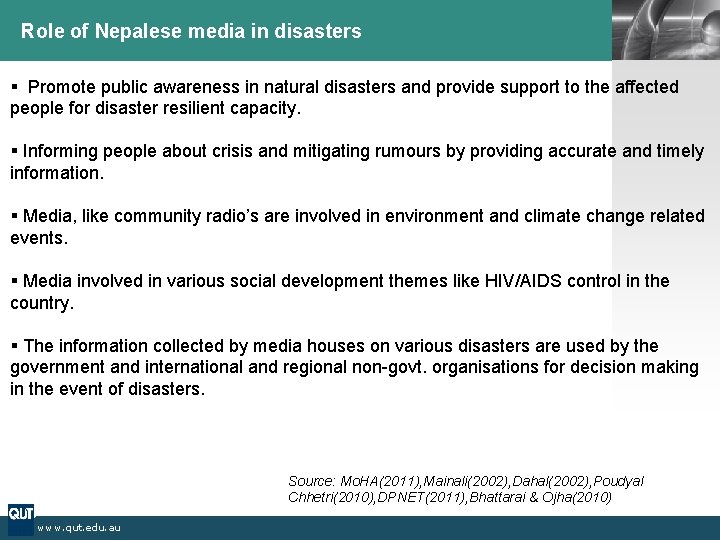
Role of Nepalese media in disasters LOGO § Promote public awareness in natural disasters and provide support to the affected people for disaster resilient capacity. § Informing people about crisis and mitigating rumours by providing accurate and timely information. § Media, like community radio’s are involved in environment and climate change related events. § Media involved in various social development themes like HIV/AIDS control in the country. § The information collected by media houses on various disasters are used by the government and international and regional non-govt. organisations for decision making in the event of disasters. Source: Mo. HA(2011), Mainali(2002), Dahal(2002), Poudyal Chhetri(2010), DPNET(2011), Bhattarai & Ojha(2010) www. qut. edu. au
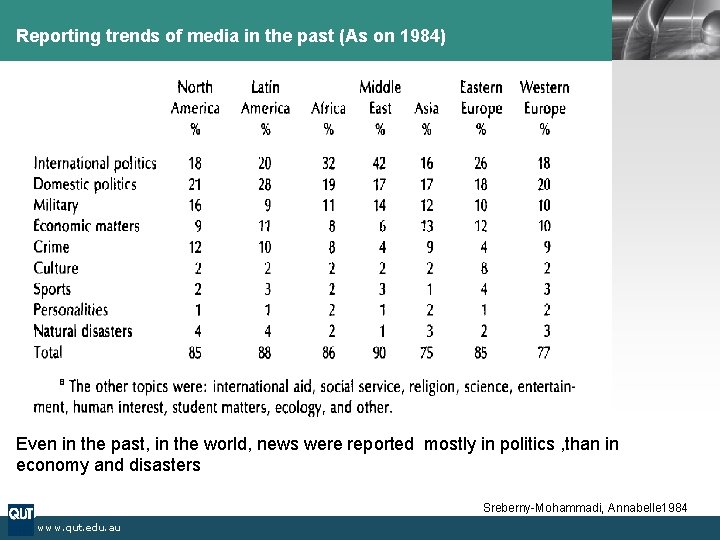
Reporting trends of media in the past (As on 1984) LOGO Even in the past, in the world, news were reported mostly in politics , than in economy and disasters Sreberny-Mohammadi, Annabelle 1984 www. qut. edu. au
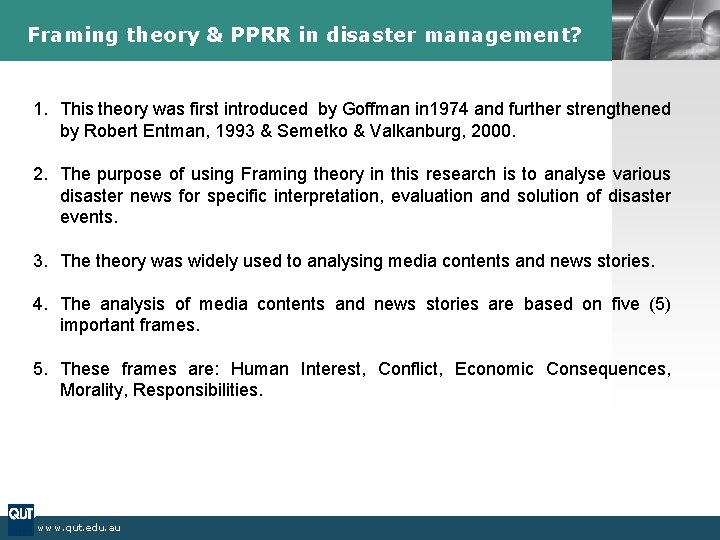
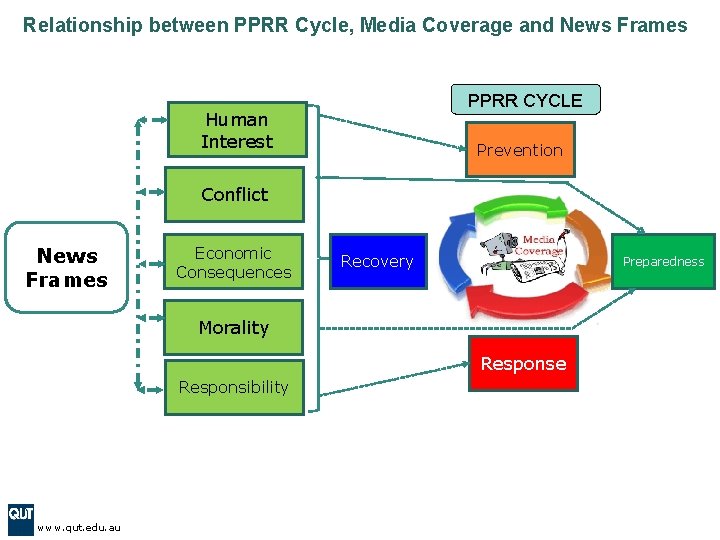
Framing theory & PPRR in disaster management? LOGO 1. This theory was first introduced by Goffman in 1974 and further strengthened by Robert Entman, 1993 & Semetko & Valkanburg, 2000. 2. The purpose of using Framing theory in this research is to analyse various disaster news for specific interpretation, evaluation and solution of disaster events. 3. The theory was widely used to analysing media contents and news stories. 4. The analysis of media contents and news stories are based on five (5) important frames. 5. These frames are: Human Interest, Conflict, Economic Consequences, Morality, Responsibilities. www. qut. edu. au
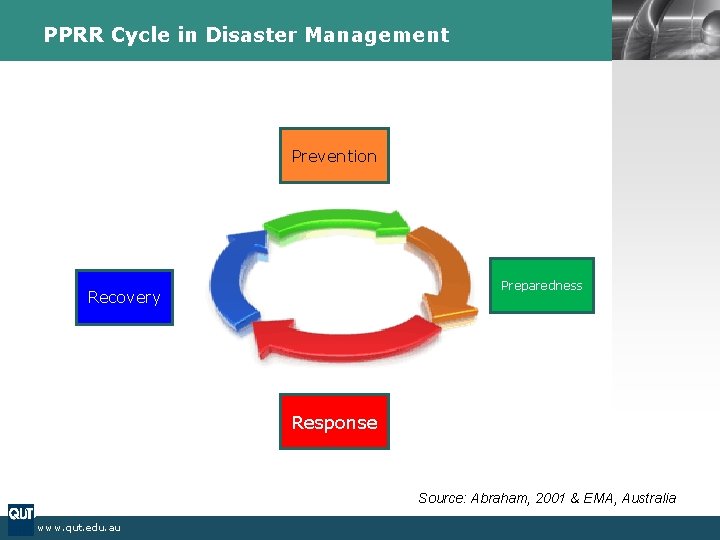
PPRR Cycle in Disaster Management LOGO Prevention Preparedness Recovery Response Source: Abraham, 2001 & EMA, Australia www. qut. edu. au
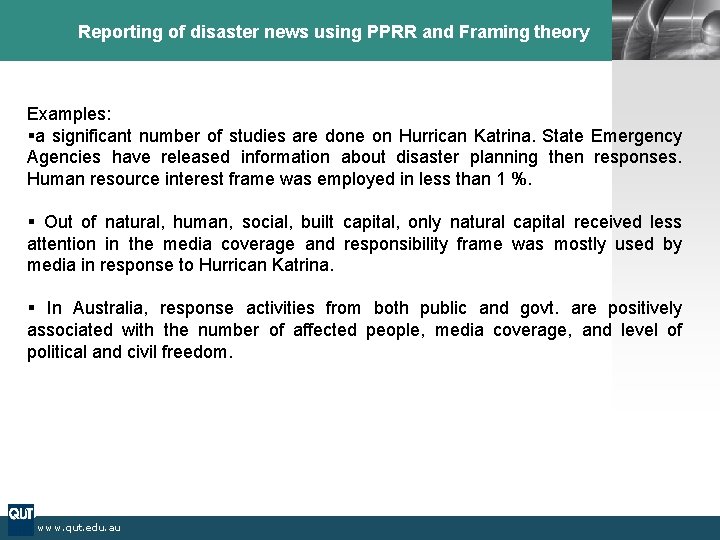
Reporting of disaster news using PPRR and Framing theory LOGO Examples: §a significant number of studies are done on Hurrican Katrina. State Emergency Agencies have released information about disaster planning then responses. Human resource interest frame was employed in less than 1 %. § Out of natural, human, social, built capital, only natural capital received less attention in the media coverage and responsibility frame was mostly used by media in response to Hurrican Katrina. § In Australia, response activities from both public and govt. are positively associated with the number of affected people, media coverage, and level of political and civil freedom. www. qut. edu. au
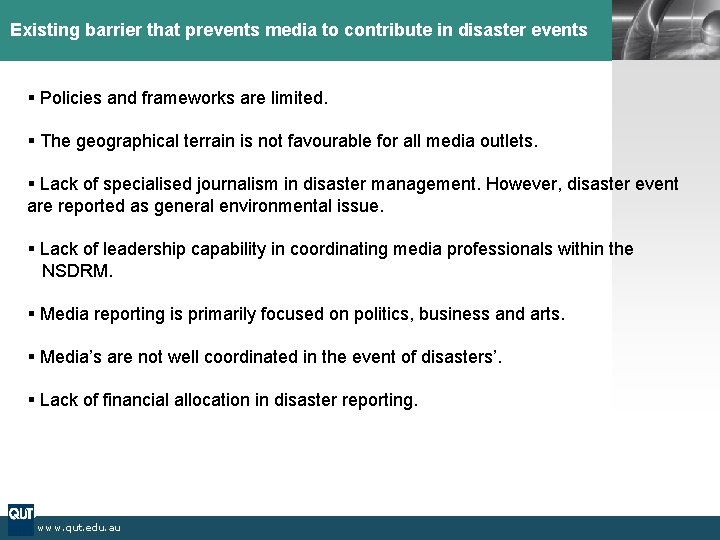
Existing barrier that prevents media to contribute in disaster events LOGO § Policies and frameworks are limited. § The geographical terrain is not favourable for all media outlets. § Lack of specialised journalism in disaster management. However, disaster event are reported as general environmental issue. § Lack of leadership capability in coordinating media professionals within the NSDRM. § Media reporting is primarily focused on politics, business and arts. § Media’s are not well coordinated in the event of disasters’. § Lack of financial allocation in disaster reporting. www. qut. edu. au
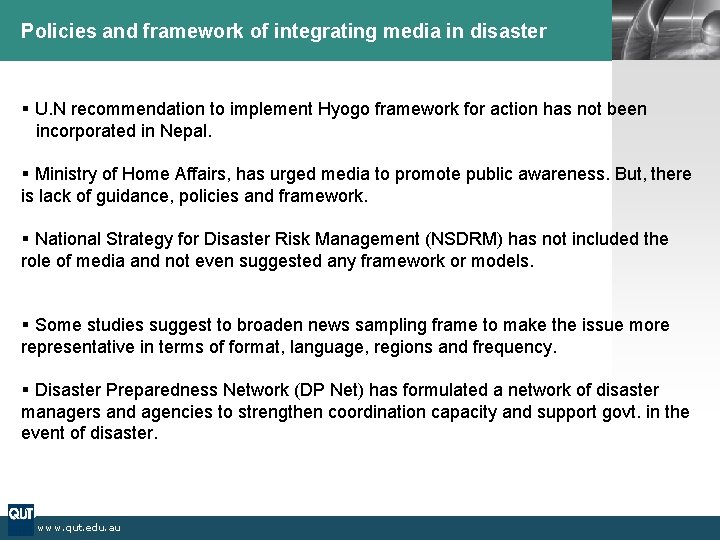
Policies and framework of integrating media in disaster LOGO § U. N recommendation to implement Hyogo framework for action has not been incorporated in Nepal. § Ministry of Home Affairs, has urged media to promote public awareness. But, there is lack of guidance, policies and framework. § National Strategy for Disaster Risk Management (NSDRM) has not included the role of media and not even suggested any framework or models. § Some studies suggest to broaden news sampling frame to make the issue more representative in terms of format, language, regions and frequency. § Disaster Preparedness Network (DP Net) has formulated a network of disaster managers and agencies to strengthen coordination capacity and support govt. in the event of disaster. www. qut. edu. au
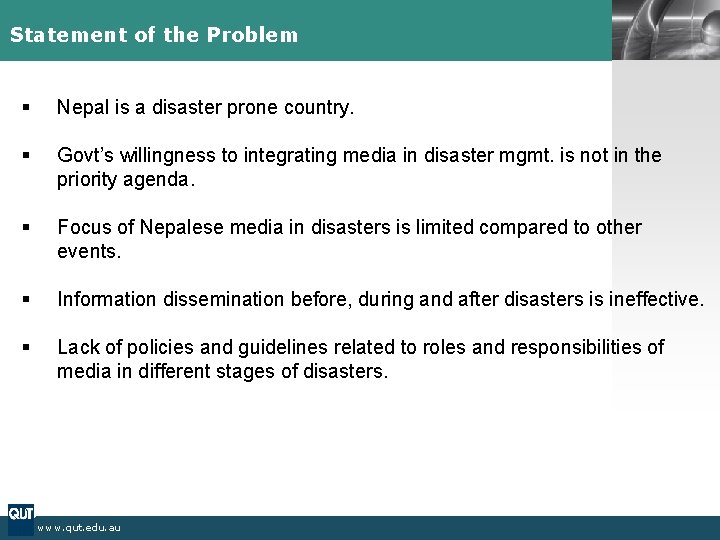
Statement of the Problem LOGO § Nepal is a disaster prone country. § Govt’s willingness to integrating media in disaster mgmt. is not in the priority agenda. § Focus of Nepalese media in disasters is limited compared to other events. § Information dissemination before, during and after disasters is ineffective. § Lack of policies and guidelines related to roles and responsibilities of media in different stages of disasters. www. qut. edu. au
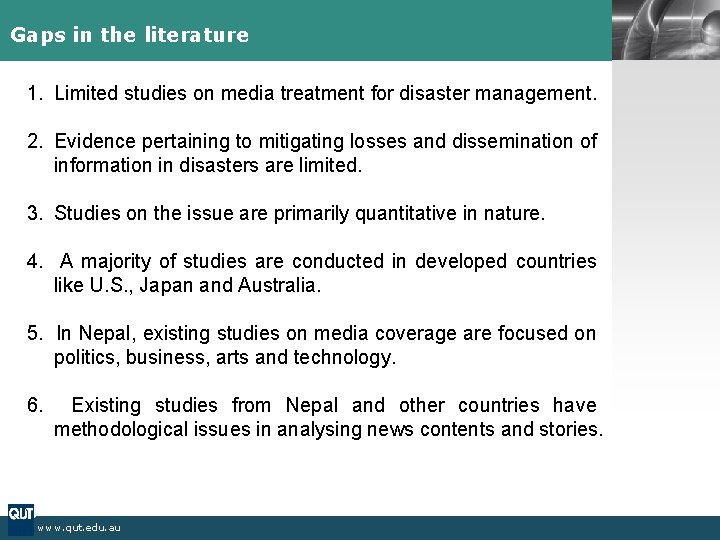
Gaps in the literature 1. Limited studies on media treatment for disaster management. 2. Evidence pertaining to mitigating losses and dissemination of information in disasters are limited. 3. Studies on the issue are primarily quantitative in nature. 4. A majority of studies are conducted in developed countries like U. S. , Japan and Australia. 5. In Nepal, existing studies on media coverage are focused on politics, business, arts and technology. 6. Existing studies from Nepal and other countries have methodological issues in analysing news contents and stories. www. qut. edu. au LOGO
Relationship between PPRR Cycle, Media Coverage and News Frames PPRR CYCLE Human Interest Prevention Conflict News Frames Economic Consequences Recovery Preparedness Morality Response Responsibility www. qut. edu. au
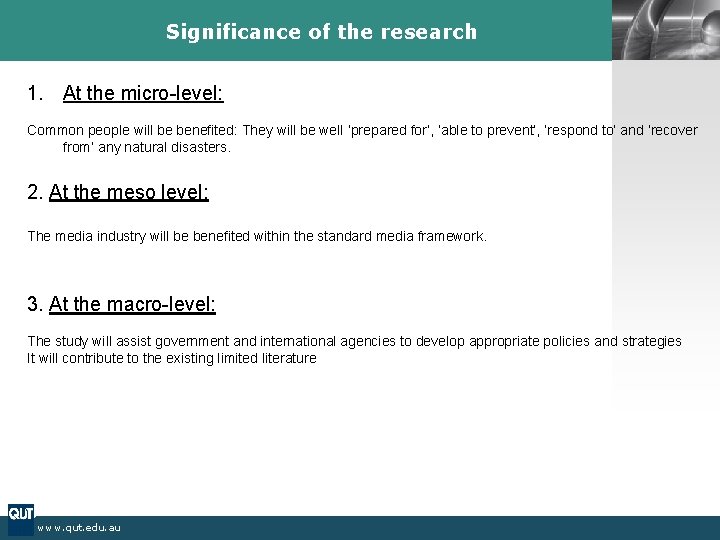
Significance of the research LOGO 1. At the micro-level: Common people will be benefited: They will be well ‘prepared for’, ‘able to prevent’, ‘respond to’ and ‘recover from’ any natural disasters. 2. At the meso level: The media industry will be benefited within the standard media framework. 3. At the macro-level: The study will assist government and international agencies to develop appropriate policies and strategies It will contribute to the existing limited literature www. qut. edu. au
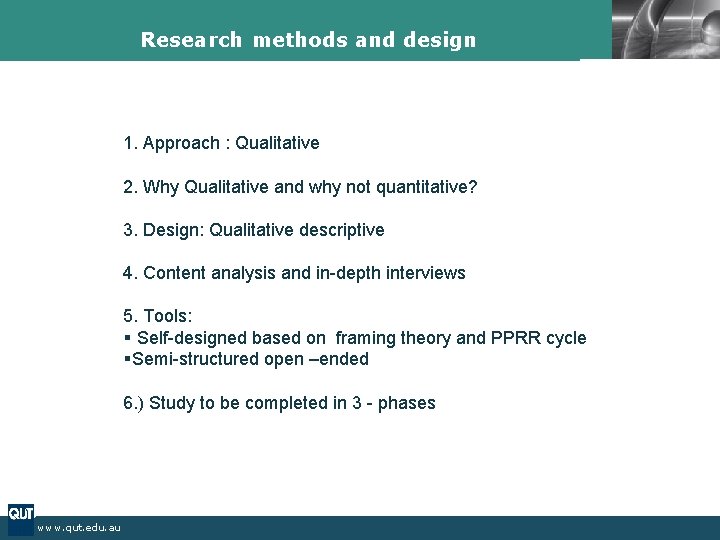
Research methods and design 1. Approach : Qualitative 2. Why Qualitative and why not quantitative? 3. Design: Qualitative descriptive 4. Content analysis and in-depth interviews 5. Tools: § Self-designed based on framing theory and PPRR cycle §Semi-structured open –ended 6. ) Study to be completed in 3 - phases www. qut. edu. au LOGO
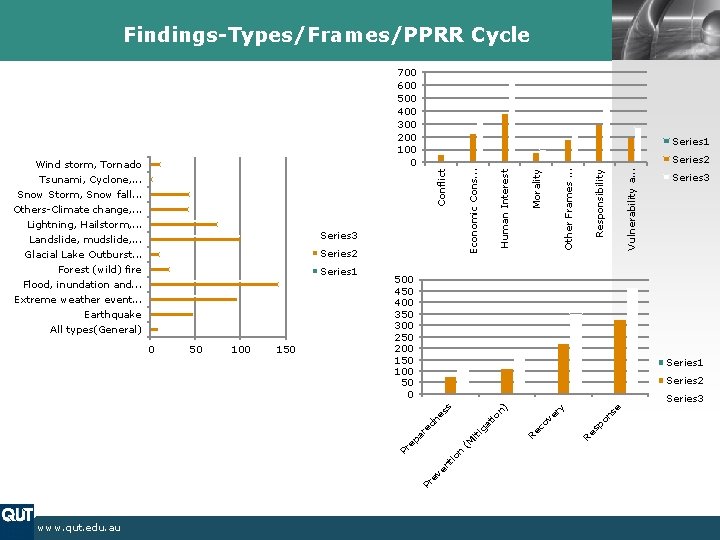
Findings-Types/Frames/PPRR Cycle 700 600 500 400 300 200 100 0 Series 1 Responsibility Morality Series 2 Series 3 iti g (M n tio en ev Pr on se sp n) at io ne ed ar ep Pr www. qut. edu. au Series 3 Series 1 Re 150 ry 100 co ve 50 ss 0 500 450 400 350 300 250 200 150 100 50 0 Re Series 1 Vulnerability a. . . Series 2 Other Frames. . . Series 3 Human Interest Economic Cons. . . Series 2 Conflict Wind storm, Tornado Tsunami, Cyclone, . . . Snow Storm, Snow fall. . . Others-Climate change, . . . Lightning, Hailstorm, . . . Landslide, mudslide, . . . Glacial Lake Outburst. . . Forest (wild) fire Flood, inundation and. . . Extreme weather event. . . Earthquake All types(General) LOGO
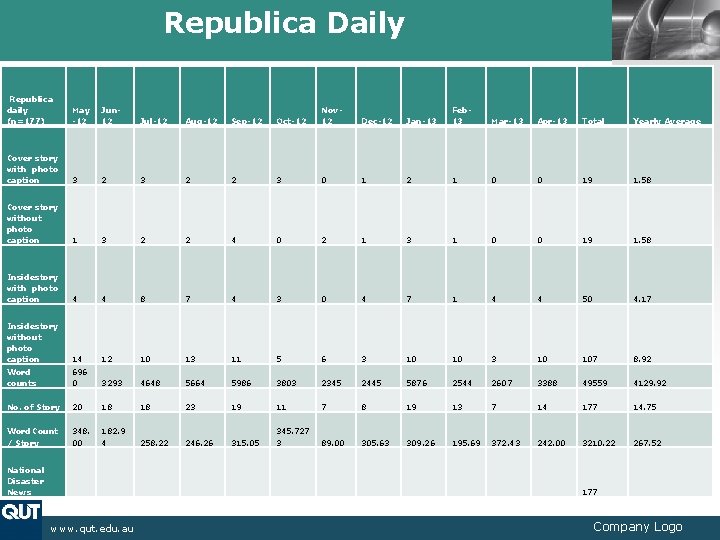
Republica Daily LOGO Republica daily (n=177) May -12 Jun 12 Jul-12 Aug-12 Sep-12 Oct-12 Nov 12 Dec-12 Jan-13 Feb 13 Mar-13 Apr-13 Total Yearly Average Cover story with photo caption 3 2 2 3 0 1 2 1 0 0 19 1. 58 Cover story without photo caption 1 3 2 2 4 0 2 1 3 1 0 0 19 1. 58 Inside story with photo caption 4 4 8 7 4 3 0 4 7 1 4 4 50 4. 17 Inside story without photo caption 14 12 10 13 11 5 6 3 10 107 8. 92 Word counts 696 0 3293 4648 5664 5986 3803 2345 2445 5876 2544 2607 3388 49559 4129. 92 No. of Story 20 18 18 23 19 11 7 8 19 13 7 14 177 14. 75 Word Count / Story 348. 00 182. 9 4 258. 22 246. 26 315. 05 345. 727 3 89. 00 305. 63 309. 26 195. 69 372. 43 242. 00 3210. 22 267. 52 National Disaster News 177 www. qut. edu. au Company Logo
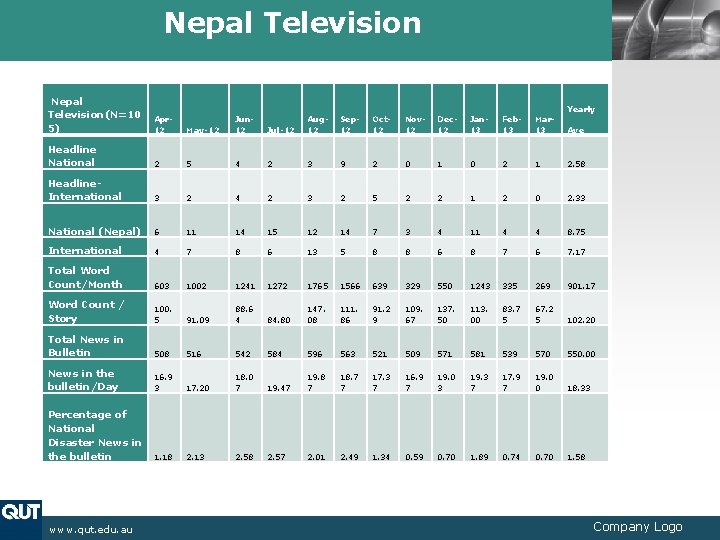
Nepal Television(N=10 5) Apr 12 Headline National LOGO Yearly May-12 Jun 12 Jul-12 Aug 12 Sep 12 Oct 12 Nov 12 Dec 12 Jan 13 Feb 13 Mar 13 Ave 2 5 4 2 3 9 2 0 1 0 2 1 2. 58 Headline. International 3 2 4 2 3 2 5 2 2 1 2 0 2. 33 National (Nepal) 6 11 14 15 12 14 7 3 4 11 4 4 8. 75 International 4 7 8 6 13 5 8 8 6 8 7 6 7. 17 Total Word Count/Month 603 1002 1241 1272 1765 1566 639 329 550 1243 335 269 901. 17 Word Count / Story 100. 5 91. 09 88. 6 4 84. 80 147. 08 111. 86 91. 2 9 109. 67 137. 50 113. 00 83. 7 5 67. 2 5 102. 20 Total News in Bulletin 508 516 542 584 596 563 521 509 571 581 539 570 550. 00 News in the bulletin/Day 16. 9 3 17. 20 18. 0 7 19. 47 19. 8 7 18. 7 7 17. 3 7 16. 9 7 19. 0 3 19. 3 7 17. 9 7 19. 0 0 18. 33 Percentage of National Disaster News in the bulletin 1. 18 2. 13 2. 58 2. 57 2. 01 2. 49 1. 34 0. 59 0. 70 1. 89 0. 74 0. 70 1. 58 www. qut. edu. au Company Logo
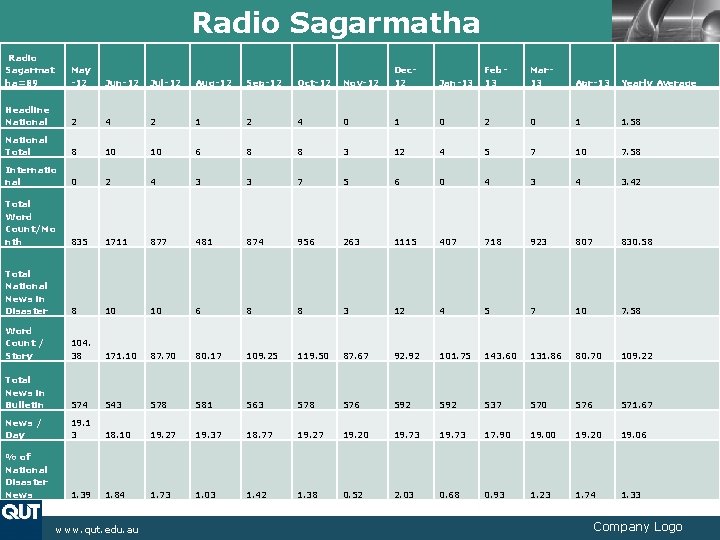
Radio Sagarmatha LOGO Radio Sagarmat ha=89 May -12 Jun-12 Jul-12 Aug-12 Sep-12 Oct-12 Nov-12 Dec 12 Jan-13 Feb 13 Mar 13 Apr-13 Yearly Average Headline National 2 4 2 1 2 4 0 1 0 2 0 1 1. 58 National Total 8 10 10 6 8 8 3 12 4 5 7 10 7. 58 Internatio nal 0 2 4 3 3 7 5 6 0 4 3. 42 Total Word Count/Mo nth 835 1711 877 481 874 956 263 1115 407 718 923 807 830. 58 Total National News in Disaster 8 10 10 6 8 8 3 12 4 5 7 10 7. 58 Word Count / Story 104. 38 171. 10 87. 70 80. 17 109. 25 119. 50 87. 67 92. 92 101. 75 143. 60 131. 86 80. 70 109. 22 Total News in Bulletin 574 543 578 581 563 578 576 592 537 570 576 571. 67 News / Day 19. 1 3 18. 10 19. 27 19. 37 18. 77 19. 20 19. 73 17. 90 19. 00 19. 20 19. 06 % of National Disaster News 1. 39 1. 84 1. 73 1. 03 1. 42 1. 38 0. 52 2. 03 0. 68 0. 93 1. 23 1. 74 1. 33 www. qut. edu. au Company Logo
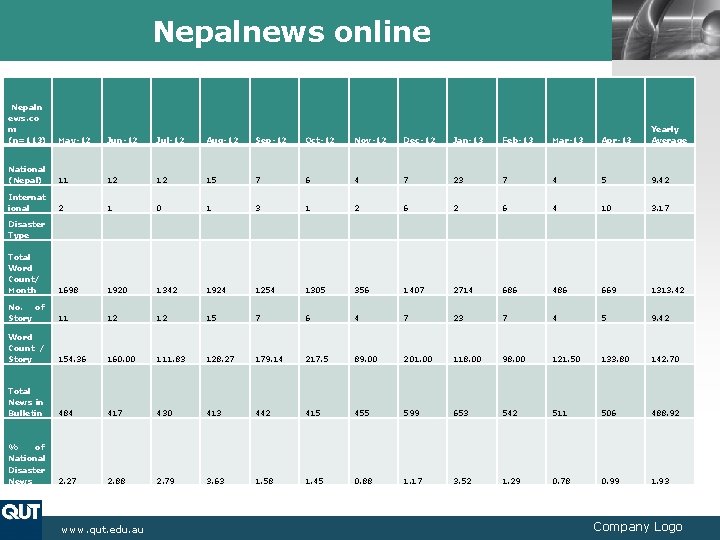
Nepalnews online LOGO Nepaln ews. co m (n=113) May-12 Jun-12 Jul-12 Aug-12 Sep-12 Oct-12 Nov-12 Dec-12 Jan-13 Feb-13 Mar-13 Apr-13 Yearly Average National (Nepal) 11 12 12 15 7 6 4 7 23 7 4 5 9. 42 Internat ional 2 1 0 1 3 1 2 6 4 10 3. 17 Disaster Type Total Word Count/ Month 1698 1920 1342 1924 1254 1305 356 1407 2714 686 486 669 1313. 42 No. of Story 11 12 12 15 7 6 4 7 23 7 4 5 9. 42 Word Count / Story 154. 36 160. 00 111. 83 128. 27 179. 14 217. 5 89. 00 201. 00 118. 00 98. 00 121. 50 133. 80 142. 70 Total News in Bulletin 484 417 430 413 442 415 455 599 653 542 511 506 488. 92 % of National Disaster News 2. 27 2. 88 2. 79 3. 63 1. 58 1. 45 0. 88 1. 17 3. 52 1. 29 0. 78 0. 99 1. 93 www. qut. edu. au Company Logo
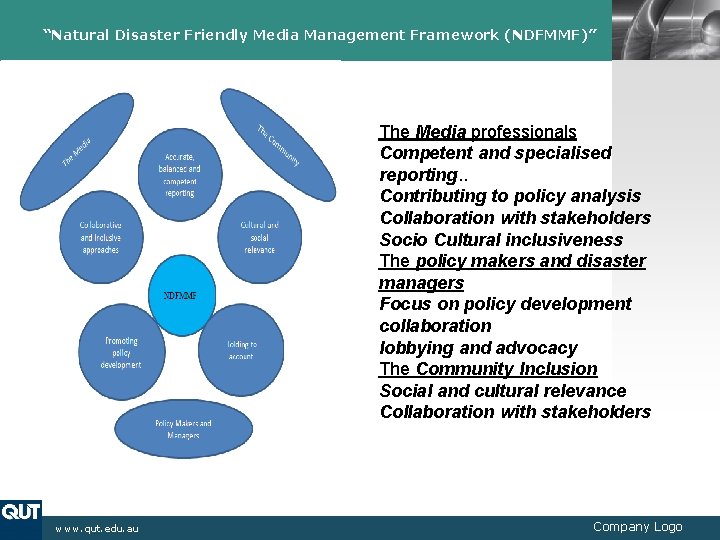
“Natural Disaster Friendly Media Management Framework (NDFMMF)” LOGO The Media professionals Competent and specialised reporting. . Contributing to policy analysis Collaboration with stakeholders Socio Cultural inclusiveness The policy makers and disaster managers Focus on policy development collaboration lobbying and advocacy The Community Inclusion Social and cultural relevance Collaboration with stakeholders www. qut. edu. au Company Logo
LOGO C l i c k t o e d i t c o m p a n y s l o g a n .