Logistics Management LSM 730 Lecture 31 Dr Khurrum


")

 • Identify")


 • Supply source selection •")


 Costs of Logistics’ contribution to sales")


 80 70 60 50 40")
 · Product characteristics - Weight-bulk ratio - Value-weight ratio")

 · Product characteristics - Weight-bulk ratio - Value-weight ratio")

 Prentice Hall, Inc. 13 -50")
 Prentice Hall, Inc. 13 -51")
 Prentice Hall, Inc. 13 -52")
 where Vi = volume flowing from (to) point I Ri =")


- Slides: 59
Logistics Management LSM 730 Lecture 31 Dr. Khurrum S. Mughal 1 -1
Course Material • Course Text Book – Business Logistics/Supply Chain Management, 5 th Edition by Ronald H. Ballou • Recommended Books – Logistics – An Introduction to Supply Chain Management by Donald Waters – Introduction to Logistics Systems Management by Gianpaolo Ghiani, Gilbert Laporte, Roberto Musmanno – Supply Chain Management: In Theory and Practice by Birgit Dam Jespersen, Tage Skjott-Larsen • Miscellaneous Sources: – Council of Supply Chain Management Professional - https: //cscmp. org/ – Journal of Business Logistics 1 -2
Introduction • Needs in the historical perspective • Constraints due to low technological developments in transportation and storage • Locating near production – Self sustaining villages • As old as trade itself • Principle of Comparative Advantage 1 -3
Supply Chain Management Defined § Interaction between marketing, logistics and production § Interactions that take place legally separated firms § Importance of Supply Chain Relationships 1 -4
The Logistics/SC Mission 1 -5
Supply Chain Schematic 1 -5
The Supply Chain • The process is full of Recurring activities • Usually no single source point is located in one place • Control of firm over its raw material source and the point of consumption for customers • Physical Supply Channel Vs Physical Distribution Channel • The reverse logistics channel 1 -7
The Immediate Supply Chain for an Individual Firm Transportation Warehousing Transportation Customers Information flows Factory Transportation Vendors/plants/ports Warehousing Transportation 1 -2
Evolution of Supply Chain Management 1 -9
Scope of the Supply Chain for Most Firms Business logistics Physical supply (Materials management) Sources of supply Physical distribution Plants/ operations • Transportation • Inventory maintenance • Order processing • Acquisition • Protective packaging • Warehousing • Materials handling • Information maintenance Customers • Transportation • Inventory maintenance • Order processing • Product scheduling • Protective packaging • Warehousing • Materials handling • Information maintenance Focus firm’s internal supply chain 1 -14
Key Activities/Processes • Primary – – Setting Customer service goals Transportation Inventory Management Order Processing and Information Flows • Secondary, or supporting – – – Warehousing Materials Handling Acquisition (Purchasing) Protective Packaging Product Scheduling Information Maintenance 1 -11
Key Activities/Processes • Primary – Setting Customer service goals (work with marketing) • Identify customer needs and wants for logistics customer service • Determine customer response to service • Set customer service level – directly related to costs – Transportation (primary cost absorbing activity which adds place value) • • Mode and transport service selection Freight consolidation Carrier Routing Vehicle Scheduling Equipment Selection Claims Processing Rate Auditing 1 -12
Key Activities/Processes • Primary – Inventory Management (adds time value to the products, bridges the gaps between supply and demand) • • • Raw Materials and finished goods stocking policies Short term sales forecasting Product mix at stocking points Number, size and location of stocking points Just-in-time (low levels), push (forecasting based) and pull (order based) strategies – Order Processing and Information Flows (Activity that triggers the whole process) • Sales order – inventory interface procedures • Order information transmittal methods • Ordering Rules 1 -13
Key Activities/Processes • Secondary, or supporting – Warehousing • • Space Determination Stock layout and dock design Warehouse configuration Stock placement – Materials Handling • • Equipment selection Equipment replacement policies Order-picking procedures Stock storage and retrieval 1 -14
Key Activities/Processes • Secondary, or supporting – Acquisition (Purchasing) • Supply source selection • Purchase timing • Purchase quantities – Protective Packaging • Handling • Storage • Protection from Loss and Damage 1 -15
Key Activities/Processes • Secondary, or supporting – Product Scheduling • Specify aggregate quantities • Sequence and time production output • Schedule supplies for production/operations – Information Maintenance (Supports all other logistics activities) • Information Collection, Storage, and manipulation • Data Analysis • Control Procedures 1 -16
The Activity Mix • Difference between Key and Support activities – Key activities almost in every logistics channel • Contribute most to the total logistics cost 1 -17
Significance of Logistics 1 -18
Significance of Logistics 1 -19
Significance of Logistics 1 -20
Significance of Logistics 1 -21
Significance of Logistics 1 -22
The Supply Chain is Multi-Enterprise Scope in reality Focus Company Suppliers Customers/ End users Supplier’s suppliers Acquire Convert Distribute Product and information flow 1 -23
Study Framework It involves the decision triangle---The focus is here 1 -24
The Logistics Strategy Triangle Customer service goals · The product · Logistics service · Information sys. 1 -25
Relationship of Logistics to Marketing and Production PRODUCTION/ OPERATIONS Sample activities: · Quality control · Detailed production scheduling · Equipment maint. · Capacity planning · Work measurement & standards Interface activities: · Product scheduling · Plant location · Purchasing LOGISTICS Sample activities: ·Transport · Inventory · Order processing · Materials handling Interface activities: · Customer service standards · Pricing · Packaging · Retail location Productionlogistics interface Marketinglogistics interface Internal Supply Chain. MARKETING Sample activities: · Promotion · Market research · Product mix · Sales force management 1 -21
Corporate Strategy • Broad goals need to be converted to definite plans – Based on external and internal environment • Xerox – Number 1 in field service • Star Kist Foods – Dominant packer in Tuna Business • Corporate strategies are then converted into strategies for functional areas 1 -27
Logistics/SC Strategy • Almost same creative process as corporate strategy – Replacement machines by an office machine company – American Hospital Supply – terminals at each customers office 1 -28
Corporate to Functional Strategic Planning External factors Corporate strategic plan • Economic • Regulatory • Technological • Competitive Marketing Manufacturing Finance Logistics Functional strategic plans 2 -29
Logistics/SC Strategy • The objectives of logistics strategy are : – Cost reduction – Capital Reduction – Service Improvement Use ROLA 1 -30
Logistics/SC Strategy • The objectives of logistics strategy are : – Cost reduction • • Reducing Variable Costs Minimize cost of movement and storage Minimize cost at constant service levels Evaluating alternate routes and warehousing locations 1 -31
Logistics/SC Strategy • The objectives of logistics strategy are : – Capital Reduction • • • Minimize level of investment in logistics system Shipping direct to customers Public vs private warehouses Just-in-time inventory Outsourcing logistics Increase in Variable costs but increase in ROI 1 -32
Logistics/SC Strategy • The objectives of logistics strategy are : – Service Improvement • Maximize customer service • Costs Increase – Parker Hannifin- seals and O-rings • Competitors price on same product 8% less • Demand for Inventory stocking point with additional value added services 1 -33
Logistics’ Objective Maximize return on logistics assets (ROLA) Costs of Logistics’ contribution to sales logistics operations Investment in logistics assets 2 -34
Logistics/SC Strategy • To answer the questions: What, When and How • Levels of logistical planning : • Strategic – Longer than 1 year • Tactical – Usually less than a year • Operational – Daily or hourly basis – To ensure the efficient and effective product flow through strategically planned logistics channel 1 -35
Strategic, Tactical, and Operational Decision Making Decision area Strategic Tactical Operational Transportation Mode selection Seasonal equipment leasing Dispatching Inventories Location, Control policies Safety stock levels Order filling Order processing Order entry, transmittal, and processing system design Processing orders, Filling back orders Purchasing Development of supplier- Contracting, buyer relations Forward buying Expediting Warehousing Handling equipment selection, Layout design Facility location Space utilization Order picking and restocking Number, size, and location of warehouses 2 -7
Six Concepts for Logistics Strategy Formulation • Total Cost Concept – Tradeoff conflicting costs at optimum • Differentiated distribution – Not all products should be provided the same level of customer service • Mixed strategy – A pure strategy has higher costs than a mixed strategy • Postponement – Delay formation of the final product as long as possible • Shipment consolidation – Smaller shipment sizes have disproportionately higher transportation costs than larger ones • Product standardization – Avoid product variety since it adds to inventory 1 -37
Six Concepts for Logistics Strategy Formulation • Total Cost Concept – Tradeoff analysis – Tradeoff conflicting costs at optimum – Examples: • Direct cost of Transport Service vs Indirect cost of inventory levels 1 -38
A Cost Conflict in Logistics 2 -39
Nature of the Product • Product classification – Consumer Products • Convenience goods • Shopping goods • Specialty goods – Industrial goods 1 -40
Nature of the Product • Product classification – Industrial Products • Raw Material that is part of finishes goods • Machinery and equipment that is used for production process • Goods not directly involved like business services, and office Supplies 1 -41
Sales volume Product Life-Cycle Curve Introduction Growth Maturity Decline Time 3 -42
Nature of the Product 80% of Firm’s sales are generated by 20% of the product line items - Difference in inventory and distribution 3 -43
ABC Classification for 14 Products Product Number D-204 D-212 Product Rank by a Sales 1 2 Monthly Sales (000 s) $5, 056 3, 424 Cumulative An ABC Percent of Classifib c Total Sales Total Items cation 36. 2% 7. 1% 60. 7 14. 3 A D-185 -0 D-191 D-192 D-193 D-179 -0 3 4 5 6 7 1, 052 893 843 727 451 68. 3 74. 6 80. 7 85. 7 89. 1 21. 4 28. 6 35. 7 42. 9 50. 0 D-195 D-196 D-186 -0 D-198 -0 D-199 D-200 D-205 8 9 10 11 12 13 14 412 214 205 188 172 170 159 $13, 966 91. 9 93. 6 95. 1 96. 4 97. 6 98. 7 100. 0 57. 1 64. 3 71. 4 78. 6 85. 7 92. 9 100. 0 B C 3 -5
Cumulative 80 -20 Curve 100 90 Total sales (%) 80 70 60 50 40 30 A items 20 B items C items 10 0 0 20 40 60 Total items (%) 80 100 3 -6
Nature of the Product (Cont’d) · Product characteristics - Weight-bulk ratio - Value-weight ratio - Substitutability - Risk · Product packaging · Product pricing - F. o. b. origin - F. o. b. destination - Zone pricing - Single and uniform pricing - Quantity discounts - Deals 3 -46
Zone 2 Zone 3 $136. 31 $137. 38 Boston Zone 8 $147. 38 Zone 7 $144. 81 Zone 6 $142. 43 Zone 5 $140. 00 Zone 4 $138. 33 UPS Pricing Zones 3 -18
Nature of the Product (Cont’d) · Product characteristics - Weight-bulk ratio - Value-weight ratio - Substitutability - Risk · Product packaging · Product pricing - F. o. b. origin - F. o. b. destination - Zone pricing - Single and uniform pricing - Quantity discounts - Deals 3 -48
Location Overview What's located? · Sourcing points - Plants - Vendors - Ports · Intermediate points - Warehouses - Terminals - Public facilities (fire, police, and ambulance stations) - Service centers · Sink points - Retail outlets - Customers/Users CR (2004) Prentice Hall, Inc. 13 -49
Bid Rent Curve CR (2004) Prentice Hall, Inc. 13 -50
Weber’s Classification of Industries CR (2004) Prentice Hall, Inc. 13 -51
Hoover’s Transport Curves CR (2004) Prentice Hall, Inc. 13 -52
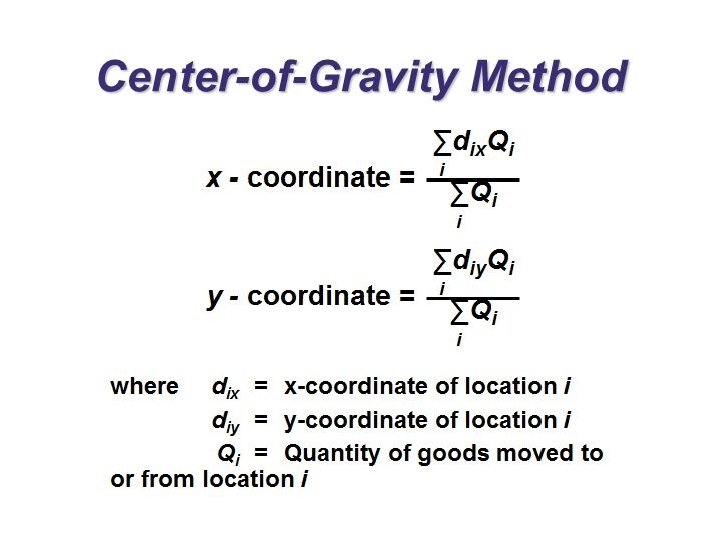
COG Method (Cont’d) where Vi = volume flowing from (to) point I Ri = transportation rate to ship Vi from (to) point i Xi, Yi = coordinate points for point i = coordinate points for facility to be located CR (2004) Prentice Hall, Inc. 13 -55
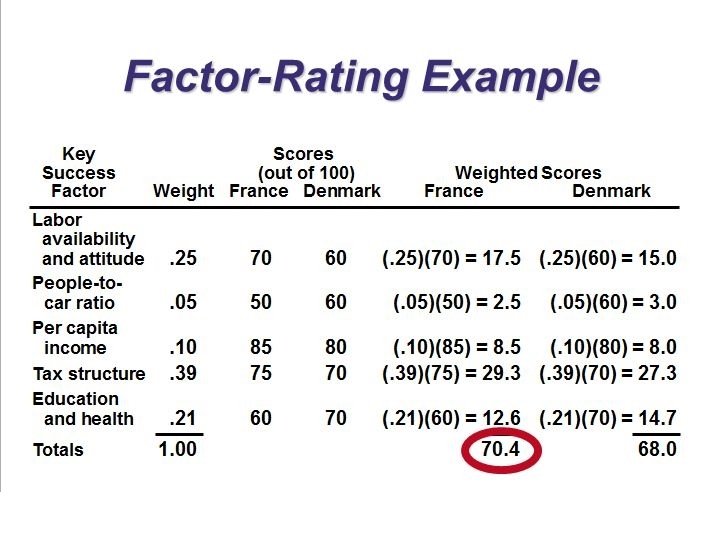
Example • The firm is considering 2 alternative sites for its new facility, France and Denmark • After evaluating the firm’s Needs, the Managers have Narrowed the list of Important Selection Criteria down into 5 major Factors. – Labor availability and attitude – People to car ratio – Per capita income – Tax structure – Education and Health
Cost-Profit-Volume Analysis
Cost-Profit-Volume Analysis Since Bowling Green has the lowest Total Cost at the volume being produced, it will be chosen as the site of new facility