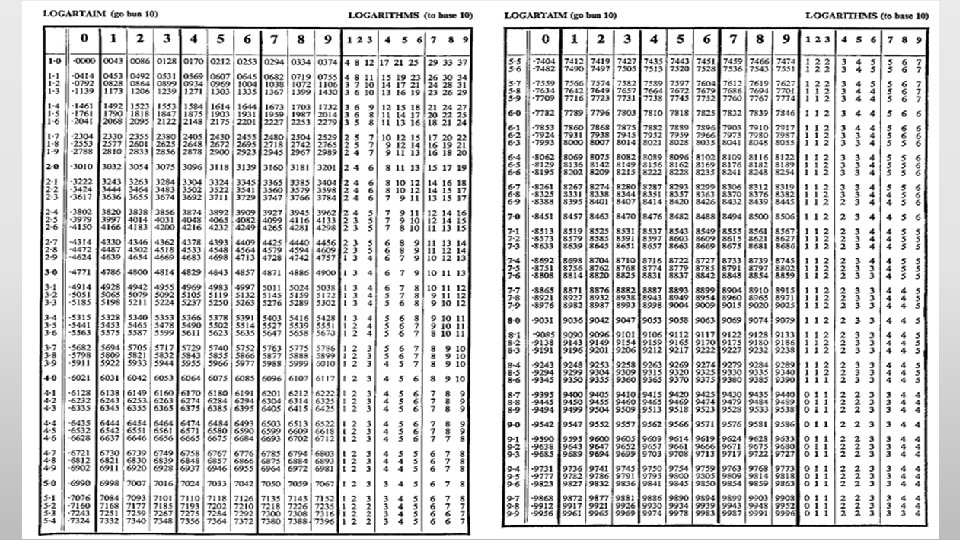
Log Tables And Their Lies Histogram of Error

Log Tables And Their Lies

Histogram of Error of 9000 Logs 1000 900 800 700 600 500 400 300 200 100 0 -1, 0 -0, 9 -0, 8 -0, 7 -0, 6 -0, 5 -0, 4 -0, 3 -0, 2 -0, 1 0, 0 0, 1 0, 2 0, 3 0, 4 0, 5 0, 6 0, 7 0, 8 0, 9 1, 0

Two Sources of Error • Table is rounded to 4 decimal places. • Table rounding, if uniform random, introduces max error of +/- 0. 5 in last digit. • There may be ways to mitigate the rounding error… but no guarantees. • Interpolation is rounded to the same precision as the table. • Table rounding, if random, introduces error of +/- 0. 5 in last digit. • The proportional parts portion of the table is faulty. • Linear interpolation is OK for up to 5 places. • Linear interpolation is easily corrected.

Errors in Tabulated Logs • All of the tabulated logs are correct to four digits. • Error is due to rounding • The rounding error is not uniform. • Chi square test of errors of all 900 tabulated logs • Sequences of 3 errors fail the chi-square test of uniformity in a 4 x 4 x 4 box. • Errors worst at lower end of table • There is an easy way to improve things: average log(x/2), log(x), and log(2 x). • No, you don’t get five places out of a four place table, but you do improve things.

Errors in Tabulated Values 0, 50 0, 00 -0, 50 1, 0 2, 0 3, 0 4, 0 5, 0 6, 0 7, 0 8, 0 9, 0 10, 0

: t o l P r o r r E g Roundin ? ? ? s d n a b e t i h w y t s a n e s o h What are t The white bands are centered around x values of 8. 68, 7. 24, 6. 20, 5. 43, etc ? Those correspond to points where the slope of Log(x) is 0. 05, 0. 06, 0. 07, 0. 08, etc. (The dense areas correspond to slopes of 0. 045, 0. 055, 0. 065, etc. ) These bands contribute to the non-uniformity of the error distribution and partially frustrate attempts to average out tabulation error.

Errors in Tabulated Values: Histogram -0, 48 -0, 44 -0, 40 -0, 36 -0, 32 -0, 28 -0, 24 -0, 20 -0, 16 -0, 12 -0, 08 -0, 04 0, 00 0, 04 Tabulated 0, 08 0, 12 0, 16 0, 20 0, 24 0, 28 0, 32 0, 36 0, 40 0, 44 0, 48

Mitigating Rounding Error in Table Histogram: Last Digit Errors in Tabulated Value Error Statistical Summary Tabulated Averaged 0, 48 0, 44 0, 40 0, 36 0, 32 0, 28 0, 24 0, 20 0, 16 0, 12 0, 08 0, 04 0, 00 -0, 04 -0, 08 -0, 12 -0, 16 -0, 20 -0, 24 -0, 28 -0, 32 -0, 36 -0, 40 -0, 48 -0, 44 Max Min RMS Av. Abs Tabulated 0. 50 -0. 50 0. 29 0. 25 Averaged 0. 33 -0. 36 0. 12 0. 10

More Averaging… If a little averaging is helpful, why not try more averaging? Specifically, a curve fit to a large number of tabulated log values. Disappointing results of this process follow…

1, 00 1, 01 1, 02 1, 03 1, 04 1, 05 1, 06 1, 07 1, 08 1, 09 1, 10 1, 11 1, 12 1, 13 1, 14 1, 15 1, 16 1, 17 1, 18 1, 19 1, 20 1, 21 1, 22 1, 23 1, 24 1, 25 1, 26 1, 27 1, 28 1, 29 1, 30 1, 31 1, 32 1, 33 1, 34 1, 35 1, 36 1, 37 1, 38 1, 39 1, 40 Curve Fitting Fails 0, 500 0, 400 0, 300 0, 200 0, 100 0, 000 -0, 100 -0, 200 -0, 300 -0, 400 -0, 500 Tab Error Curve fit to Log Curve fit to Table

Interpolation Fault Mitigation • The proportional parts in the table are faulty. • Error is worst when the last digit is 9 • So don’t let the last digit go above 5; interpolate down when last digit is above 5. • This results in immediate improvement, uses the same table, and requires nothing more than a teaching change. • Discard the proportional parts and use 0. 4343*d/X • Carry an extra digit to avoid a random error of +/- 0. 5 in the last digit. • Use a slide rule for interpolation for communion with the ages!
 is 0. 4343/x •")
Interpolating Logs Interpolating logs is easy! • Slope of log(x) is 0. 4343/x • Slope at x is too great • Slope at x+d is too small • Between x and x+d is a point b where the slope is just right (mean value theorem in calculus) • So log(x+d) = log(x) +d*f’(b) • This is MUCH easier than lagrange interpolation.
 We start with a number whose log is known exactly:")
Perfect Interpolation Example: Log(11) We start with a number whose log is known exactly: log(10)=1. 0000, and examine different slopes. • Log(11) = Log(10) + (11 -10)*f’(10) = 1. 0000+0. 04343 = 1. 04343 • Log(11) = Log(10) + (11 -10)*f’(11) = 1. 0000+0. 03948 = 1. 03948 • Trying the midpoint as an approximation to the perfect magic point, Log(11) = Log(10) + (11 -10)*f’(10. 5) = 1. 0000+0. 04136 = 1. 04136 error -0. 0000317 not bad! Recommendation: Memorize the following constants: Log(e) = 0. 4343 easy to remember because of the repeat. Of course, more is better. Log(2) = 0. 30103 this is actually good to 8 places. Again, more is better Log(3) = I only know this to 10 places. But 3^8 is close to 2^16/10, so you can… For the log of anything, find a number nearby that has factors of 2, 3, and 5, then extrapolate. For example, to get log(7), note that 7^4 = 2401. Extrapolate from 2400. If you are stuck on a remote island, with a shipload of pencils and paper… and erasers…
- Slides: 14