Locating and Preventing the Dropout Crisis How to


 and counties")


- Slides: 53
Locating and Preventing the Dropout Crisis How to Target and Transform High Schools Which Produce The Nation’s Dropouts Robert Balfanz & Nettie Legters Center for Social Organization of Schools Johns Hopkins University Prepared for the Alliance for Excellent Education March 28, 2007
Dropout Crisis v 1. 2 million students drop out of high school each year v 7, 000/day, 12 million over the next decade v. Half of the nation’s dropouts attended a dropout factory
Where Did All The Freshmen Go? 12 th Graders 11 th Graders 10 th Graders 9 th Graders 197 259 327 484 Number of 9 th Graders in 1996/97 = 669 % Fewer 12 th graders in 1999/2000 than 9 th graders 1996/97 = 71%
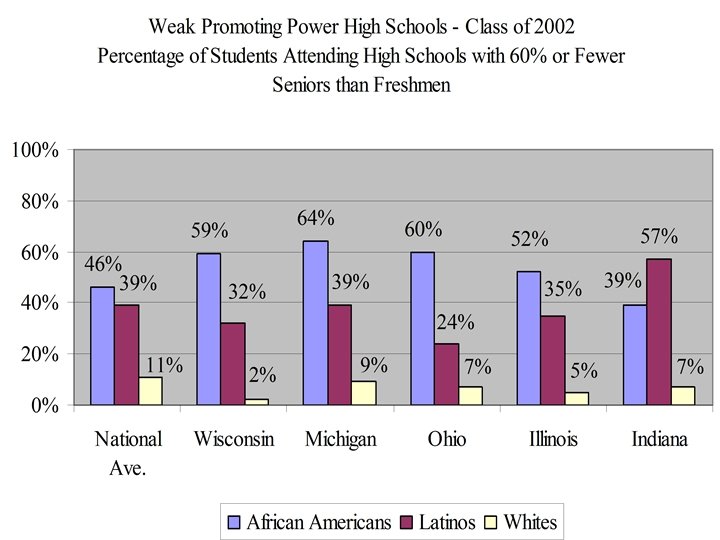
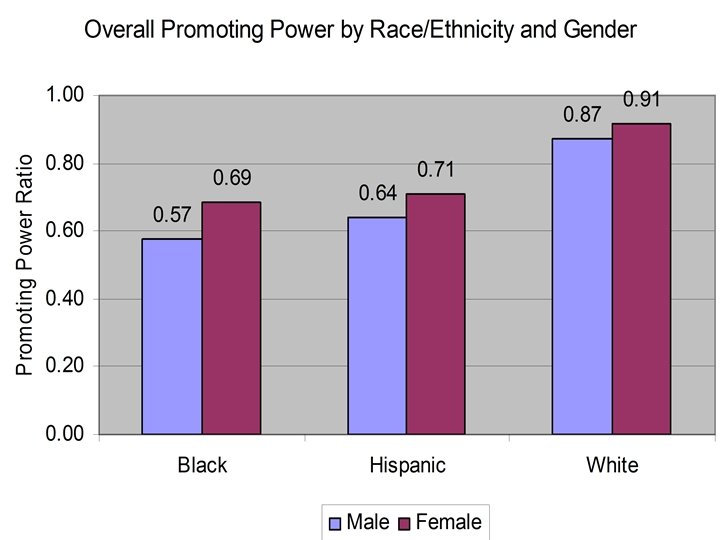
Promoting Power Twelfth grade enrollment Yr X Ninth grade enrollment Yr X-3 v It is not a direct measure of dropout/graduation rates v It is a strong indicator of high schools with low and high graduation rates v It is easily calculable and uses readily available data v We classify High Schools with Promoting Power of 60% or less as Dropout Factories
How Many Dropout Factories Are There?
Where Are The Nation’s Dropout Factories Located? • About Half are Located in Northern, Midwestern and Western Cities • The rest are primarily found throughout the South and Southwest
Counties with 1 or more weak promoting power high schools (gray shading) and counties with 5 or more weak promoting power high schools (black shading), 2003 -04
Top 10 States with the Largest Number of Dropout Factories State Number of Dropout Factories Nationally 1, 827 Florida Texas Georgia New York California South Carolina Michigan North Carolina Ohio Illinois 208 190 131 124 103 91 89 74 70 62 Rank 1 2 3 4 5 6 7 8 9 10
Top 10 States with the Largest Concentration of Dropout Factories State Total Number of High Schools South Carolina Florida Georgia Nevada North Carolina Mississippi Arizona Alaska Hawaii Tennessee 178 416 298 56 315 238 198 63 39 274 Number of Dropout Factories 91 208 131 17 74 55 45 13 8 56 % of High Schools that are Dropout Factories 51% 50% 44% 30% 23% 23% 21% 20% Ran k 1 2 3 4 5 6 7 8 9 10
School Districts with the Largest Number of Dropout Factories
Who Attends Dropout Factories? v Students who live in Poverty v Minority Students
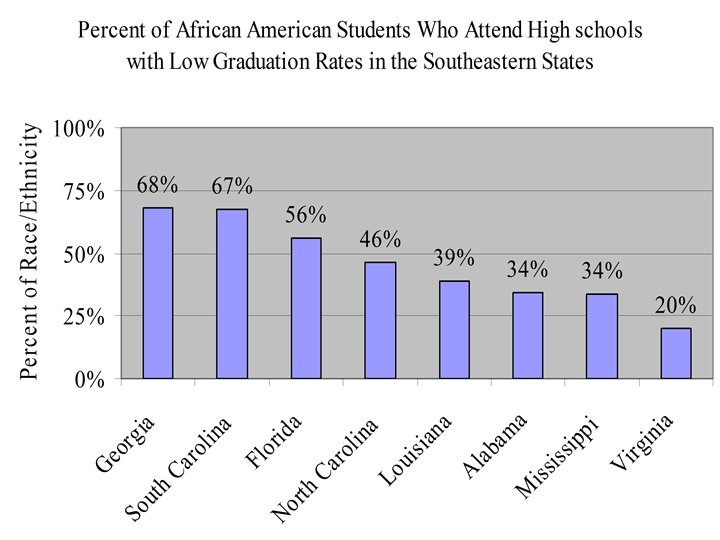
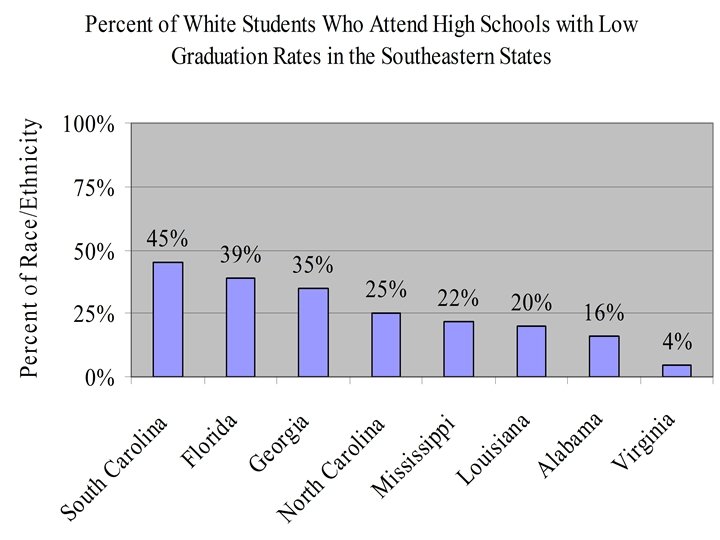
Dropout Factories and Minority Concentration
Percent of Minority Students Attending Dropout Factories
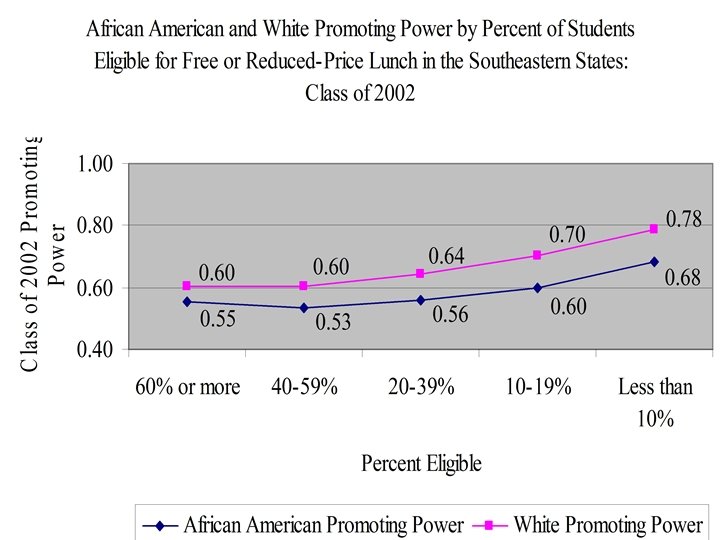
Poverty and Dropout Factories
Concentrated Poverty
What Causes a High School to be a Dropout Factory? • Concentrated Poverty is the key driver • But Controlling for Poverty, Minority Concentration, School Size, Student-Teacher Ratio, and Urban Location also play roles.
The Greatest Proximate Cause is that there is a fundamental Miss-Match between the Number of Students in Need of Academic and Social Supports in a High School and the Human Resources and Know How Available to Help
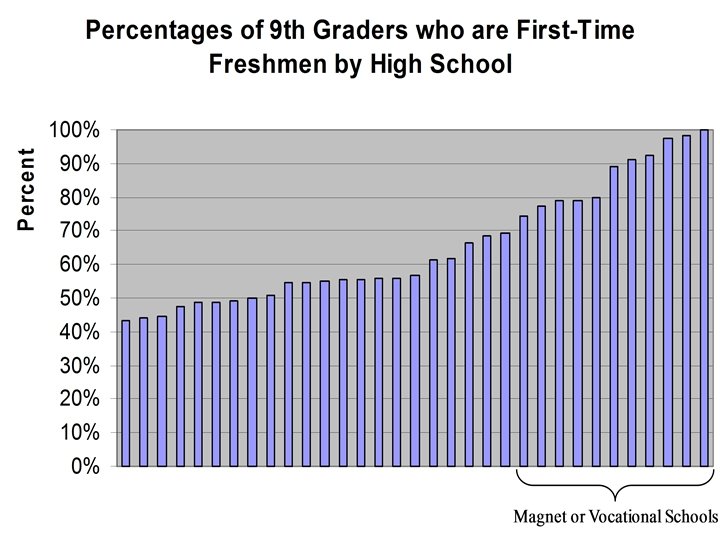
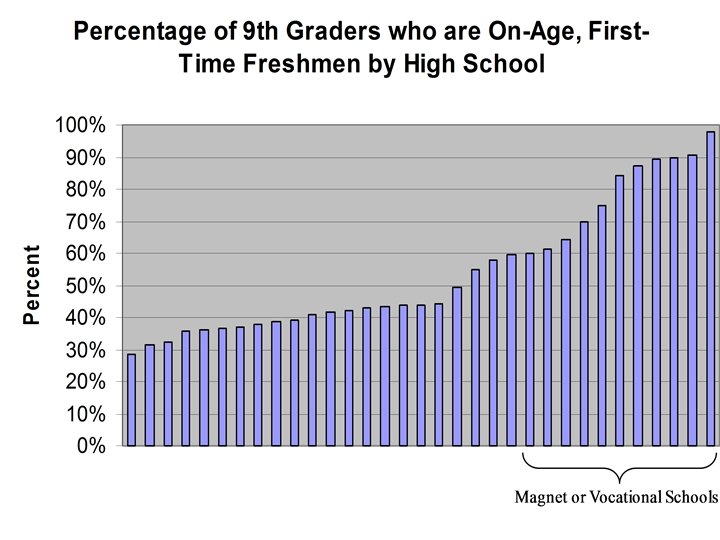
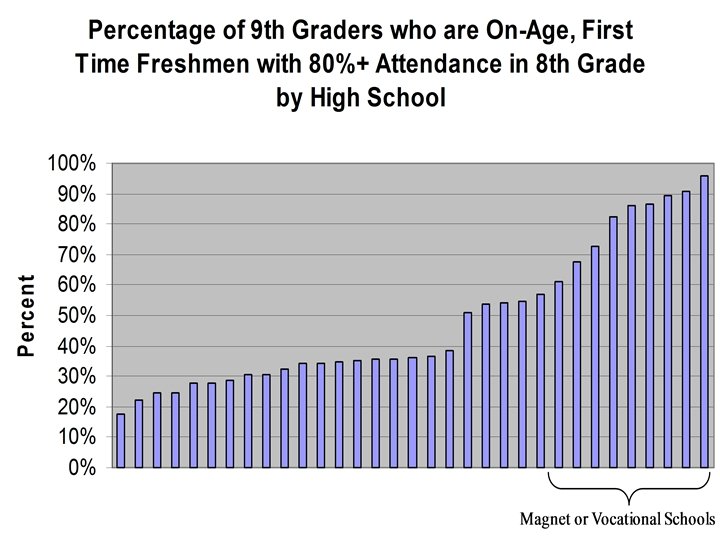
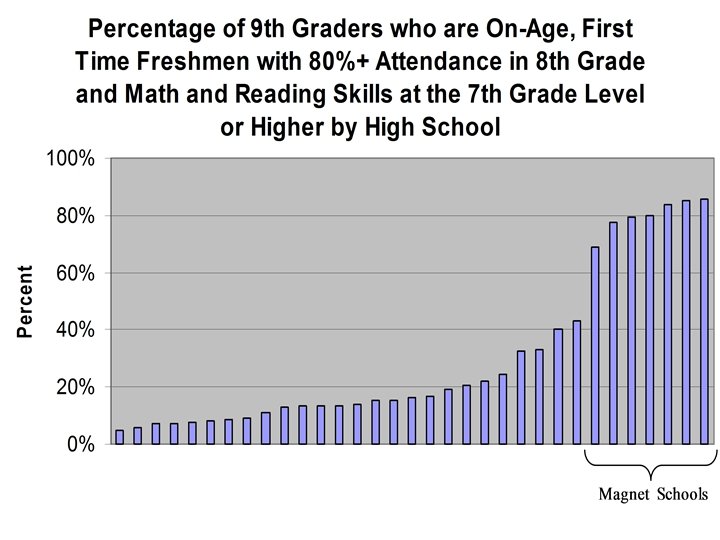
The Educational Challenge Faced by Dropout Factories • Philadelphia Case Study-High Poverty Neighborhood High Schools vs Selective Admission Magnets
Targeting Resources and Know How to End the Dropout Crisis • Case Study-African American Males
Which High Schools Do African American Males Dropout From? • 80% of African Americans are attend Public High School in 16 states • In these 16 states there are roughly 2400 high schools where the promoting power for African American Males is less than 65%
Cont. • These 2400 High School produce 90% of the African American Male Dropouts in the 16 states are about 75% of the nation’s African American Male Dropouts
Cont. • About Half are Dropout Factories • The Other Half are Grad Gap Schools • The Number of High Schools per state ranges from 65 in New Jersey to 266 in Texas
This is a Solvable Number It is within our Capacity to Transform the Nation’s Dropout Factories and Grad Gap High Schools In So Doing we can Transform the Nation
The Consequences of Under-Education v A new high school dropout in 2000 had less than a 50% chance of getting a job v That job earned less than ½ of what the same job earned 20 years ago v Lack of education is ever more strongly correlated with welfare dependency and incarceration v Some U. S. jobs cannot be filled by U. S. trained skilled employees
Benefits > Costs v. A recent study finds that our nation can recoup 45 billion dollars in lost tax revenues, health care expenditures, and social service outlays if we cut the number of high school dropouts in half (Levin et. al, 2007).
Failure to Succeed v Enter High School with Below Grade Level Skills or Poor Attendance Habits or struggle with the transition to high school v Miss 20 or more days of the 9 th grade, sometimes 10 of the first 30 days v Fail Two or More and often Nearly All of their 1 st Semester Courses. v Do Not Earn Enough Credits to be Promoted to the 10 th Grade v Repeat 9 th Grade, Fail Again v Eventually Dropout, Perhaps after a Brief Transfer to another school
Failure to Succeed Dropouts v. Are Easily Identifiable Using Data Routinely Collected by Schools v. Can be Identified a Key Junctures of Secondary School When Their Odds for Success are About to Take a Turn for the Worse v. Often Persist in School for a Long Time before Dropping Out, Despite Years of Struggles
Chicago On-Track Indicator v. Earn 5 Credits in 9 th Grade v. Have no More than one semester F in a core course v. On Track Students 3. 5 Times more likely to Graduate v. Better Predictor than Test Scores or background characteristics v. Some Students with High Test Scores Fall off Track in 9 th Grade, Some Students with Low Test Scores stay on Track v 9 th Grade Experience is Key
Philadelphia 8 th Grade Indicators v 8 th Graders who Attend less than 80% of the Time and/or Fail Math and/or Fail English make up 54% of Dropouts v. Students Who Do Not Have 8 th Grade Indicators but have to Repeat 9 th Grade make up 22% of Dropouts v. Only 23% of Dropouts Do Not Have a 8 th Grade or 9 th Grade Indicator
Effective Intervention and Prevention Follow the Public Health Model
Comprehensive Prevention Model Type of Intervention Portion of Failure to Succeed Students Addressed Resource Needs School-wide Preventative 65 -75% Maybe able to Re-Organizes Existing resources Targeted 15 -25% Additional Resources Typically Needed Intensive 5 -10% Partners with Resources Needed
Talent Development High Schools Reform Components v School Organization – Ninth Grade Academy, Teams, Career Academies, Block Schedule v Curriculum/Instruction – – Double & Triple Dose Active Instruction Freshman Seminar Integrated Career Themes v Staff Support – Leadership – Planning & Coaching
We Now Know That… v Sustained implementation of a strong, comprehensive intervention at the high school level, with particular emphasis in the ninth grade, results in improvements in: v v v v Climate Attendance Achievement Course Passing Grade Promotion Career/College Ready Graduation
MDRC Evaluation Using an unusually rigorous research method, MDRC studied the impact of Talent Development across five high schools in Philadelphia over a five-year period. MDRC’s analysis compared gains in student engagement, achievement, and attainment in the Talent Development high schools to a set of match control schools in the same district. Their study found that: v “Talent Development produced substantial gains in attendance, academic course credits earned (particularly in algebra), and promotion rates during students’ first year of high school. ” p. ES-1 v “The improvements in credits earned and promotion rates for ninth-graders were sustained as students moved through high school. ” p. ES-1 v “The pattern of results in this report stands out from other research on high school reforms because the impacts are consistently positive across several outcomes, they emerged in the first year of implementation, they are sustained for successive cohorts of students, and they were found across five high schools, ”
Good News v Manageable number of schools and we can locate the bulk of the work v Converging discourse on what needs to be done v Increasing level of know how v Leadership and support
Challenges Transforming low performing high schools and systems is not easy, fast, or cheap
Not Easy v Need comprehensive and systemic approach to avoid isolated efforts that exacerbate inequity v Consider multiple approaches as appropriate to context v Develop and scale-up technical and human supports for transformation v Align federal, state, district, and school-based efforts
Not Fast “The trick is how to sustain interest in a reform that requires a generation to complete. ” Debbie Meyer NCLB & States must acknowledge reality and progress using multiple indicators
Not Cheap v Continue and expand public and private funding v Institutionalize targeted resources – Title I – Perkins – Dedicated Fund for Low Performing High Schools
Coming Soon… v. Bingaman $2. 5 Billion High School Reform/Dropout Reduction Bill