LO To understand what Spearmans rank is and


 § You want")


 § For H 1, you")


 Unit 2 Jan 2011")

- Slides: 17
LO: To understand what Spearman’s rank is and know how to apply that knowledge to exam questions. Success criteria: Explain what spearman’s rank is. Explain the steps of spearman’s rank. Complete questions on spearman’s rank.
What does N stand for? What is this table? What is this? Why do we need this table?
§ Statistical test that measures rank correlation. § Whether highest value in the 1 st data set corresponds to highest in the 2 nd set. § Takes a values between -1 and 1.
§ You have at least 5 data pairs (more is better) § You want to use rank correlation rather than straight line correlation § – if your data are close to a straight line, Pearson’s may be better § You want to use Spearman’s rather than Kendall’s. If do not have a lot of ties between your ranks. § Kendall’s is better when you have a lot of ties in your ranks.
§ You assume there is no correlation. Null hypothesis. § The test involves ranking the data (rank 1 for highest value, rank 2 for 2 nd highest etc) and looking at the differences between ranks. § If the two sets of ranks tend to agree – it’s positive correlation § If the two sets of ranks tend to disagree -it’s negative correlation
§ 1. Write down your hypothesis § 2. Work out the ranks § 3. Do the calculations to get a value for correlation § 4. Look at the critical values table § 5. Make a decision
§ H 0: r= 0 (there is no correlation) § For H 1, you have a choice, depending on what alternative you were looking for. § H 1: r > 0 (positive correlation) § or H 1: r < 0 (negative correlation) § or H 0: r 0 (some correlation) § If you have a good geographical reason for expecting a particular kind of correlation, use one of the first two. If not, use the r 0
§ You’ll have two sets of data § Eg sizes of shopping centre and average distance travelled to reach it § You rank each set of data separately, giving 1 to the largest value, 2 to the 2 nd largest, 3 to the 3 rd largest etc § Eg you’d rank all the shopping centres, giving rank 1 to the largest. Then you’d rank all the average distances travelled, giving rank 1 to the longest distance. § If you have any ties, you give them the average of the ranks they would have had otherwise § Eg if two centres tied for 3 rd place, they would otherwise have used up ranks 3 and 4. So you give them the average of 3 and 4 =3. 5
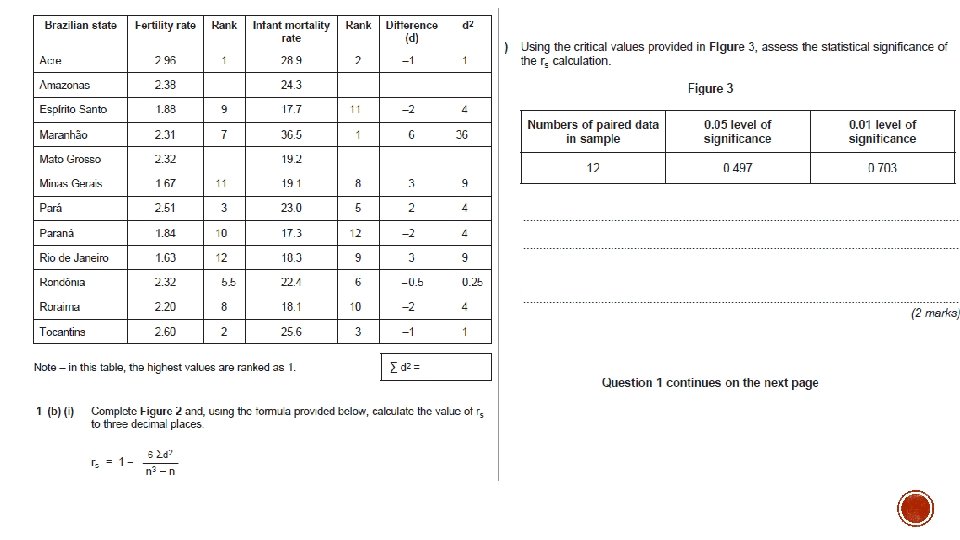
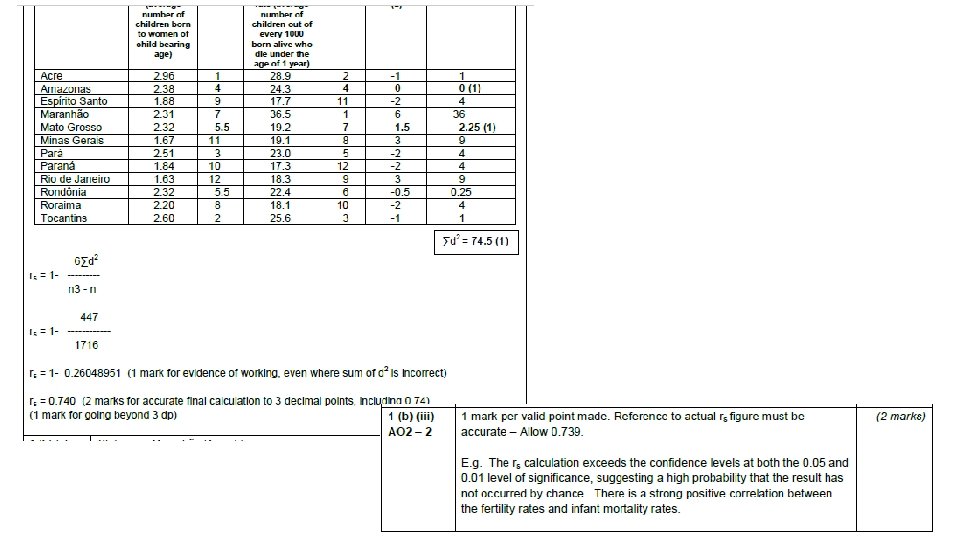
§ After you have ranked them all you need to work out the difference between the ranks (d- values ) and then square the d- values. § Add all the squared d values up and this gives you ∑d 2 § The using the following formula you obtain a value. N is the number of sample points you have.
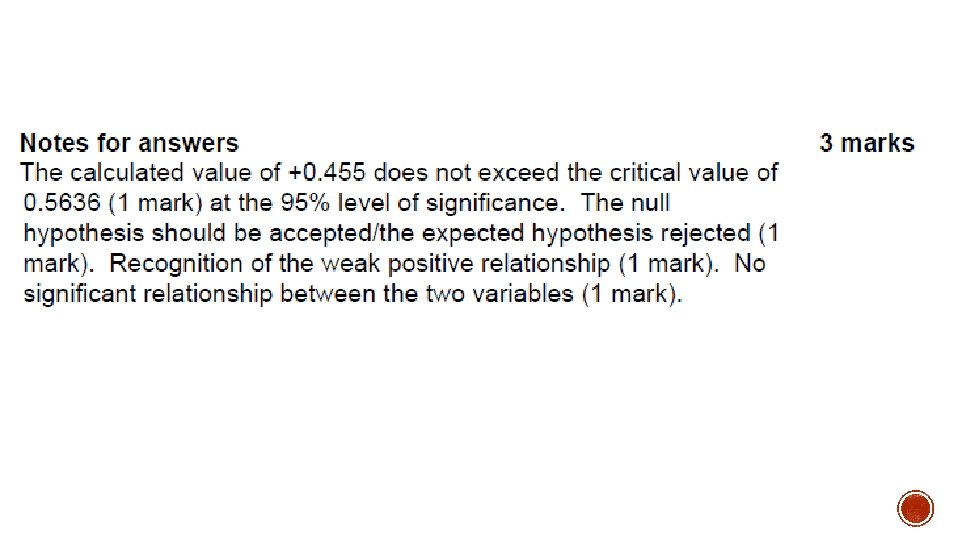
These are called significance levels 0. 05 is 95% significance level meaning 95 out of 100 times you would get the same result. You then compare your value to the values on the table. This is called a critical values table and will allow you to accept or reject your hypothesis. 1 tailed – where you are only looking at one hypothesis (p=1 or p=-1 If it is above the value then you accept your hypothesis. 2 -tailed is where you are looking at both.
§ 1. Calculate d 2 value § 2. Rank IV values § 3. Calculate the difference between IV and DV ranks § 4. Rank the DV values § 5. Calculate sum of 6 d 2 § 6. Compare value to critical values table. § 7. Reject or accept hypothesis § 8. Complete formula
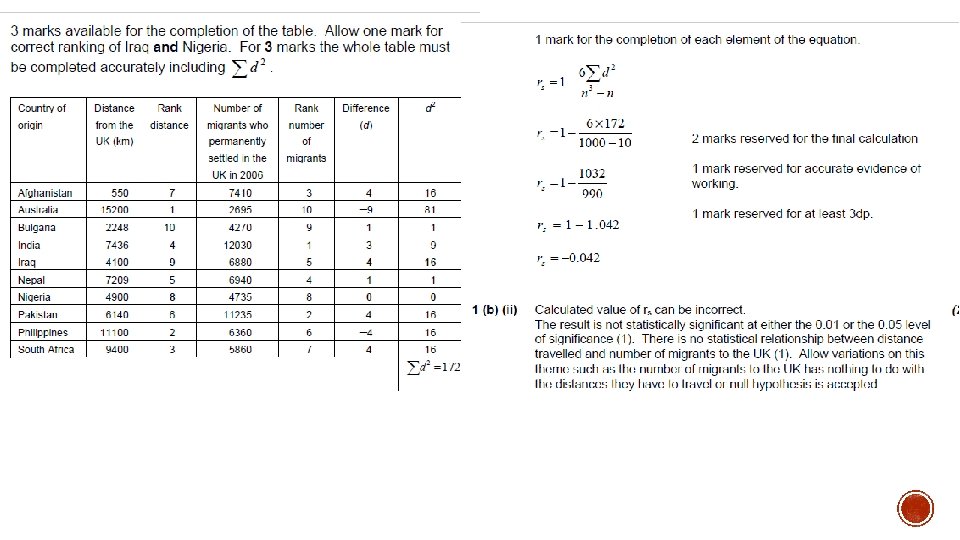
2 marks 6 marks ) Unit 2 Jan 2011
Unit 4 a 2007