Livestock and meat industry Per capita consumption Demand


- Slides: 30
Livestock and meat industry • • Per capita consumption Demand measures Trends Industry segments and structure • Think of implication for supply and demand? ? ?
Livestock & Poultry Markets 2009 Billion lbs 1 lbs 2 Broilers 35. 2 Beef 26. 0 61. 6 Pork 23. 0 50. 8 Turkeys 5. 6 Lamb. 17 1/ Per Cap Price. Exp $/cwt %3 %3 80. 0 77. 59 16. 0 83. 16 7. 0 10. 6 40. 82 19. 3 0. 1 17. 0 79. 72 9. 3. 97 100. 91 8. 8 Billion pounds of US production 2/ Pounds consumed person per year 3/ As a percent of production Imp 0. 2 95. 3
Livestock Marketing Information Center
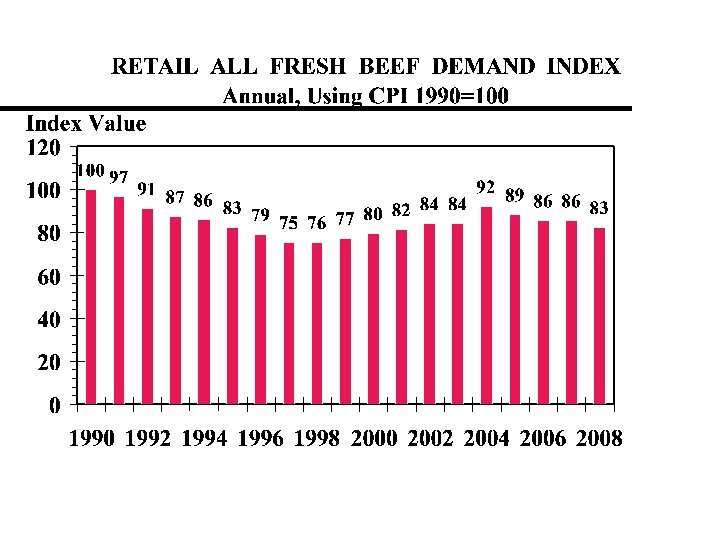
Measuring consumption • Balance sheet approach Beginning inventories + Production + Imports - Exports - Ending inventory = Disappearance • Per Capita consumption = Disappearance Population • A measure of supply rather than demand
Livestock Marketing Information Center
Livestock Marketing Information Center Data Source: USDA/NASS
Livestock Marketing Information Center
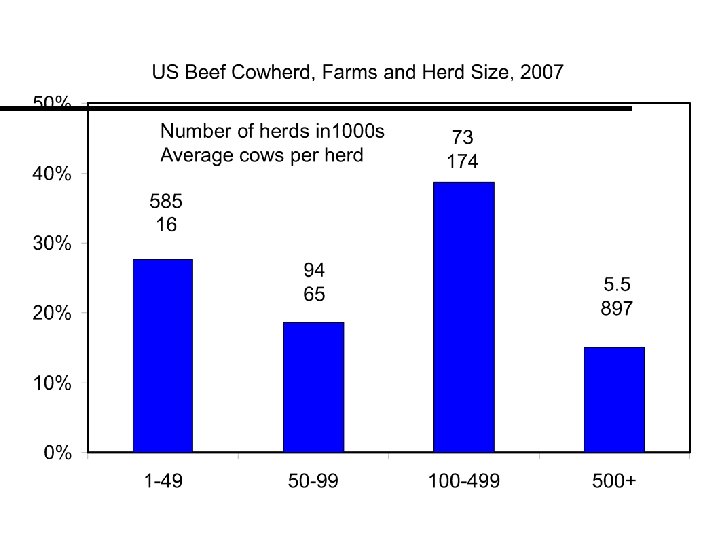
US Beef Cattle Sector Packers: 33. 7 million slaughter and 4 = 73% Feedlots: 26. 2 million marketings, 260 = 60% Backgrounders Beef Cows: 32. 5 million cows in 758, 000 herds
One time capacity
Estimated Beef Packer Capacity Rank Company Head/Day Share 1 Cargill Meat Solutions 29, 000 21. 2% 2 Tyson Foods 28, 700 21. 0% 3 JBS Swift 28, 600 20. 9% 4 National Beef Packing 14, 000 10. 2% 5 American Foods Group 7, 000 4. 7% 6 Greater Omaha Packing 2, 900 2. 0% 7 Nebraska Beef 2, 600 1. 9% 8 -13 10, 100 7. 4% Smaller 14, 605 10. 7% Total 136, 855 Source: CME DLR
US Hog Operations and Inventory by Size Based on Ownership of Hogs, 2007 Invent ory Opera tions <500 4 2, 72 8, 760 7, 080 56 500999 10001999 20004999 50009999 2, 840 2, 18 1, 664 768 1, 860 3, 27 2, 496 1, 759 1, 600 6, 13 5, 930 3, 835 670 5, 45 4, 160 8, 141 1000019999 340 20000 - Invent Hogs/O ory peration 5, 45 4, 160 16, 042 6, 13
Commercial Hog Slaughter Companies Compan y 20 2002 03 20 04 20 05 20 06 20 07 20 08 Smithfiel d 22. 26. 25. 26. 28. 19. 9 5 1 1 5 4 3 Tyson JBS USA 18. 17. 17. 18. 0 0 5 9 4 6 6 11. 10. 10. 11. 10. 7 5 8 8 9 1 8 Cargill 8. 5 9. 2 8. 9 9. 0 8. 7 8. 5 Hormel 7. 0 6. 9 7. 0 8. 4 8. 7 8. 2 TOP 5 64. 68. 71. 69. 71. 74. 73. 1 1 3 8 9 3 4
Percent of U. S. Hogs Sold Through Various Pricing Arrangements, January 1999 -2009* Year 99 00 01 02 03 04 05 06 07 08 09 Hog or meat market formula 44. 2 47. 2 54 44. 5 41. 4 39. 9 41. 8 38. 3 37. 1 41. 2 Other market formula 3. 4 8. 5 5. 7 11. 8 5. 7 7. 2 10. 3 8. 8 8. 5 11. 0 7. 9 Other purchase arrangement 14. 4 16. 9 22. 8 8. 6 19. 2 20. 6 15. 4 16. 6 15. 2 13. 4 11. 6 Packer-sold 2. 1 2. 2 2. 1 2. 4 2. 6 6. 7 6. 1 5. 6 Packerowned 16. 4 18. 1 17. 1 21. 4 20 22. 7 23. 1 25. 7 16. 7 13. 5 11. 6 10. 2 8. 6 9. 2 8. 1 Negotiated spot 35. 8 25. 7 17. 3 Source; Grimes and Plain, University of Missouri http: //agebb. missouri. edu/mkt/vertstud 09. htm
8 3715 68 40 133 295 673 1347
Top 10 Milk Cooperatives, 2008
Million