LIVE OAK ELEMENTARY APRIL 2018 INTENDED AUDIENCE LIVE


 Developing Learners (Level 2) Proficient Learners (Level 3)")


- Slides: 22
LIVE OAK ELEMENTARY APRIL 2018 INTENDED AUDIENCE: LIVE OAK TEACHERS AND ADMINISTRATORS Data Overview PRESENTED BY NATASHA BLADES
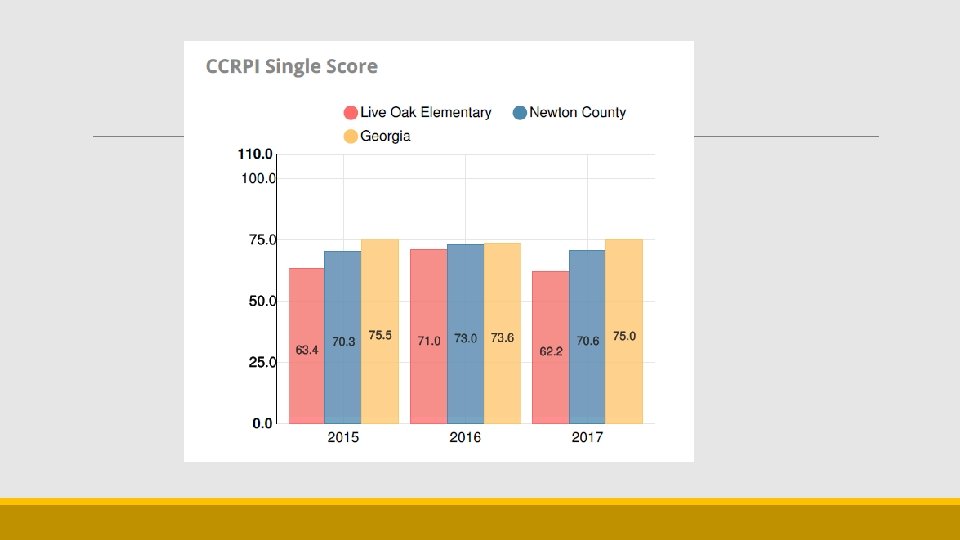
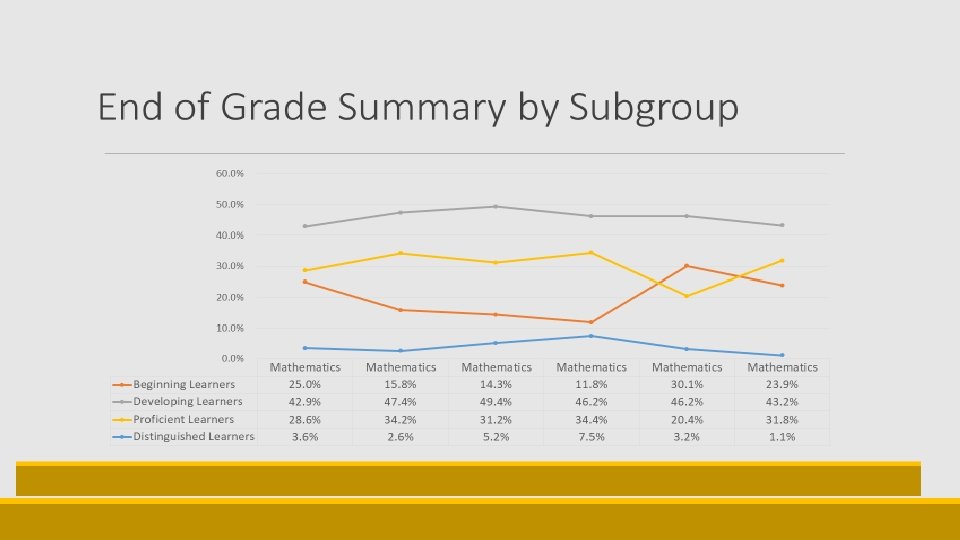
Purpose To review the demographics and student achievement from 20152017 To summary of student achievement for 3 rd grade students compared to the county and state To examine subgroups over three years To highlighting strengths and weaknesses of students on the Georgia Milestones in English Language Arts and Mathematics To identify key areas in which academic improvement is needed most
QUESTIONS TO CONSIDER WHILE REVIEWING THE DATA Where are students performing in relations to the county and state? Are all students receiving equitable access to the curriculum? What factors are within the control of teachers to affect change in the classroom? How can the teachers use formative data to evaluate progress on an ongoing basis?
Live Oak Elementary Student Enrollment by Race/Ethnicity Enrollment Year 2017 2016 Number of students 2015 0 Caucasion 100 2015 200 45 300 400 500 2016 600 39 700 800 2017 900 39 1000 1100
LOES Student’s Population Growth 570 550 530 510 490 470 450 2015 2016 2017 Boys Girls
Student Economic Status 120 100 16 18 84 82 2015 2016 12 80 60 40 88 20 0 Free/Reduced Lunch 2017 Non FRL
Student Enrollment by Programs 25, 0% 20, 0% 15, 0% 10, 0% 5, 0% 0, 0% Early Intervention English to Speakers of Program (EIP) (Grades K- Other Languages (ESOL) 5) (Grades K-12) Special Education (Grades K-12) 2017 Special Education (PK) 2016 2015 Alternative Programs (Grades K-12) Gifted (Grades K-12)
LOES Student Attendance 70, 0% 60, 0% Percentage of Absences 50, 0% 40, 0% 30, 0% 20, 0% 10, 0% Number of Students 5 or Fewer Days Absent (%) 6 to 15 Days Absent (%) More Than 15 Days Absent (%)
LOES Faculty 30 25 20 15 10 5 0 4 Yr Bachelor's 5 Yr Master's Administrators 6 Yr Specialist's PK-12 Teachers Support Personnel 7 Yr Doctoral
Years Experience 35 30 25 20 Support Personnel Pre. K-5 th Grade Teachers 15 Adminstrators 10 N=75 5 0 <1 1 -10 11 -20 21 -30 Years Experience > 30
Data Sources CCRPI is a comprehensive school improvement, accountability, and communication platform for all educational stakeholders that will promote college and career readiness for all Georgia public school students. Georgia Milestones Assessment- Criterion. Referenced Test A criterion-referenced test is designed to provide information about how well a student has mastered the state adopted content standards within a grade level and content area IOWA The Iowa Tests (ITBS) are nationally normed standardized tests offering educators a diagnostic look at how students are progressing in key academic areas.
Achievement Levels Beginning Learners (Level 1) Developing Learners (Level 2) Proficient Learners (Level 3) Distinguished Learners (Level 4) Content Area Grade Level 1: Beginning Learner Level 2: Developing Learner Level 3: Proficient Learner Level 4: Distinguished Learner ELA Grade 3 180 to 474 475 to 524 525 to 580 581 to 330 Content Area Grade Level 1: Beginning Learner Level 2: Developing Learner Level 3: Proficient Learner Level 4: Distinguished Learner Math Grade 3 290 to 474 475 to 524 525 to 579 580 to 705
Live Oak’s Student Performance Summary 100% 90% 80% 70% 60% 50% 40% 30% 20% 10% 0% English Language Arts N=161 Mathematics N=160 English Language Arts N=170 2016 -17 Mathematics N=170 English Language Arts N=178 2015 -16 Beginning Learners Developing Learners Proficient Learners 2014 -15 Distinguished Learners Mathematics N=181
LOES Students Performance Summary by Subgroup Beginning Learners Developing Learners Proficient Learners Distinguished Learners English Language Arts 23, 5% 41, 2% 29, 4% 5, 9% English Language Arts 14, 5% 38, 2% 9, 2% Beginning Learners English Language Arts 32, 5% 42, 9% 19, 5% 5, 2% Developing Learners English Language Arts 19, 4% 37, 6% 34, 4% 8, 6% Proficient Learners English Language Arts 40, 7% 33, 0% 22, 0% 4, 4% Distinguished Learners English Language Arts 20, 7% 39, 1% 29, 9% 10, 3%
Newton County's Student Performance by Subgroup 100% 90% 80% 70% 60% 50% 40% 30% 20% 10% 0% English Language Arts N=777 Mathematics N=774 English Language Arts N=719 Male Mathematics N=718 English Language Arts N=751 Female Mathematics N=751 English Language Arts N=740 Male Mathematics N=741 English Language Arts N=759 Female Mathematics N=760 English Language Arts N=768 Male Female Gender 2016 -17 2015 -16 2014 -15 Beginning Learners Developing Learners Proficient Learners Distinguished Learners Mathematics N=769
Georgia's Student Performance Summary by Subgroup 100% 90% 80% 70% 60% 50% 40% 30% 20% 10% 0% English Language Arts N=69, 828 Mathematics N=70, 048 English Language Arts N=66, 412 Male Mathematics N=66, 624 English Language Arts N=68, 969 Female Mathematics N=69, 184 English Language Arts N=66, 704 Male Mathematics N=66, 949 English Language Arts N=67. 217 Female Mathematics N=67, 632 English Language Arts N=64, 541 Male Female Gender 2016 -17 2015 -16 2014 -15 Beginning Learners Developing Learners Proficient Learners Distinguished Learners Mathematics N=64, 847
100 IOWA - Math - % Students with NPR > 25 IOWA - ELA - % Students with NPR > 25 90 80 68 70 60 73 69 74 6260 63 6770 100 6568 50 90 80 77 70 40 82 72 74 69 60 73 70 76 62 66 51 30 50 20 40 0 30 Ki n de rg ar te n 1 s t. G ra de 2 n d Gr ad e 3 r d Gr ad e 4 t h Gr ad e 5 t h Gr ad e 10 20 10 0 Fall Spring Kindergarten 1 st Grade 2 nd Grade Fall 3 rd Grade Spring 4 th Grade 5 th Grade
Live Oak Elementary Grows Equity instruction for both boys and girls Professional Development for ELA to decrease level one scores to on the low scoring domains Find ways to improve CCRPI score by evaluation staff retention
Live Oak Glows ØBoth girls and boys have made growth on ELA. ØStudent outperformed the state and county on having student at or above grade level in 2017 ØImplementation new program to support student growth.