
Liquids Solids Chapter 11 Characteristic Properties of Gases
- Slides: 93
Liquids & Solids Chapter 11
Characteristic Properties of Gases, Liquids, and Solids o o Intermolecular forces are forces that exist between molecules Intramolecular forces are forces that hold atoms together within molecules Note that gases generally have weak intermolecular forces and considerable amounts of empty space between molecules Liquids & solids have much stronger intermolecular forces and are condensed states. Matter occupies a very large fraction of sample volume in both liquids and solids.
Characteristic Properties of Gases, Liquids, and Solids o What happens when water evaporates? n n Which bonds remain intact? Which bonds are broken?
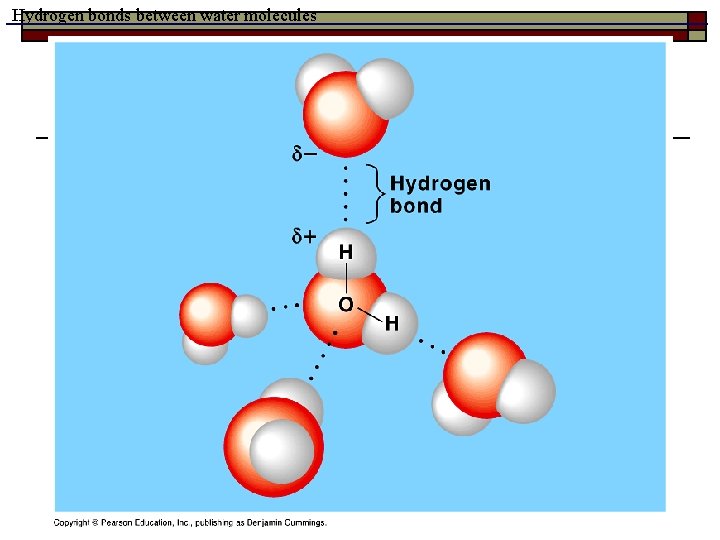
Hydrogen bonds between water molecules
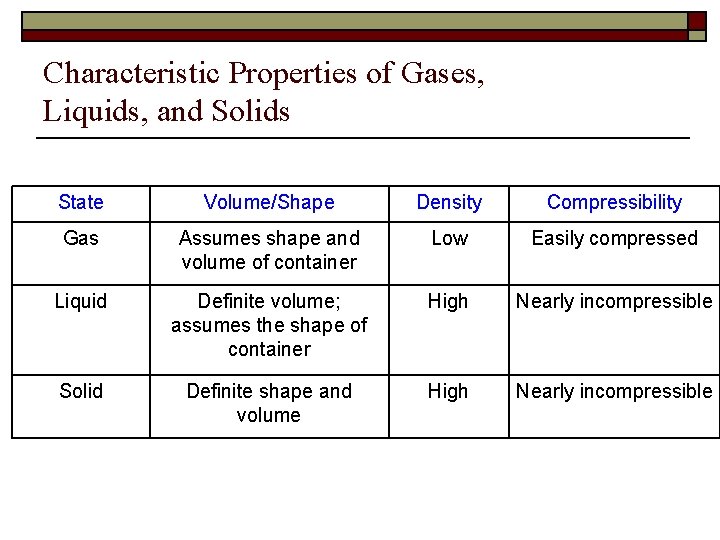
Characteristic Properties of Gases, Liquids, and Solids State Volume/Shape Density Compressibility Gas Assumes shape and volume of container Low Easily compressed Liquid Definite volume; assumes the shape of container High Nearly incompressible Solid Definite shape and volume High Nearly incompressible
11. 1 Kinetic Molecular Theory and Intermolecular Forces Objectives o To relate the physical state of a substance to the strength of intermolecular forces
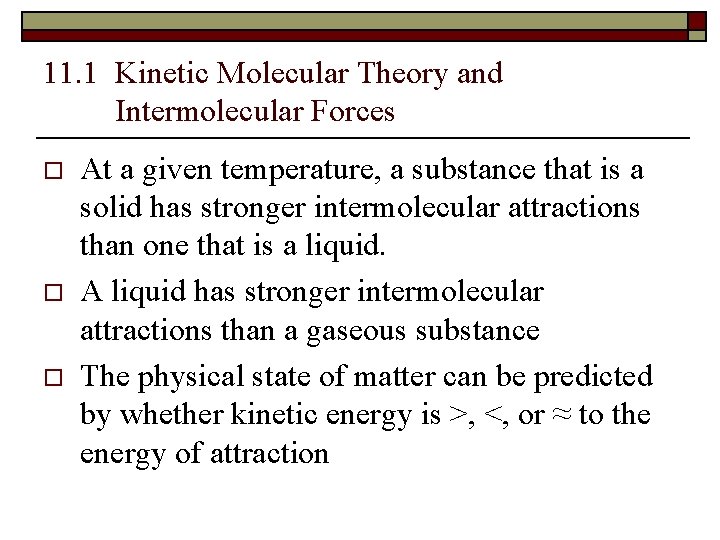
11. 1 Kinetic Molecular Theory and Intermolecular Forces o o o At a given temperature, a substance that is a solid has stronger intermolecular attractions than one that is a liquid. A liquid has stronger intermolecular attractions than a gaseous substance The physical state of matter can be predicted by whether kinetic energy is >, <, or ≈ to the energy of attraction
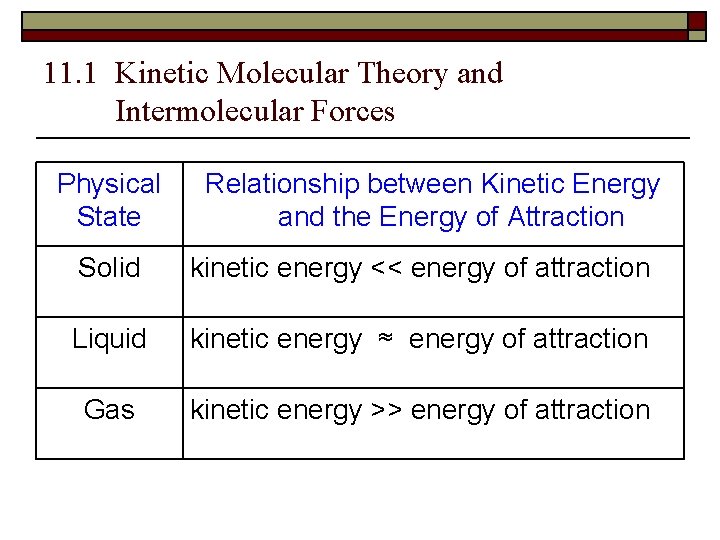
11. 1 Kinetic Molecular Theory and Intermolecular Forces Physical State Relationship between Kinetic Energy and the Energy of Attraction Solid kinetic energy << energy of attraction Liquid kinetic energy ≈ energy of attraction Gas kinetic energy >> energy of attraction
11. 1 Kinetic Molecular Theory and Intermolecular Forces o At room temperature, chlorine is a gas, bromine is a liquid, and iodine is a solid. n n Arrange three substances in order of increasing strength of intermolecular attractions. Cl 2 < Br 2 < I 2
11. 2 Phase Changes Objectives o o o To describe phase changes as equilibrium processes To relate the enthalpy of phase changes and the critical temperature to the relative strengths of the intermolecular forces To describe the heating curves and their relation to the heat capacities and enthalpies of phase transitions
11. 2 Phase Changes o o Most substances can exist in all three states of matter depending on conditions of temperature and pressure A dynamic equilibrium often exists between states n Two opposing changes occur at equal rates with no net change being apparent
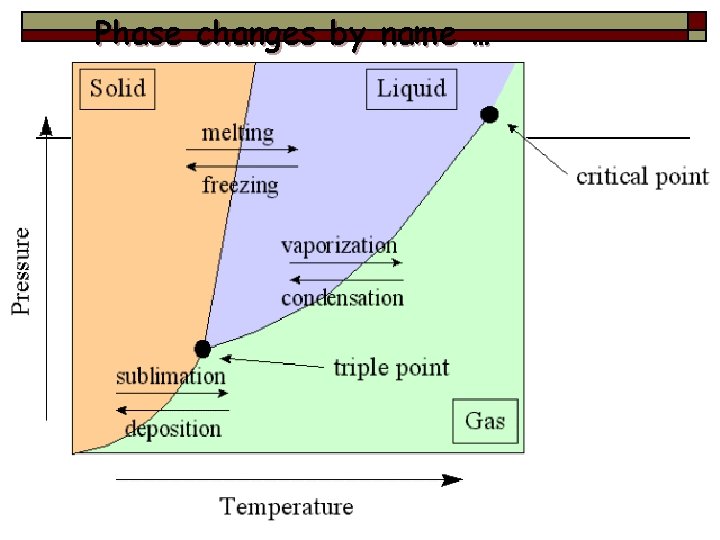
Phase changes by name …
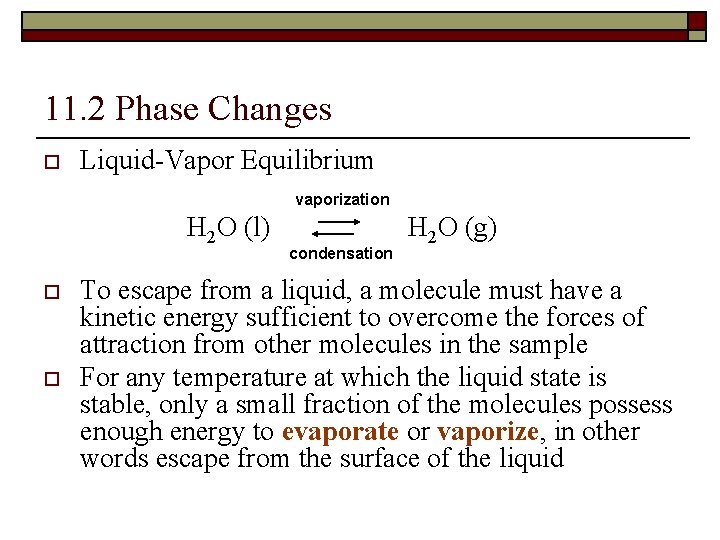
11. 2 Phase Changes o Liquid-Vapor Equilibrium vaporization H 2 O (l) o o condensation H 2 O (g) To escape from a liquid, a molecule must have a kinetic energy sufficient to overcome the forces of attraction from other molecules in the sample For any temperature at which the liquid state is stable, only a small fraction of the molecules possess enough energy to evaporate or vaporize, in other words escape from the surface of the liquid
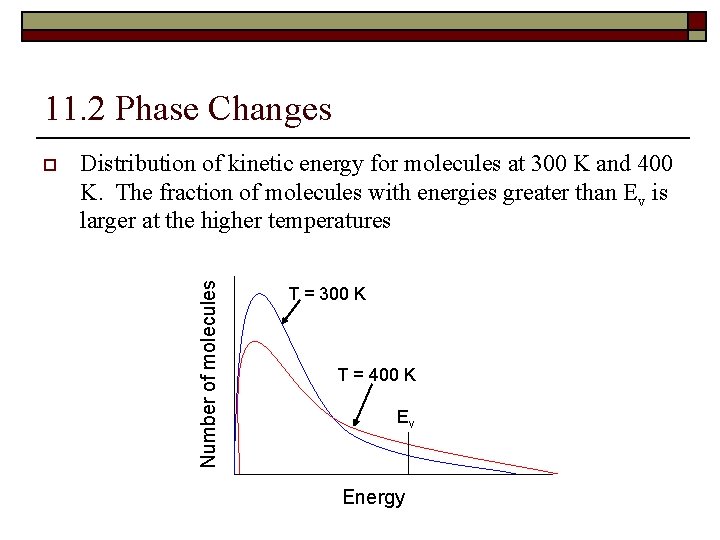
11. 2 Phase Changes Distribution of kinetic energy for molecules at 300 K and 400 K. The fraction of molecules with energies greater than Ev is larger at the higher temperatures Number of molecules o T = 300 K T = 400 K Ev Energy
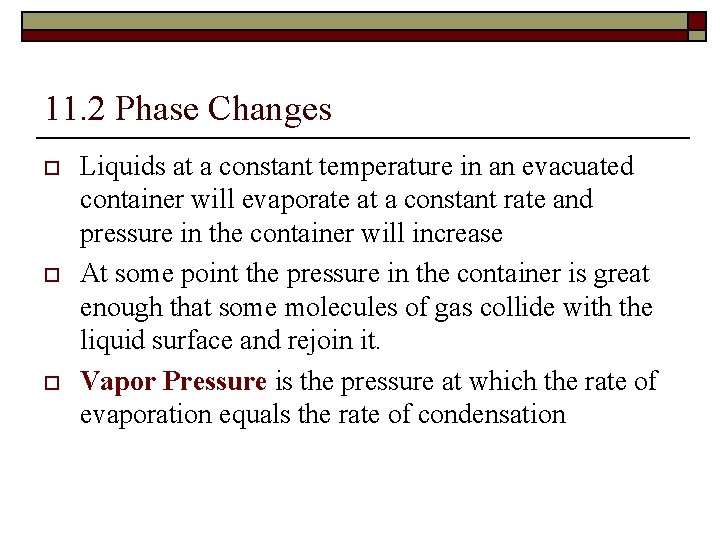
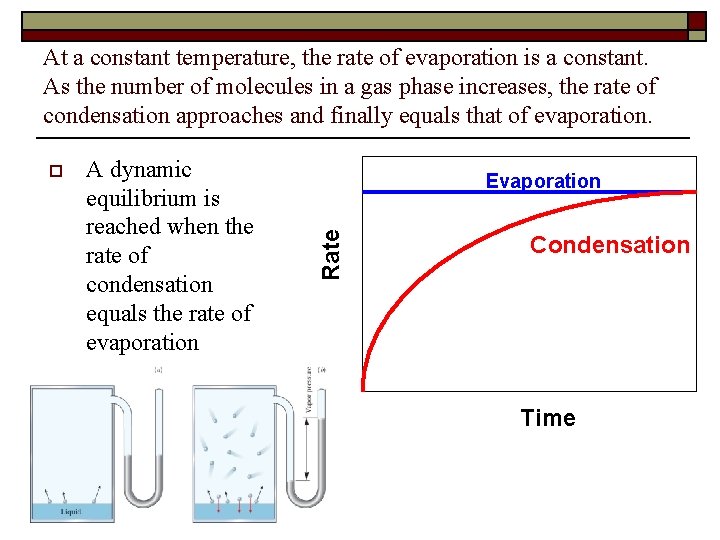
11. 2 Phase Changes o o o Liquids at a constant temperature in an evacuated container will evaporate at a constant rate and pressure in the container will increase At some point the pressure in the container is great enough that some molecules of gas collide with the liquid surface and rejoin it. Vapor Pressure is the pressure at which the rate of evaporation equals the rate of condensation
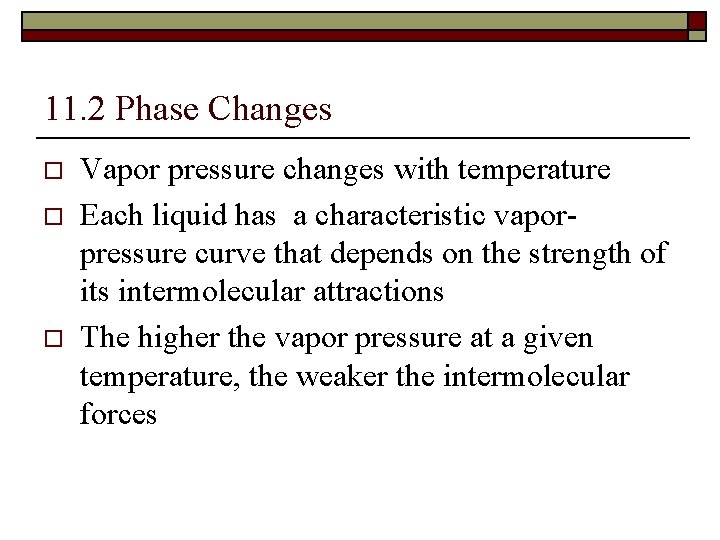
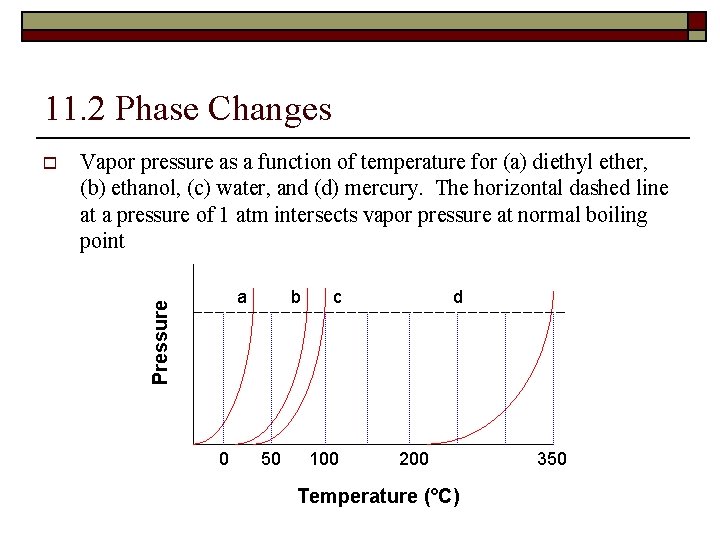
11. 2 Phase Changes o o o Vapor pressure changes with temperature Each liquid has a characteristic vaporpressure curve that depends on the strength of its intermolecular attractions The higher the vapor pressure at a given temperature, the weaker the intermolecular forces
At a constant temperature, the rate of evaporation is a constant. As the number of molecules in a gas phase increases, the rate of condensation approaches and finally equals that of evaporation. A dynamic equilibrium is reached when the rate of condensation equals the rate of evaporation Evaporation Rate o Condensation Time
11. 2 Phase Changes Vapor pressure as a function of temperature for (a) diethyl ether, (b) ethanol, (c) water, and (d) mercury. The horizontal dashed line at a pressure of 1 atm intersects vapor pressure at normal boiling point a Pressure o 0 b 50 c 100 d 200 Temperature (°C) 350
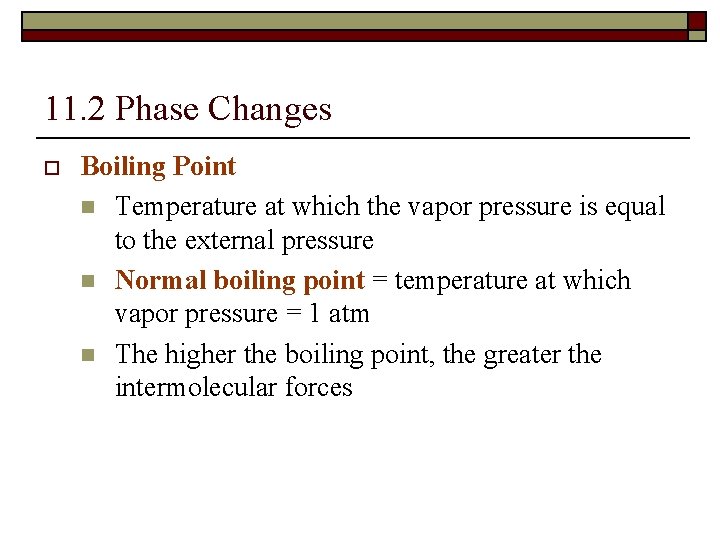
11. 2 Phase Changes o Boiling Point n Temperature at which the vapor pressure is equal to the external pressure n Normal boiling point = temperature at which vapor pressure = 1 atm n The higher the boiling point, the greater the intermolecular forces
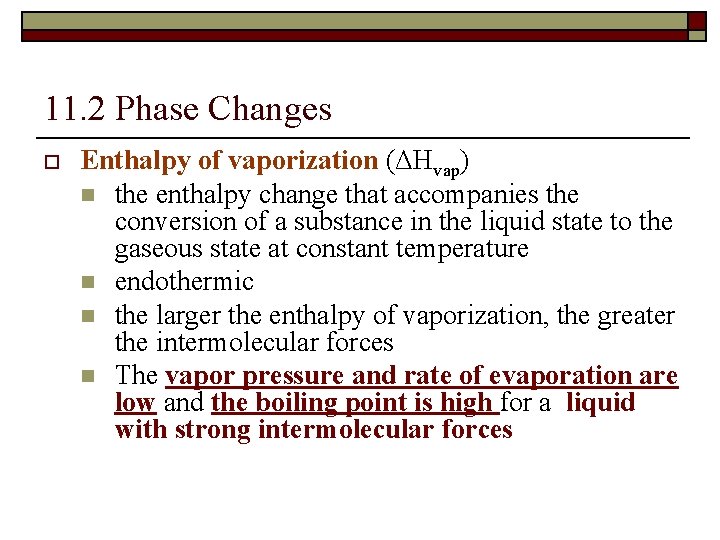
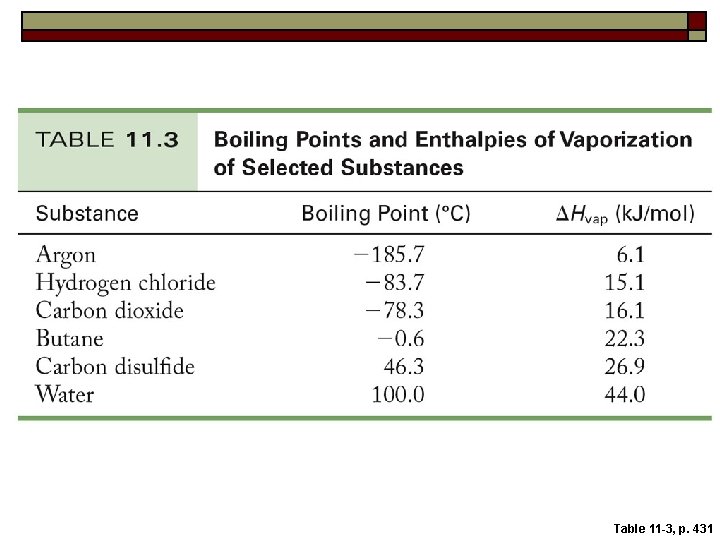
11. 2 Phase Changes o Enthalpy of vaporization (ΔHvap) n the enthalpy change that accompanies the conversion of a substance in the liquid state to the gaseous state at constant temperature n endothermic n the larger the enthalpy of vaporization, the greater the intermolecular forces n The vapor pressure and rate of evaporation are low and the boiling point is high for a liquid with strong intermolecular forces
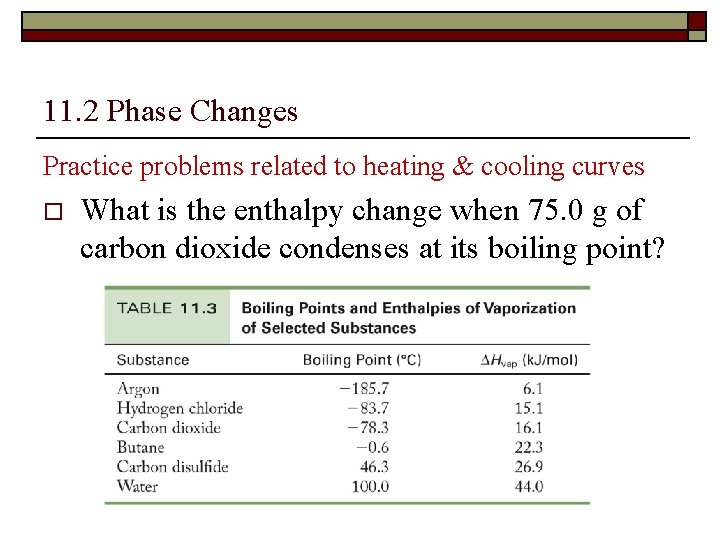
Table 11 -3, p. 431
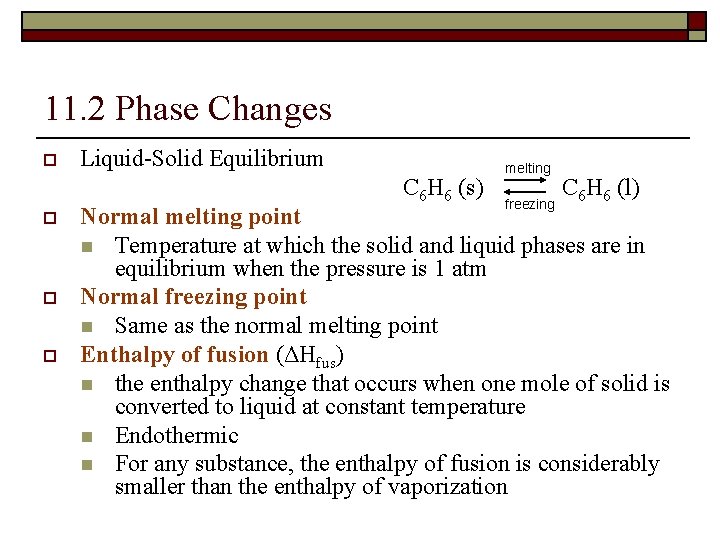
11. 2 Phase Changes o Liquid-Solid Equilibrium C 6 H 6 (s) o o o melting freezing C 6 H 6 (l) Normal melting point n Temperature at which the solid and liquid phases are in equilibrium when the pressure is 1 atm Normal freezing point n Same as the normal melting point Enthalpy of fusion (ΔHfus) n the enthalpy change that occurs when one mole of solid is converted to liquid at constant temperature n Endothermic n For any substance, the enthalpy of fusion is considerably smaller than the enthalpy of vaporization
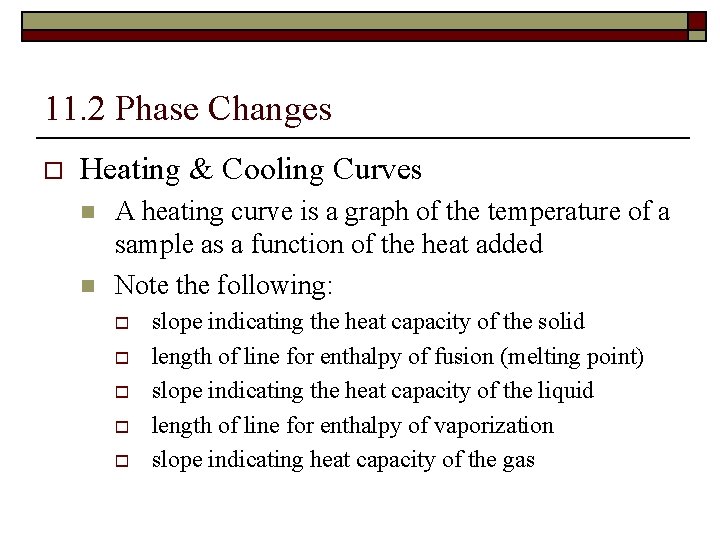
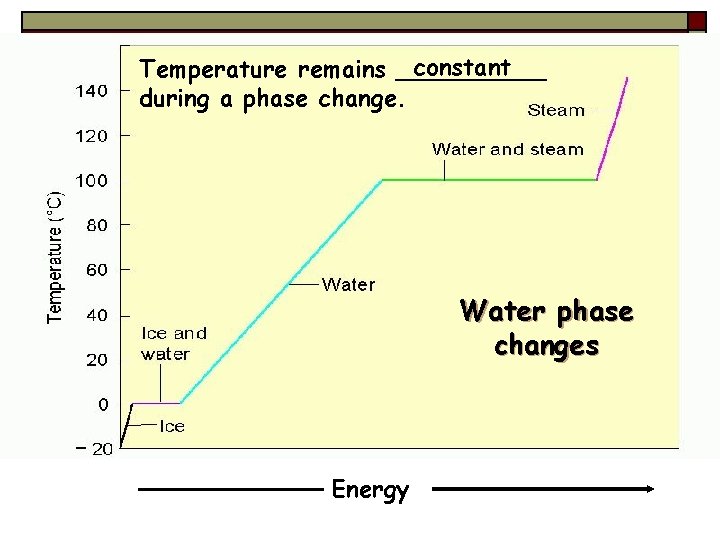
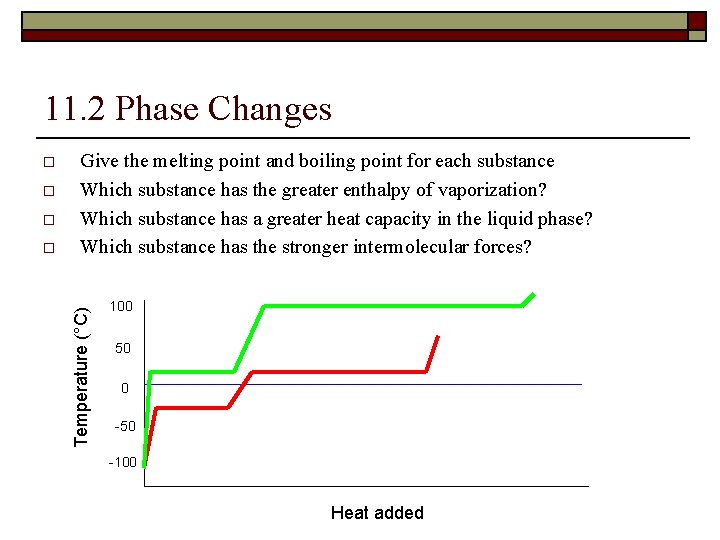
11. 2 Phase Changes o Heating & Cooling Curves n n A heating curve is a graph of the temperature of a sample as a function of the heat added Note the following: o o o slope indicating the heat capacity of the solid length of line for enthalpy of fusion (melting point) slope indicating the heat capacity of the liquid length of line for enthalpy of vaporization slope indicating heat capacity of the gas
constant Temperature remains _____ during a phase change. Water phase changes Energy
11. 2 Phase Changes o o o Give the melting point and boiling point for each substance Which substance has the greater enthalpy of vaporization? Which substance has a greater heat capacity in the liquid phase? Which substance has the stronger intermolecular forces? Temperature (°C) o 100 50 0 -50 -100 Heat added
11. 2 Phase Changes o o Solid-Gas Equilibrium n Solids have a vapor pressure as do liquids/Ex: mothballs Sublimation n Direct conversion of a substance from the solid to the gaseous state n Think about the disappearing ice cubes in the freezer…. n CO 2, dry ice, is another common example Deposition n Conversion of a gas directly to the solid state Enthalpy of sublimation (ΔHsublimation) n the enthalpy change for the conversion of one mole of solid to the gaseous state n endothermic
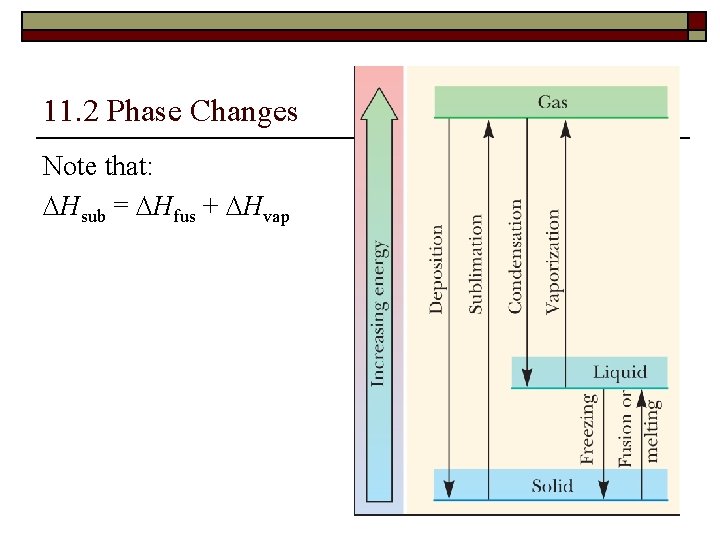
11. 2 Phase Changes Note that: DHsub = DHfus + DHvap
11. 2 Phase Changes Practice problems related to heating & cooling curves o What is the enthalpy change when 75. 0 g of carbon dioxide condenses at its boiling point?
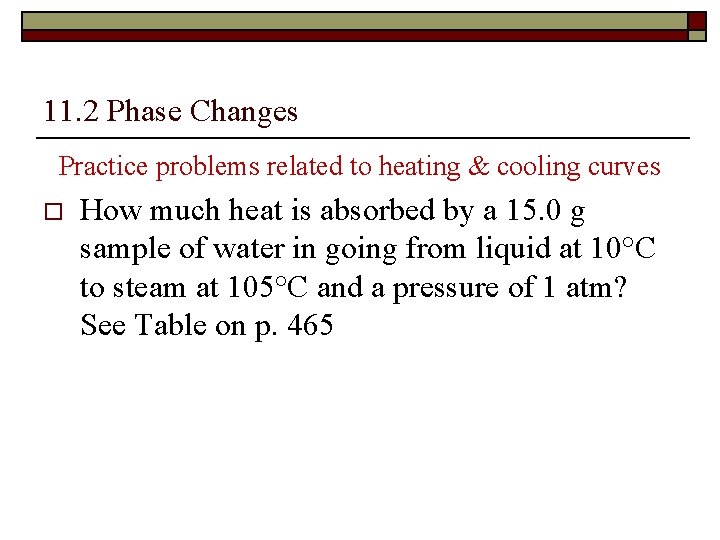
11. 2 Phase Changes Practice problems related to heating & cooling curves o How much heat is absorbed by a 15. 0 g sample of water in going from liquid at 10°C to steam at 105°C and a pressure of 1 atm? See Table on p. 465
11. 3 Phase Diagrams Objectives o o o To identify the various phases that are stable at any point on a phase diagram To relate the sign of the slope for the solid-liquid equilibrium line to the difference in the densities of the two states To construct from the phase diagram the main features of a heating or cooling curve at constant pressure
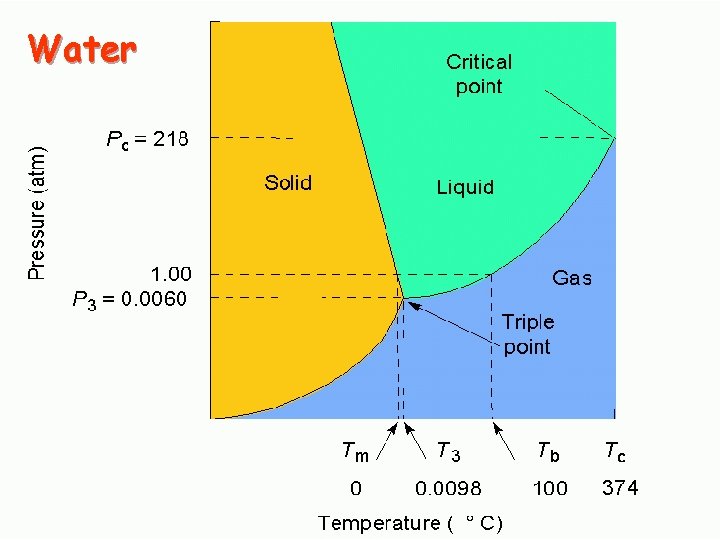
Water
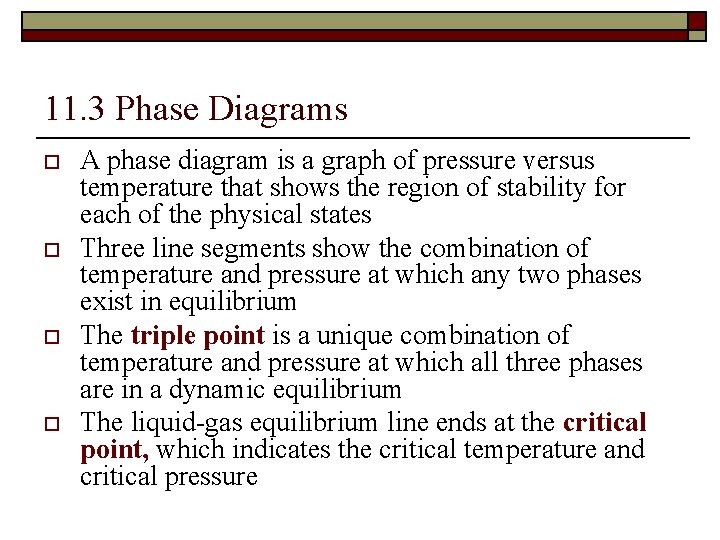
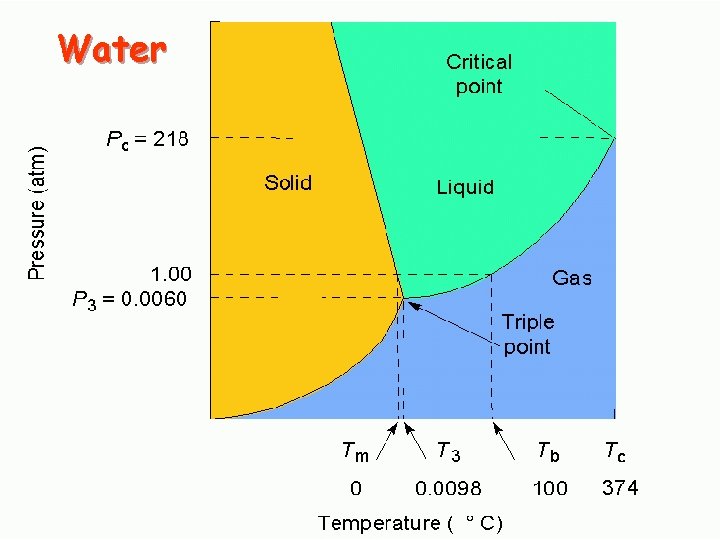
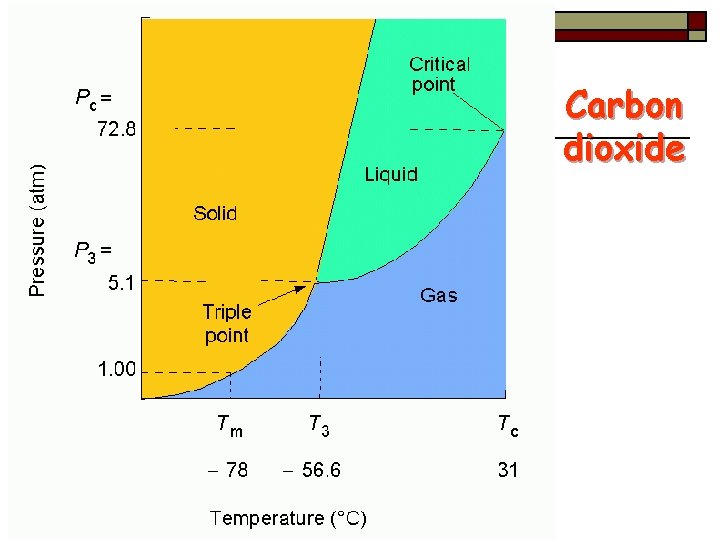
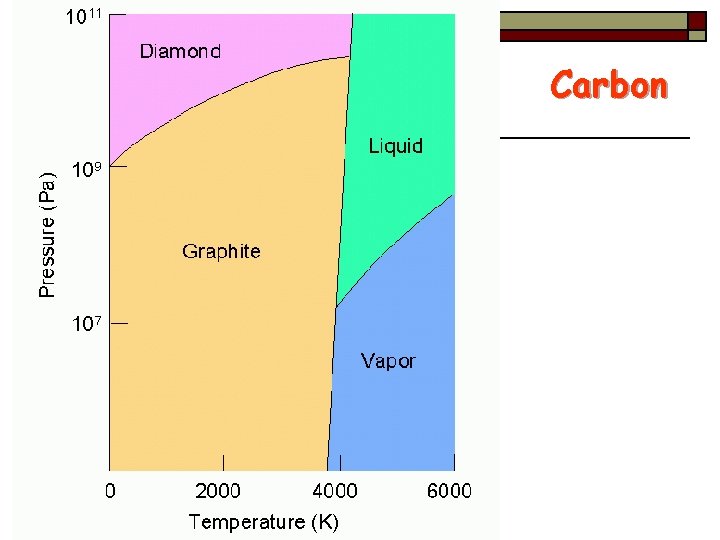
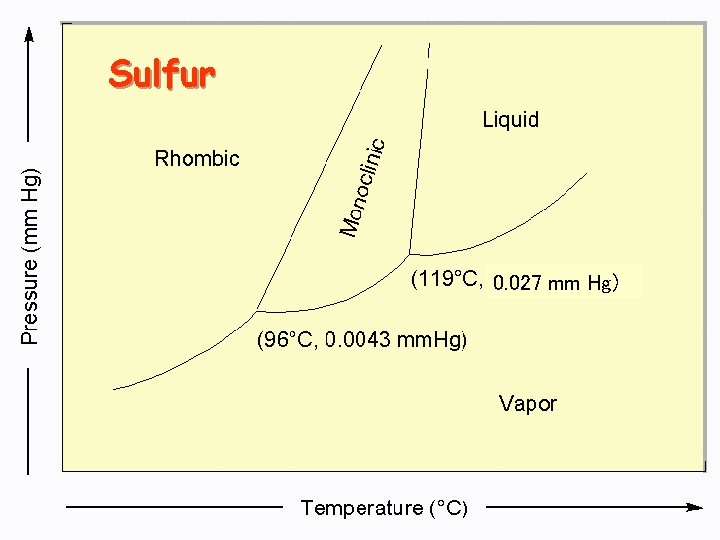
11. 3 Phase Diagrams o o A phase diagram is a graph of pressure versus temperature that shows the region of stability for each of the physical states Three line segments show the combination of temperature and pressure at which any two phases exist in equilibrium The triple point is a unique combination of temperature and pressure at which all three phases are in a dynamic equilibrium The liquid-gas equilibrium line ends at the critical point, which indicates the critical temperature and critical pressure
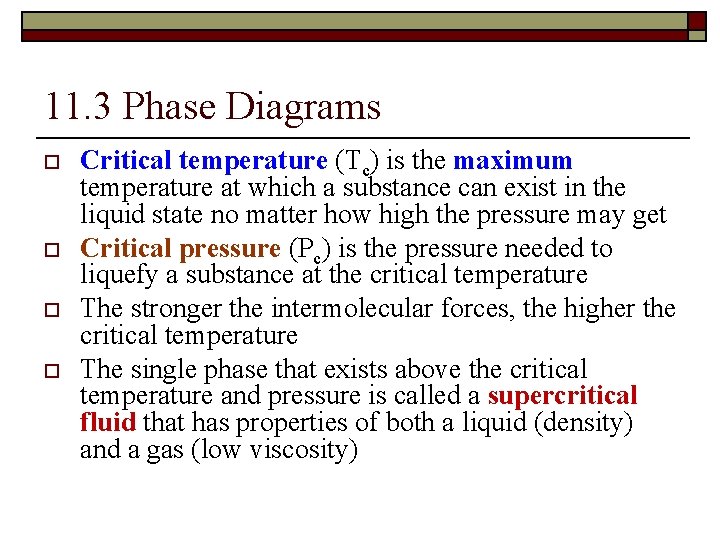
11. 3 Phase Diagrams o o Critical temperature (Tc) is the maximum temperature at which a substance can exist in the liquid state no matter how high the pressure may get Critical pressure (Pc) is the pressure needed to liquefy a substance at the critical temperature The stronger the intermolecular forces, the higher the critical temperature The single phase that exists above the critical temperature and pressure is called a supercritical fluid that has properties of both a liquid (density) and a gas (low viscosity)
Water
Carbon dioxide
Carbon
Sulfur 0. 027 mm Hg)
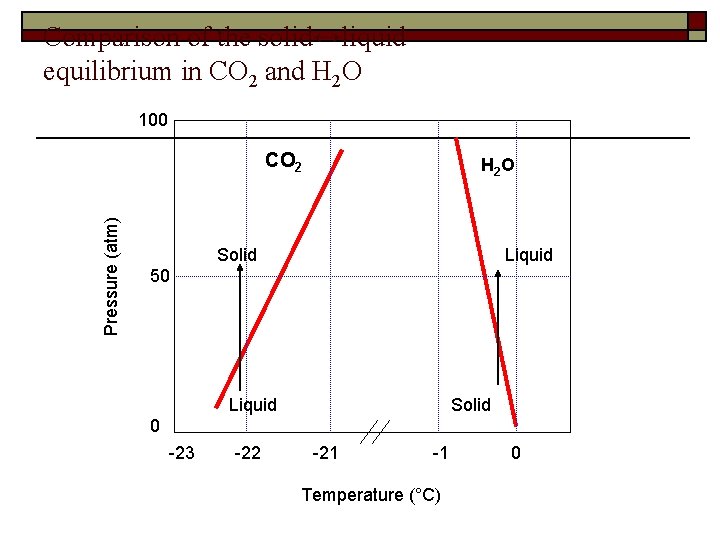
Comparison of the solid↔liquid equilibrium in CO 2 and H 2 O 100 Pressure (atm) CO 2 H 2 O Solid Liquid 50 Liquid Solid 0 -23 -22 -21 -1 Temperature (°C) 0
11. 4 Intermolecular Attractions Objectives o o o To list and explain the origins of the various intermolecular forces To use the periodic trends to determine the relative strengths of intermolecular forces in different substances To compare the relative strengths of different kinds of intermolecular forces
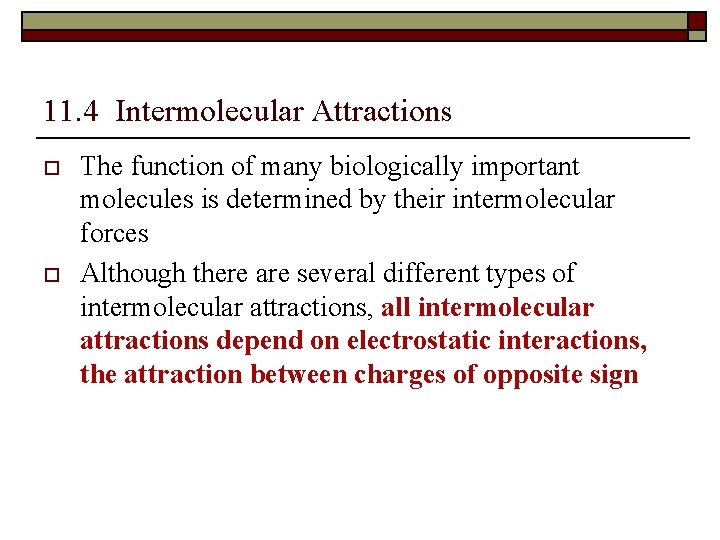
11. 4 Intermolecular Attractions o o The function of many biologically important molecules is determined by their intermolecular forces Although there are several different types of intermolecular attractions, all intermolecular attractions depend on electrostatic interactions, the attraction between charges of opposite sign
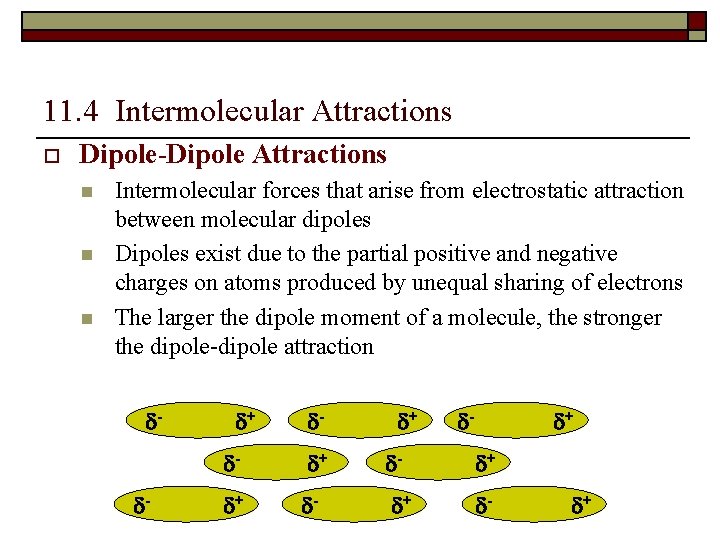
11. 4 Intermolecular Attractions o Dipole-Dipole Attractions n n n Intermolecular forces that arise from electrostatic attraction between molecular dipoles Dipoles exist due to the partial positive and negative charges on atoms produced by unequal sharing of electrons The larger the dipole moment of a molecule, the stronger the dipole-dipole attraction - + - + + - +
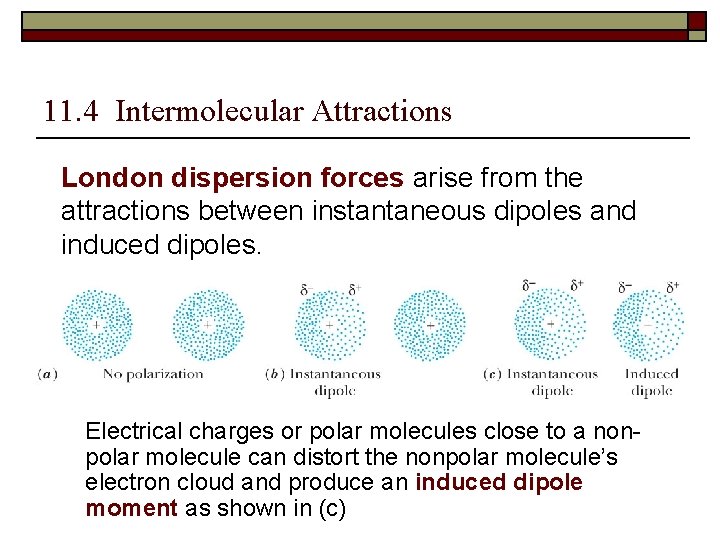
11. 4 Intermolecular Attractions London dispersion forces arise from the attractions between instantaneous dipoles and induced dipoles. Electrical charges or polar molecules close to a nonpolar molecule can distort the nonpolar molecule’s electron cloud and produce an induced dipole moment as shown in (c)
11. 4 Intermolecular Attractions o van der Waals forces n collective term used to describe (a) dipole-dipole (b) dipole-induced dipole (c) instantaneous dipole – induced dipole interactions
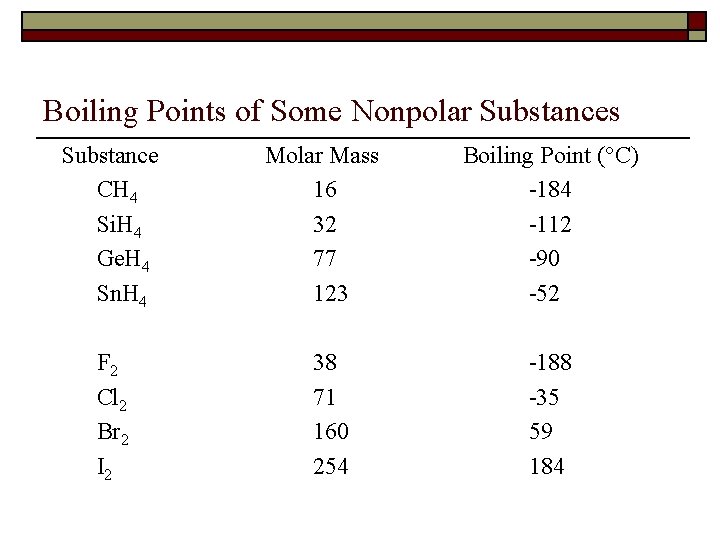
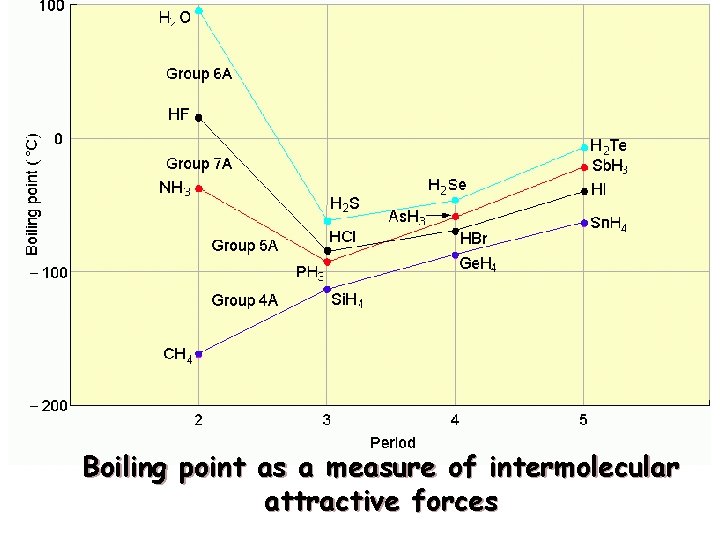
11. 4 Intermolecular Attractions o London Dispersion Forces n Contribute to the attraction between all molecules n The temporary separations of charge that lead to the London force attractions are what attract one nonpolar molecule to its neighbors. n London forces increase with the size of the molecules. n For related series of molecules, London dispersion forces increase going down any group in the periodic table
Boiling Points of Some Nonpolar Substances Substance CH 4 Si. H 4 Ge. H 4 Sn. H 4 F 2 Cl 2 Br 2 I 2 Molar Mass 16 32 77 123 38 71 160 254 Boiling Point ( C) -184 -112 -90 -52 -188 -35 59 184
Boiling point as a measure of intermolecular attractive forces
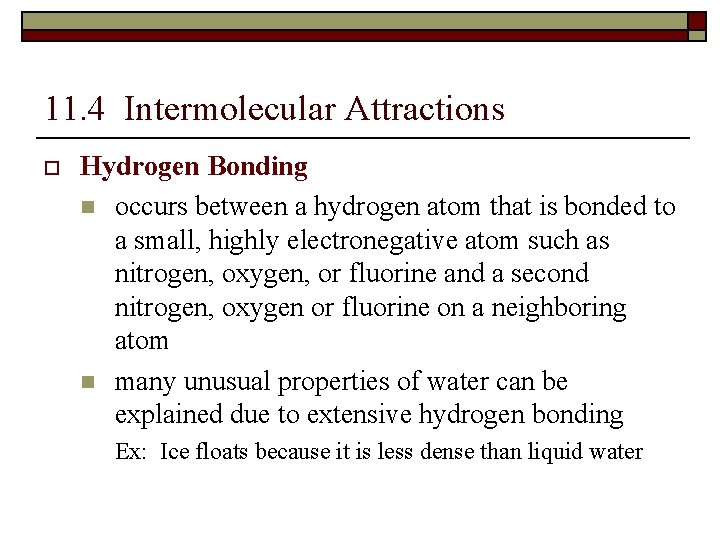
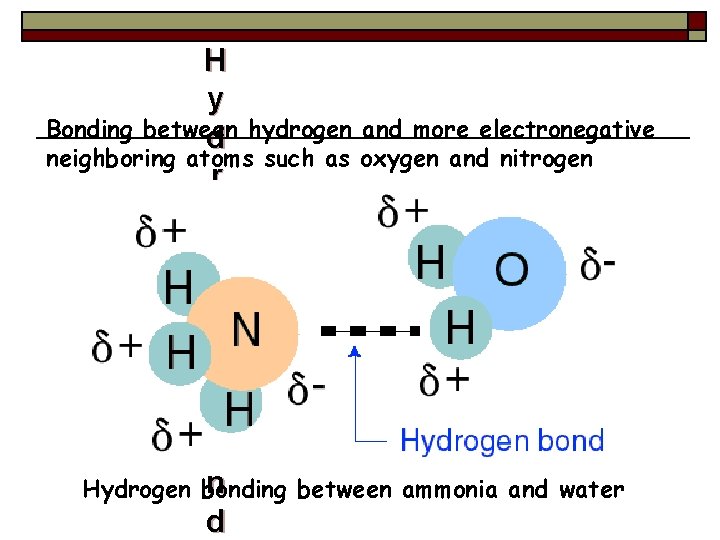
11. 4 Intermolecular Attractions o Hydrogen Bonding n occurs between a hydrogen atom that is bonded to a small, highly electronegative atom such as nitrogen, oxygen, or fluorine and a second nitrogen, oxygen or fluorine on a neighboring atom n many unusual properties of water can be explained due to extensive hydrogen bonding Ex: Ice floats because it is less dense than liquid water
H y Bonding between d hydrogen and more electronegative neighboring atoms such as oxygen and nitrogen r o g e n Hydrogen B o n bonding d between ammonia and water
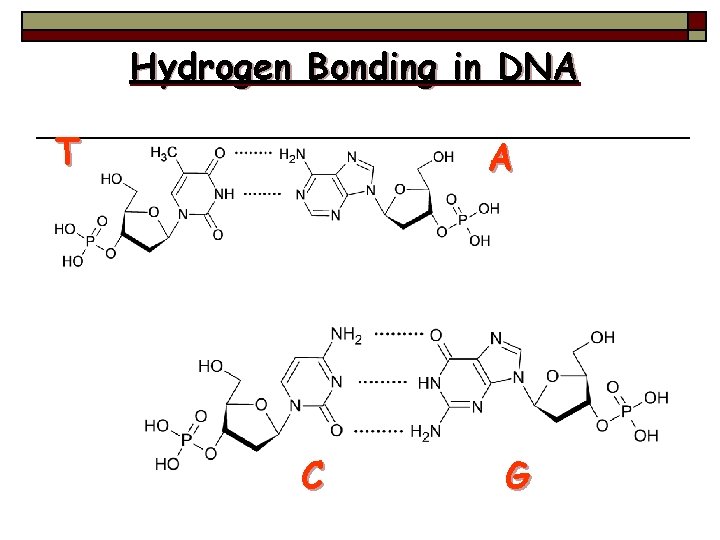
Hydrogen Bonding in DNA T A C G
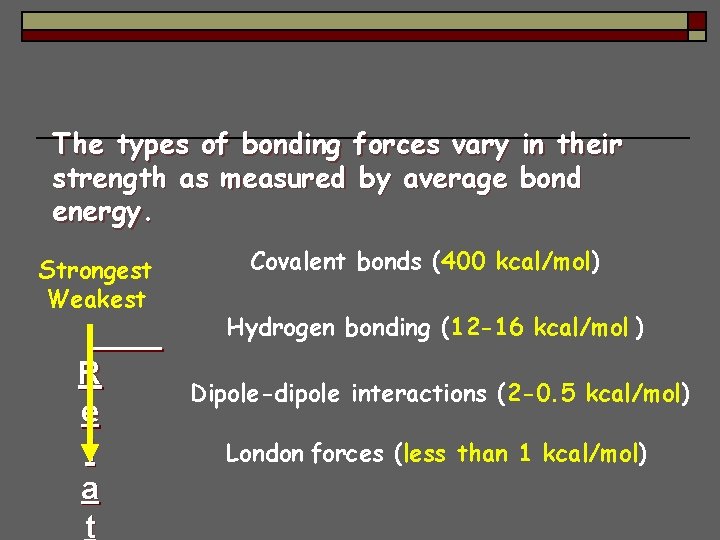
The types of bonding forces vary in their strength as measured by average bond energy. Strongest Weakest R e l a t Covalent bonds (400 kcal/mol) Hydrogen bonding (12 -16 kcal/mol ) Dipole-dipole interactions (2 -0. 5 kcal/mol) London forces (less than 1 kcal/mol)
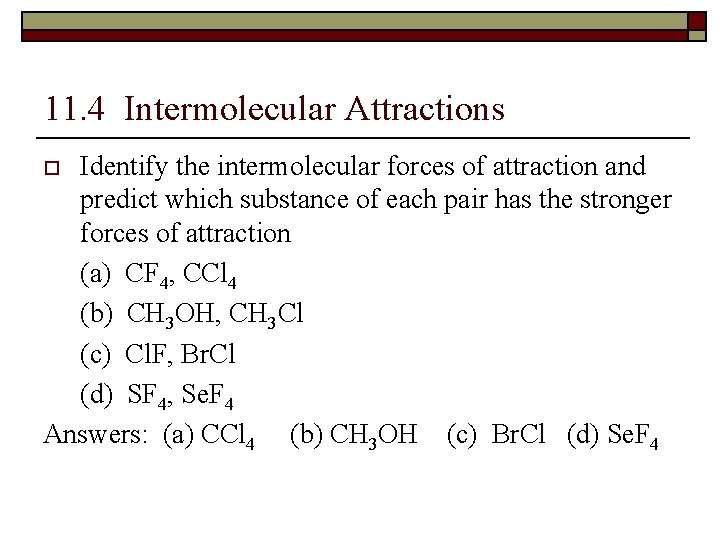
11. 4 Intermolecular Attractions Identify the intermolecular forces of attraction and predict which substance of each pair has the stronger forces of attraction (a) CF 4, CCl 4 (b) CH 3 OH, CH 3 Cl (c) Cl. F, Br. Cl (d) SF 4, Se. F 4 Answers: (a) CCl 4 (b) CH 3 OH (c) Br. Cl (d) Se. F 4 o
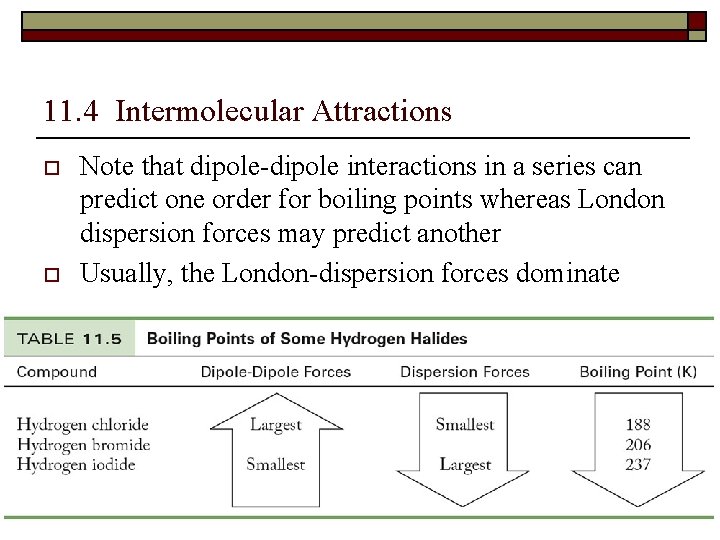
11. 4 Intermolecular Attractions o o Note that dipole-dipole interactions in a series can predict one order for boiling points whereas London dispersion forces may predict another Usually, the London-dispersion forces dominate
11. 5 Properties of Liquids and Intermolecular Attractions Objectives o o To correlate the surface tension and viscosity of liquids to the strengths of intermolecular forces To distinguish between cohesion and adhesion and relate them to capillary action
11. 5 Properties of Liquids and Intermolecular Attractions o Surface Tension n n Small drops of liquids adopt a spherical shape due to intermolecular forces of attraction Surface tension = the energy required to increase the surface area of a liquid o o Expressed in units of J/m 2 The greater the intermolecular forces, the greater the surface tension
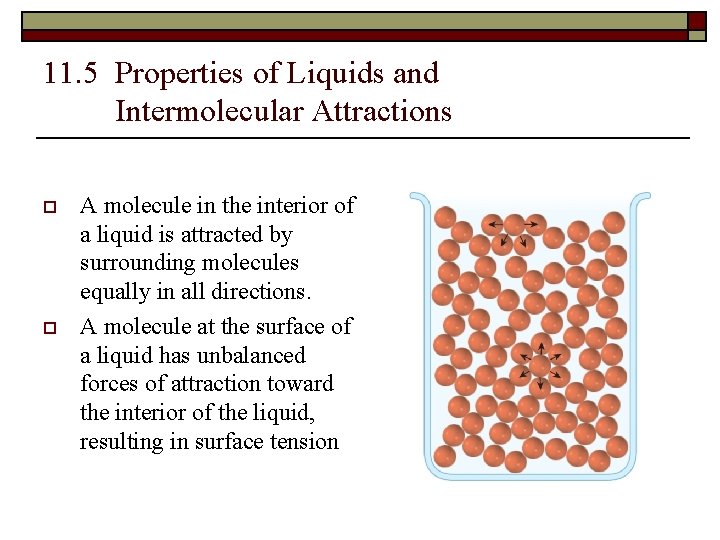
11. 5 Properties of Liquids and Intermolecular Attractions o o A molecule in the interior of a liquid is attracted by surrounding molecules equally in all directions. A molecule at the surface of a liquid has unbalanced forces of attraction toward the interior of the liquid, resulting in surface tension
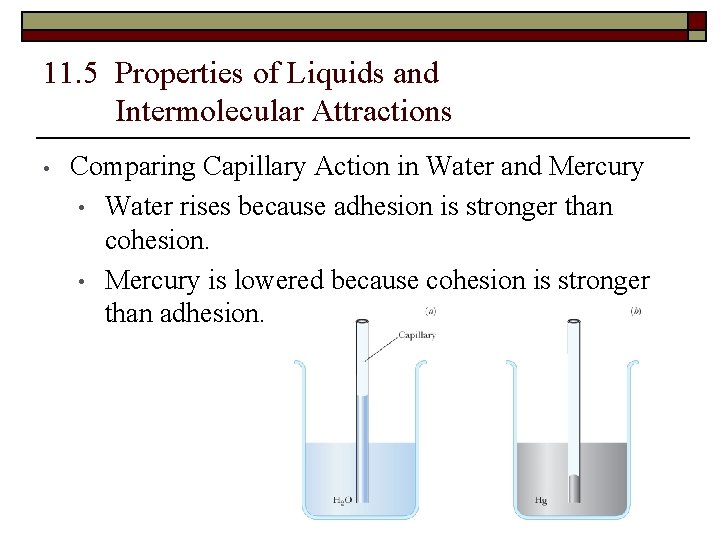
11. 5 Properties of Liquids and Intermolecular Attractions o Capillary Action n The rising of water in a small diameter column against the forces of gravity due to intermolecular forces n Cohesion o n The attraction of molecules for other molecules of the same substance Adhesion o The attraction that molecules of one substance exert on those of a different substance
11. 5 Properties of Liquids and Intermolecular Attractions • Comparing Capillary Action in Water and Mercury • Water rises because adhesion is stronger than cohesion. • Mercury is lowered because cohesion is stronger than adhesion.
11. 5 Properties of Liquids and Intermolecular Attractions o Viscosity (N • s/m 2) n The resistance of fluid to flow n The stronger the intermolecular forces between molecules of a liquid, the more viscous the liquid n Structure, size, and shape of molecules also influences viscosity (think glycerol vs water)
11. 6 Properties of Solids and Intermolecular Attractions Objectives o o To distinguish between crystalline and amorphous solids To describe the characteristics of molecular, crystal network, ionic, and metallic solids
11. 6 Properties of Solids and Intermolecular Attractions o Solids can be described as crystalline or amorphous n Crystalline Solid o o o n Units that make up a substance arranged in a very regular repeating pattern Classified according to the types of intermolecular forces that hold the units together Ex: Na. Cl Amorphous Solid o o o Lack long range order of crystalline solids Liquid states tend to be very viscous Ex: polyethylene, a type of plastic
11. 6 Properties of Solids and Intermolecular Attractions o Types of crystalline solids include: n Molecular Solids n Covalent Network Solids n Ionic Solids n Metallic Solids
11. 6 Properties of Solids and Intermolecular Attractions o Molecular Solids n n n Held together by van der Waals forces and/or hydrogen bonds Physical properties vary considerably depending on the strength of intermolecular interactions Usually soft substances with melting points < 300°C Typically liquids or gases at room temperature Ex: Ar, H 2 O, CO 2, I 2
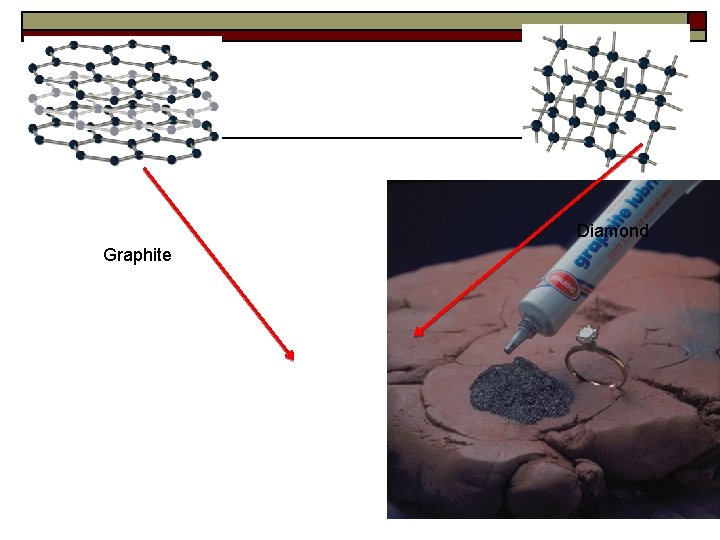
11. 6 Properties of Solids and Intermolecular Attractions o Covalent Network Solids n Atoms are held together by covalent bonds: o Diamonds n n o Each carbon is bonded to four other carbon atoms at the corners of a tetrahedron (sp 3 hybridization) Characterized by hardness and high melting point Graphite n n Forms sheets of atoms with covalent C-C bonds formed by sp 2 hybridization with trigonal planar geometry and van der Waals forces between sheets Soft in nature
11. 6 Properties of Solids and Intermolecular Attractions o Allotropes n Term that refers to two or more molecules or crystalline forms of an element in the same physical state that exhibit different physical and chemical properties n Examples: o diamond & graphite o oxygen & ozone
Diamond Graphite
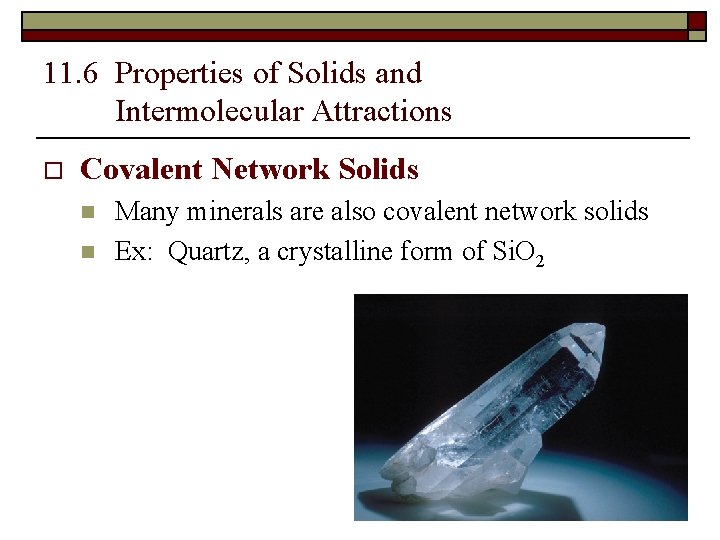
11. 6 Properties of Solids and Intermolecular Attractions o Covalent Network Solids n n Many minerals are also covalent network solids Ex: Quartz, a crystalline form of Si. O 2
11. 6 Properties of Solids and Intermolecular Attractions o Ionic Solids n n n Consist of oppositely charged ions held together by electrostatic attractions Characterized by strong interactions, have high melting points, and tend to be relatively hard & brittle Do not conduct electricity in the solid state but are excellent conductors in the liquid state o Examples: n Na. Cl, Mg. O
11. 6 Properties of Solids and Intermolecular Attractions o Metallic Solids n Formed by metal atoms n Strength of attraction varies greatly so there a wide range of melting and boiling points for metallic substances n “Electron Sea” model used to describe metallic bonding o A sea of electrons with metal ions embedded in it n Characterized by: o high thermal and electrical conductivity o metallic luster o malleability
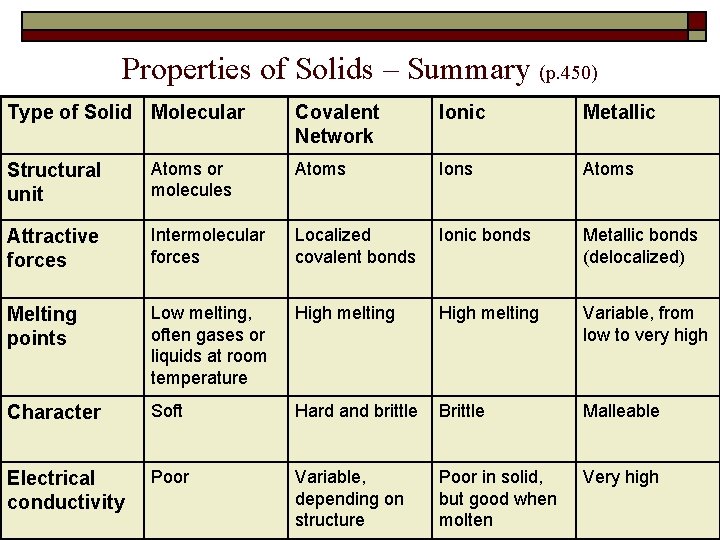
Properties of Solids – Summary (p. 450) Type of Solid Molecular Covalent Network Ionic Metallic Structural unit Atoms or molecules Atoms Ions Atoms Attractive forces Intermolecular forces Localized covalent bonds Ionic bonds Metallic bonds (delocalized) Melting points Low melting, often gases or liquids at room temperature High melting Variable, from low to very high Character Soft Hard and brittle Brittle Malleable Electrical conductivity Poor Variable, depending on structure Poor in solid, but good when molten Very high
11. 7 Structures of Crystalline Solids Objectives o o To use the Bragg equation to relate the angle of diffraction and wavelength of x-rays to the distances in crystals To determine the number of ions or atoms present in a cubic unit cell of a solid To calculate the density of a crystalline solid from the dimensions and contents of a unit cell To know the relation between the cubic closest packing and face-centered cubic crystal structures
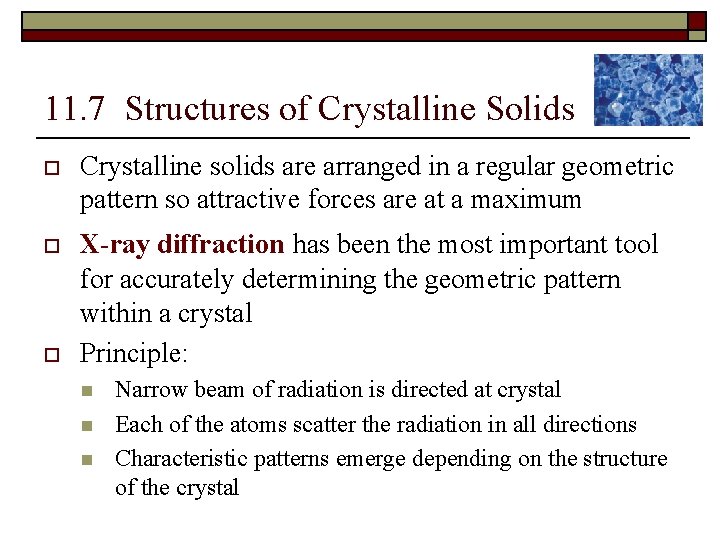
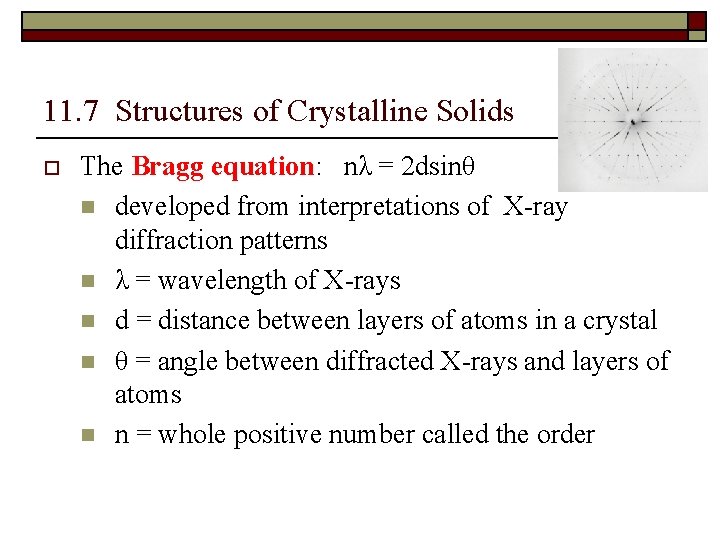
11. 7 Structures of Crystalline Solids o Crystalline solids are arranged in a regular geometric pattern so attractive forces are at a maximum o X-ray diffraction has been the most important tool for accurately determining the geometric pattern within a crystal Principle: o n n n Narrow beam of radiation is directed at crystal Each of the atoms scatter the radiation in all directions Characteristic patterns emerge depending on the structure of the crystal
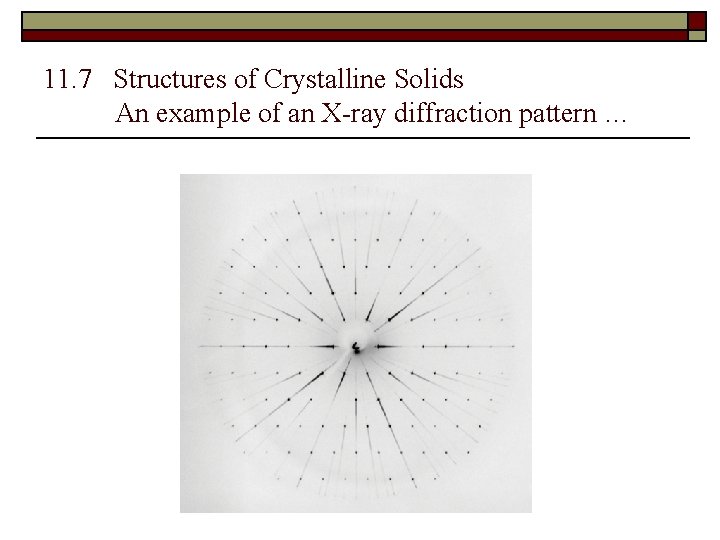
11. 7 Structures of Crystalline Solids An example of an X-ray diffraction pattern …
11. 7 Structures of Crystalline Solids o The Bragg equation: nλ = 2 dsinθ n developed from interpretations of X-ray diffraction patterns n λ = wavelength of X-rays n d = distance between layers of atoms in a crystal n θ = angle between diffracted X-rays and layers of atoms n n = whole positive number called the order
11. 7 Structures of Crystalline Solids o The Bragg equation nλ = 2 dsinθ n Several different distances can exist between layers of atoms in a crystalline solid n Useful only when the spacing between the layers of atoms in the crystal and the wavelength of radiation are the same order of magnitude
11. 7 Structures of Crystalline Solids o o o The particles (atoms or ions) in a crystalline solid are arranged so that attractive forces are maximized As mentioned previously, X-ray diffraction data can be used to define geometric patterns within the crystal Each point in the crystal is defined mathematically by angle and distance to nearest neighbors and is referred to as a lattice point
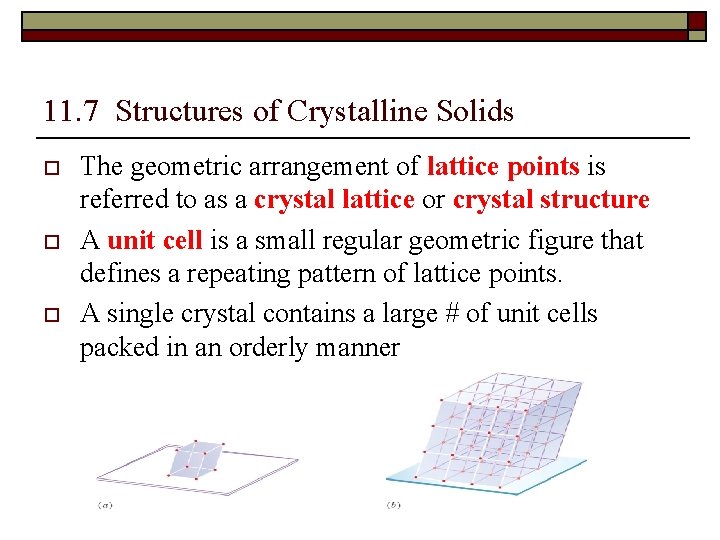
11. 7 Structures of Crystalline Solids o o o The geometric arrangement of lattice points is referred to as a crystal lattice or crystal structure A unit cell is a small regular geometric figure that defines a repeating pattern of lattice points. A single crystal contains a large # of unit cells packed in an orderly manner
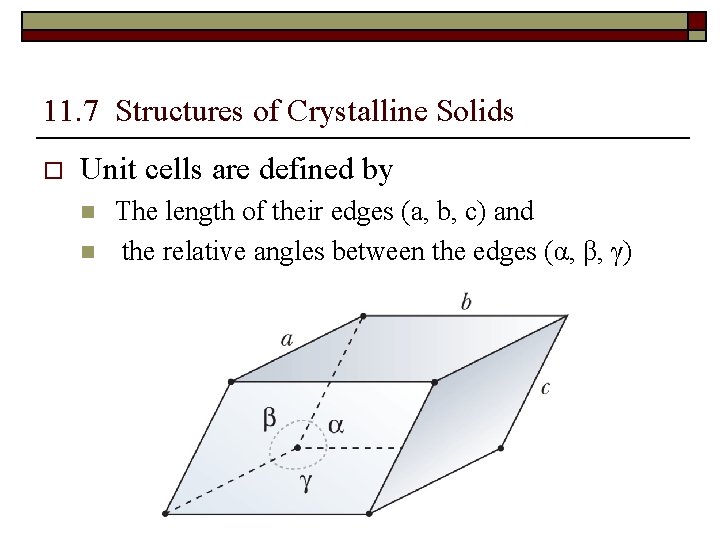
11. 7 Structures of Crystalline Solids o Unit cells are defined by n n The length of their edges (a, b, c) and the relative angles between the edges (α, β, γ)
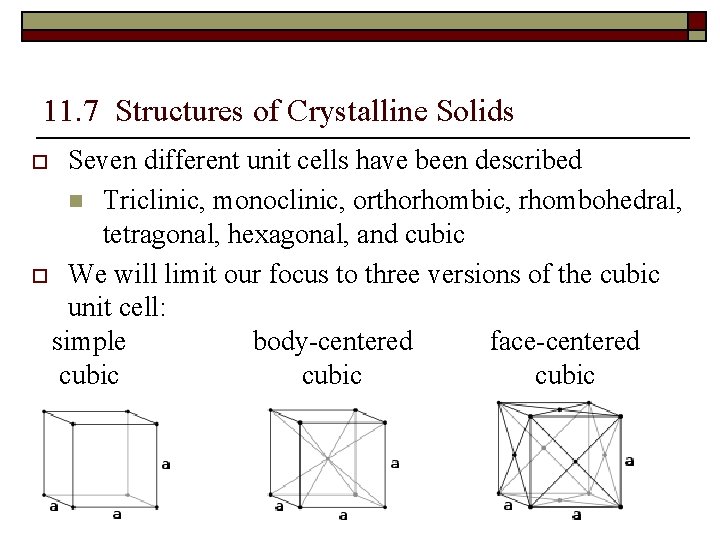
11. 7 Structures of Crystalline Solids Seven different unit cells have been described n Triclinic, monoclinic, orthorhombic, rhombohedral, tetragonal, hexagonal, and cubic o We will limit our focus to three versions of the cubic unit cell: simple body-centered face-centered cubic o
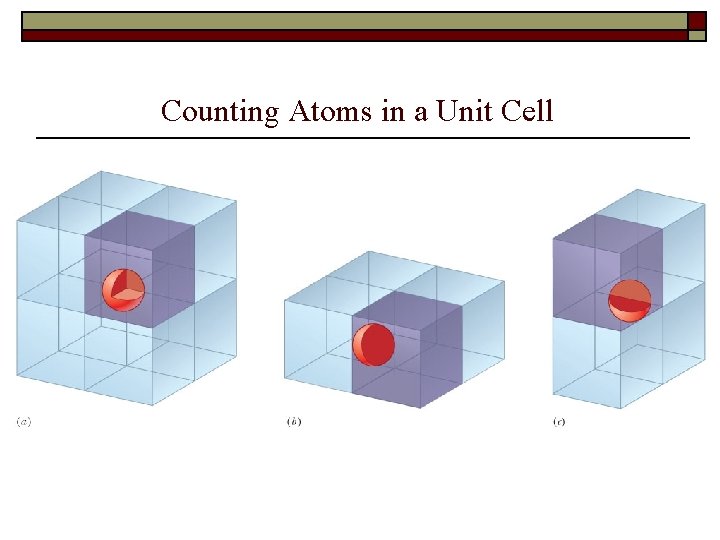
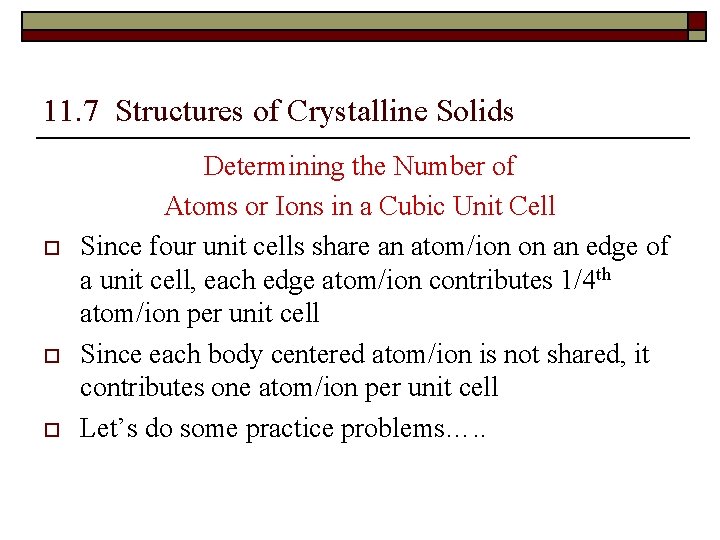
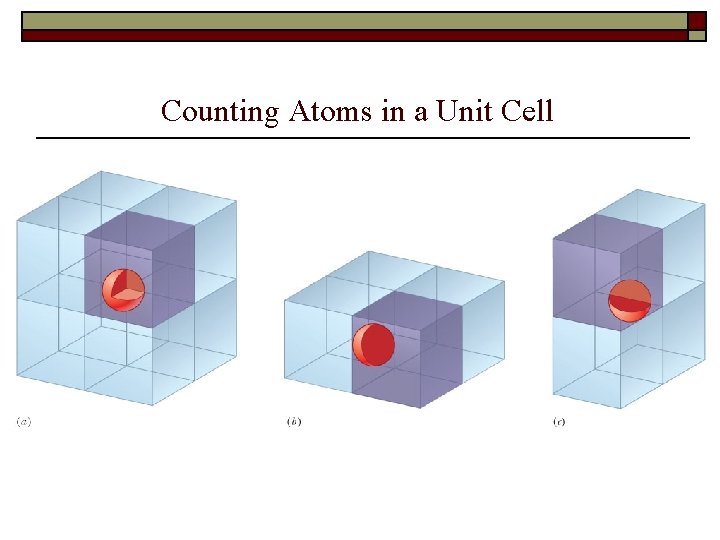
11. 7 Structures of Crystalline Solids o o o Determining the Number of Atoms or Ions in a Cubic Unit Cell Since eight unit cells share a corner atom/ion, each corner contributes 1/8 th atom/ion per unit cell Since two unit cells share a face centered atom/ion, each face centered atom/ion contributes ½ atom/ion per unit cell Since four unit cells share an atom/ion on an edge of a unit cell, each edge atom/ion contributes 1/4 th atom/ion per unit cell
Counting Atoms in a Unit Cell
11. 7 Structures of Crystalline Solids o o o Determining the Number of Atoms or Ions in a Cubic Unit Cell Since four unit cells share an atom/ion on an edge of a unit cell, each edge atom/ion contributes 1/4 th atom/ion per unit cell Since each body centered atom/ion is not shared, it contributes one atom/ion per unit cell Let’s do some practice problems…. .
Counting Atoms in a Unit Cell
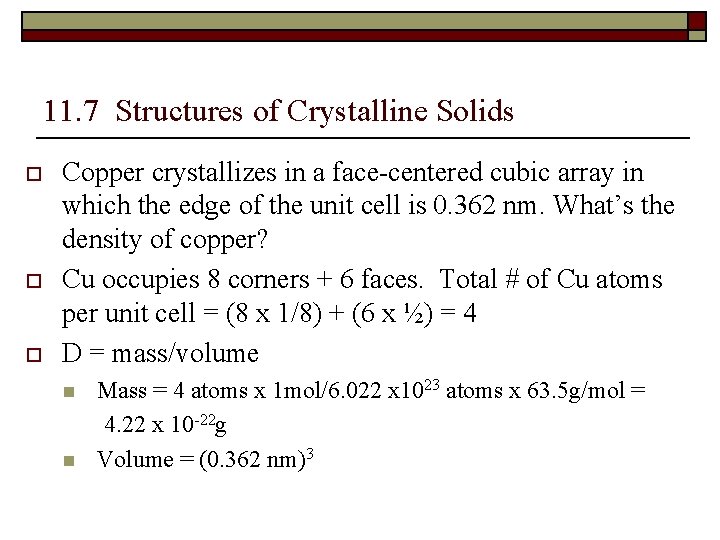
11. 7 Structures of Crystalline Solids o o o Copper crystallizes in a face-centered cubic array in which the edge of the unit cell is 0. 362 nm. What’s the density of copper? Cu occupies 8 corners + 6 faces. Total # of Cu atoms per unit cell = (8 x 1/8) + (6 x ½) = 4 D = mass/volume n n Mass = 4 atoms x 1 mol/6. 022 x 1023 atoms x 63. 5 g/mol = 4. 22 x 10 -22 g Volume = (0. 362 nm)3
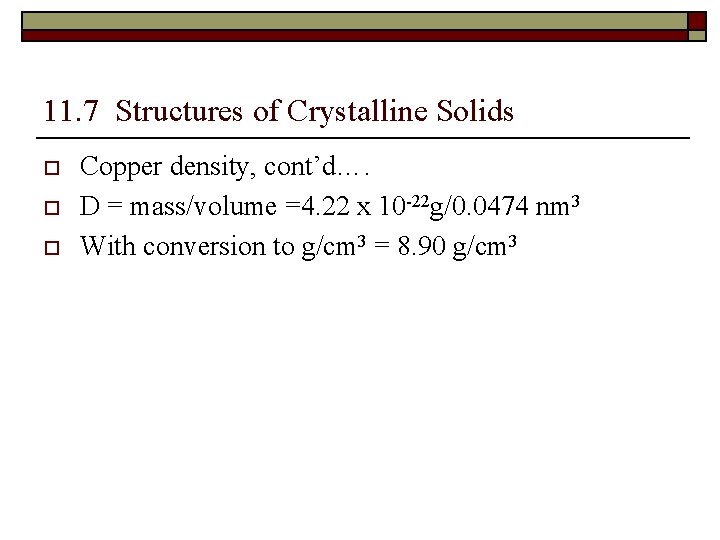
11. 7 Structures of Crystalline Solids o o o Copper density, cont’d…. D = mass/volume =4. 22 x 10 -22 g/0. 0474 nm 3 With conversion to g/cm 3 = 8. 90 g/cm 3
11. 7 Structures of Crystalline Solids o o o Calculating the radius of a metal atom…. Note: n Length of a face diagonal = a√ 2 n Length of a body diagonal is a√ 3 n Remember that four times the atomic radius will equal the length of a given diagonal Let’s try a practice problem….
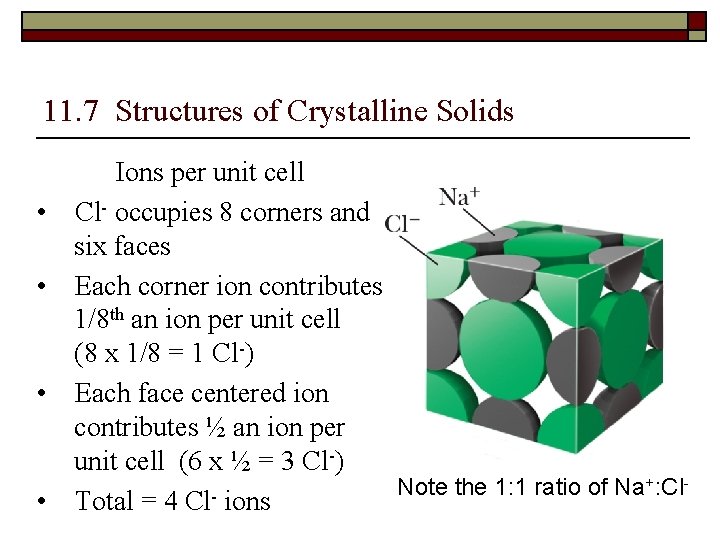
11. 7 Structures of Crystalline Solids o Ionic Crystal Structures…. . n n n Contain two kinds of particles: cations & anions The ratio of cations to anions must be consistent with the formula of the compound Let’s look at sodium chloride…. .
11. 7 Structures of Crystalline Solids o Nickel crystallizes in a face centered array. The length of an edge is 351 pm. What is the radius of a nickel atom? n n Length of a face diagonal = a√ 2 Remember that four times the atomic radius will equal the length of a given diagonal 4 r = 351 pm • √ 2 So r = 124 pm
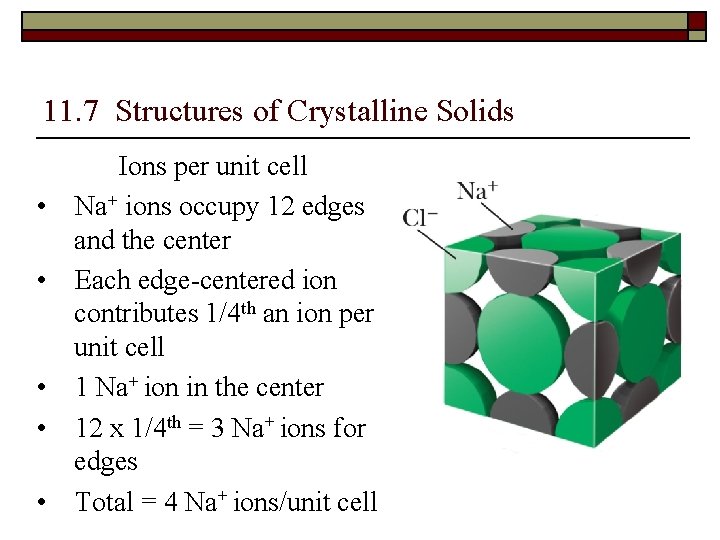
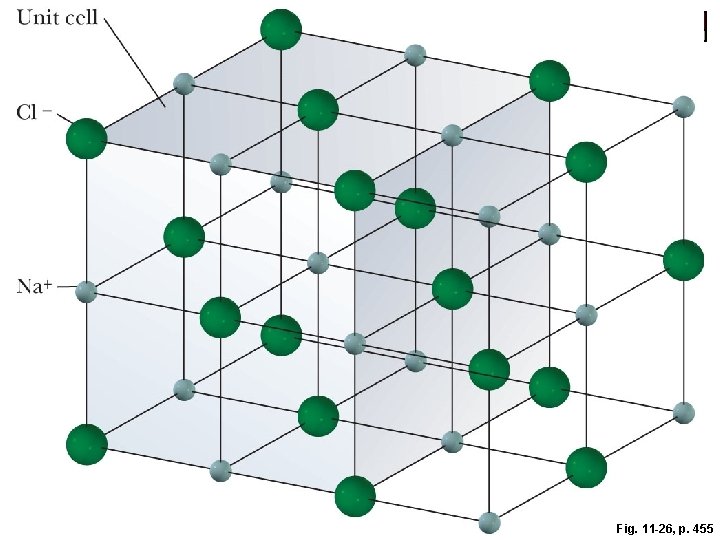
11. 7 Structures of Crystalline Solids • • • Ions per unit cell Na+ ions occupy 12 edges and the center Each edge-centered ion contributes 1/4 th an ion per unit cell 1 Na+ ion in the center 12 x 1/4 th = 3 Na+ ions for edges Total = 4 Na+ ions/unit cell
11. 7 Structures of Crystalline Solids • • Ions per unit cell Cl- occupies 8 corners and six faces Each corner ion contributes 1/8 th an ion per unit cell (8 x 1/8 = 1 Cl-) Each face centered ion contributes ½ an ion per unit cell (6 x ½ = 3 Cl-) +: Cl. Note the 1: 1 ratio of Na Total = 4 Cl- ions
Fig. 11 -26, p. 455
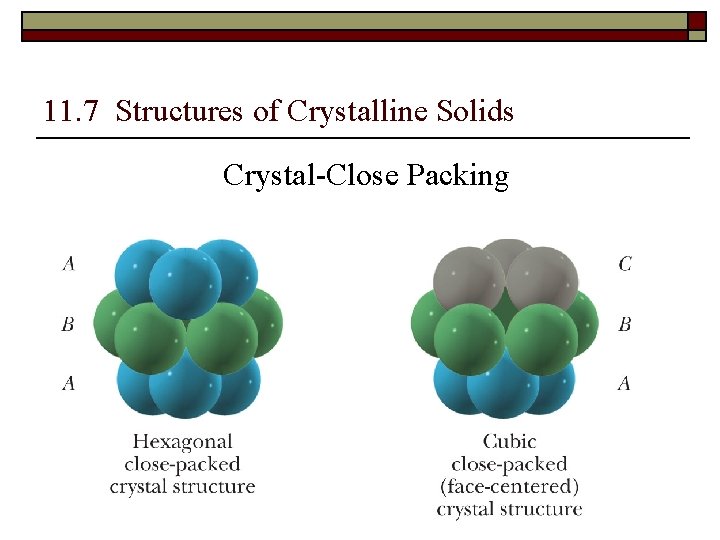
11. 7 Structures of Crystalline Solids Crystal-Close Packing
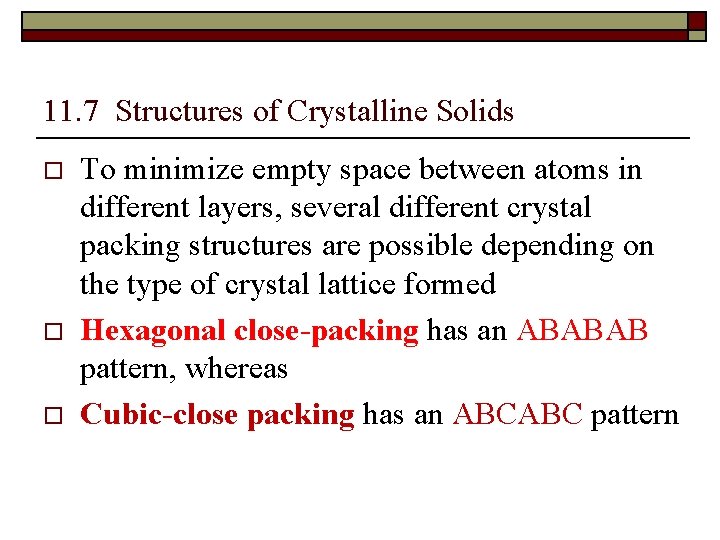
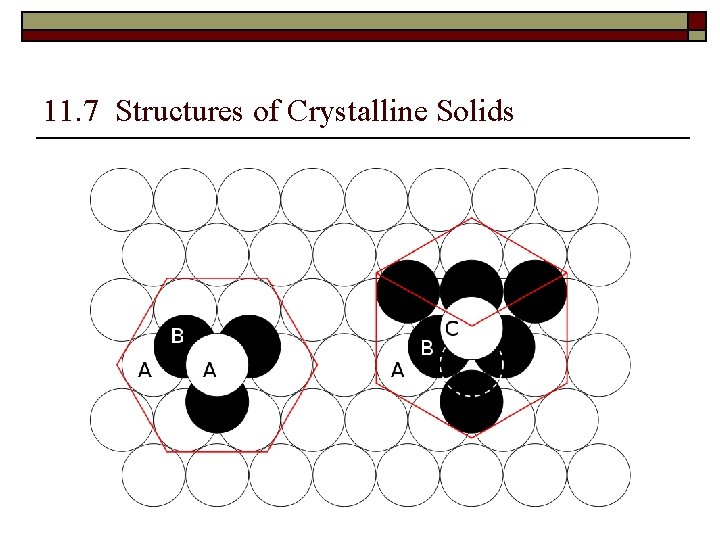
11. 7 Structures of Crystalline Solids o o o To minimize empty space between atoms in different layers, several different crystal packing structures are possible depending on the type of crystal lattice formed Hexagonal close-packing has an ABABAB pattern, whereas Cubic-close packing has an ABCABC pattern
11. 7 Structures of Crystalline Solids