
Lipid Management Vojtech Slezka MD 1 st School


- Slides: 53
Lipid Management Vojtech Slezka, MD
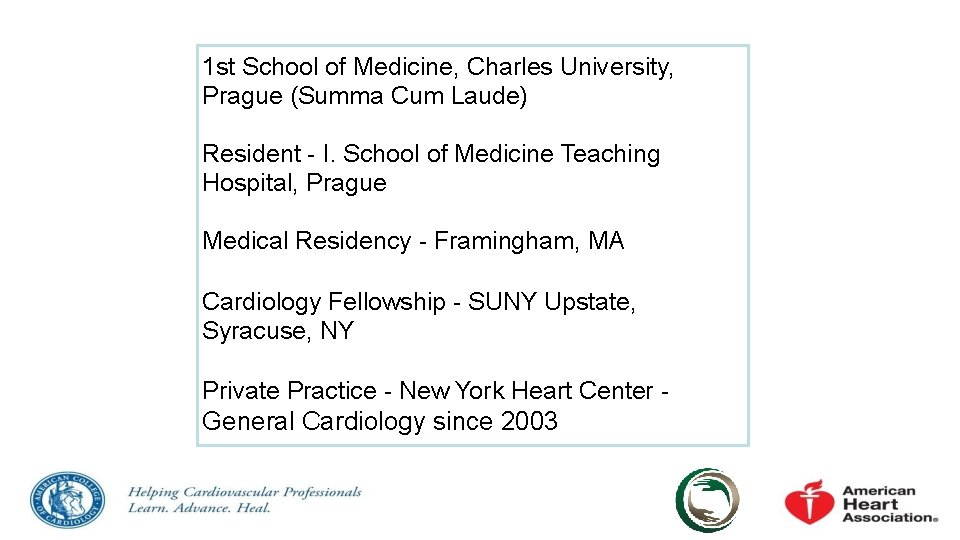
1 st School of Medicine, Charles University, Prague (Summa Cum Laude) Resident - I. School of Medicine Teaching Hospital, Prague Medical Residency - Framingham, MA Cardiology Fellowship - SUNY Upstate, Syracuse, NY Private Practice - New York Heart Center General Cardiology since 2003
Helping Cardiovascular Professionals Learn. Advance. Heat.
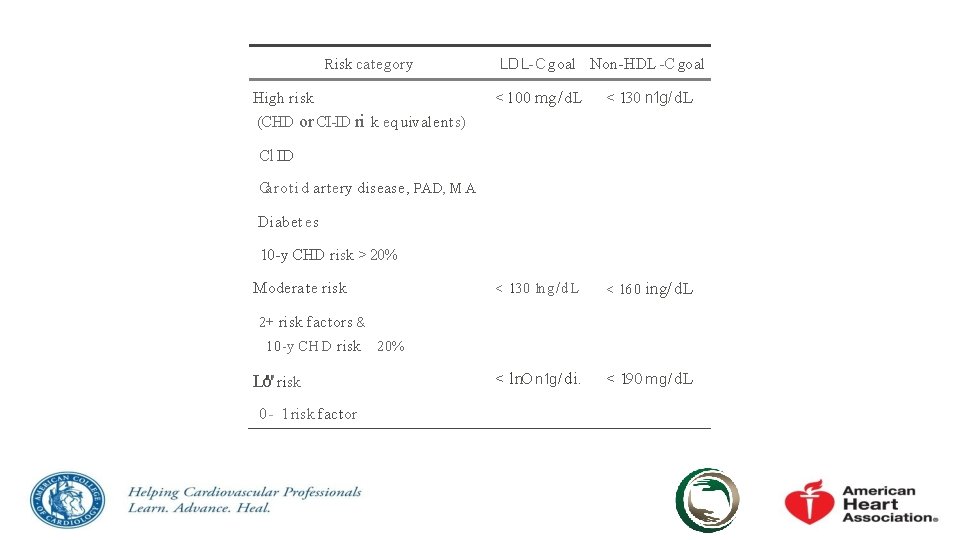
Risk category High risk (CHD or CI-ID ri k eq uivalents) LDL-C goal Non-HDL-C goal < l 00 mg/ d L < 130 n 1 g/ d. L < 130 1 ng/d. L < 160 ing/ d. L < l n. O n 1 g/ di. < 190 mg/ d. L Cl ID Carotid artery disease, PAD, M A Diabet es 10 -y CHD risk > 20% Modera te risk 2+ risk factors & 10 -y CHD risk 20% Lo'"' risk 0 - 1 risk factor
2013 ACC/AHA Guideline on the Treatment of Blood Cholesterol to Reduce Atherosclerotic Cardiovascular Risk in Adults Endorsed by the American Association of Cardiovascular and Pulmonary Rehabilitation, American Pharmacists Association, American Society for Preventive Cardiology, Association of Black Cardiologists, Preventive Cardiovascular Nurses Association, and Women. Heart: The National Coalition for Women with Heart Disease © American College of Cardiology Foundation and American Heart Association, Inc.
Citation This slide set is adapted from the 2013 ACC/AHA Guideline on the Treatment of Blood Cholesterol to Reduce Atherosclerotic Cardiovascular Risk in Adults. E-Published on November 12, 2013, available at: http: //content. onlinejacc. org/article. aspx? doi=10. 1016/j. jacc. 2013. 11. 002 and http: //circ. ahajournals. org/lookup/doi/10. 1161/01. cir. 0000437738. 63853. 7 a The full-text guidelines are also available on the following Web sites: ACC (www. cardiosource. org) and AHA (my. americanheart. org)
ACC/AHA Blood Cholesterol Guideline Panel Members. Neil J. Stone, MD, MACP, FAHA, FACC, Chair Jennifer G. Robinson, MD, MPH, FAHA, Vice Chair Alice H. Lichtenstein, DSc, FAHA, Vice Chair Anne C. Goldberg, MD, FACP, FAHA Conrad B. Blum, MD, FAHA Robert H. Eckel, MD, FAHA, FACC Daniel Levy, MD* David Gordon, MD* Donald M. Lloyd-Jones, MD, Sc. M, FACC, FAHA C. Noel Bairey Merz, MD, FAHA, FACC J. Sanford Schwartz, MD Patrick Mc. Bride, MD, MPH, FAHA Sidney C. Smith, Jr, MD, FACC, FAHA Karol Watson, MD, Ph. D, FACC, FAHA Susan T. Shero, MS, RN* Peter W. F. Wilson, MD, FAHA *Ex-Officio Members Methodology Members Karen M. Eddleman, BS Nicole M. Jarrett Acknowledgeme Ken nts La. Bresh, MD National Heart, Lung, and Blood Institute Lev Nevo, MD Janusz Wnek, Ph. D Glen Bennett, M. P. H. Denise Simons-Morton, MD, Ph. D
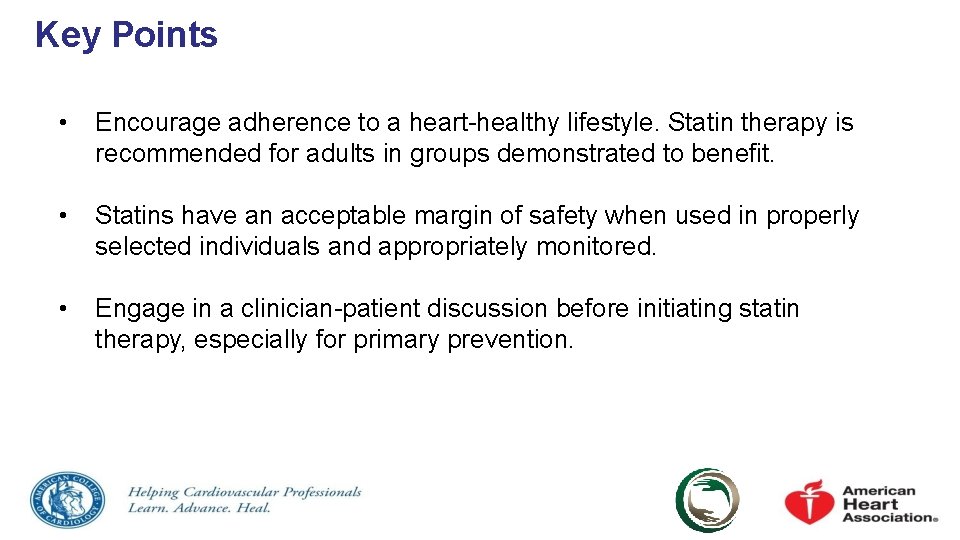
Key Points • Encourage adherence to a heart-healthy lifestyle. Statin therapy is recommended for adults in groups demonstrated to benefit. • Statins have an acceptable margin of safety when used in properly selected individuals and appropriately monitored. • Engage in a clinician-patient discussion before initiating statin therapy, especially for primary prevention.
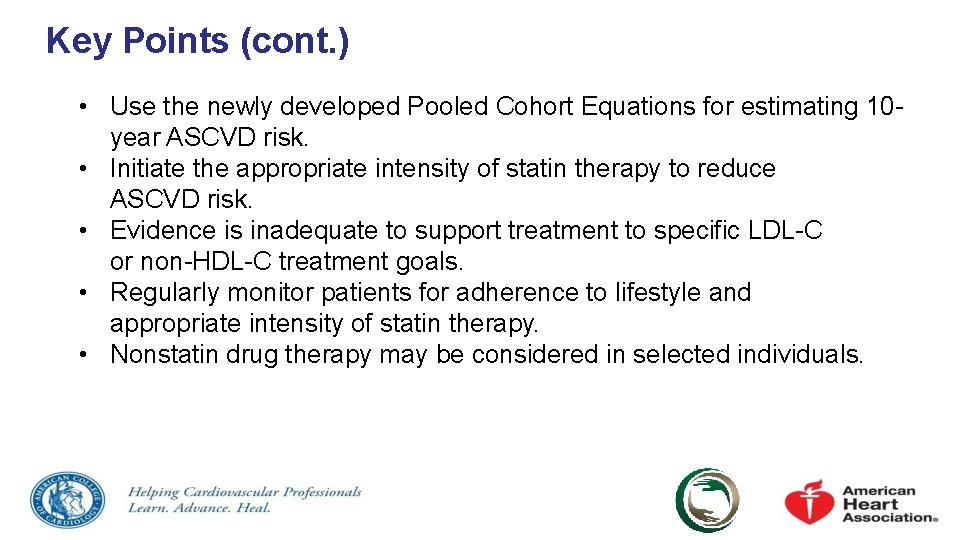
Key Points (cont. ) • Use the newly developed Pooled Cohort Equations for estimating 10 year ASCVD risk. • Initiate the appropriate intensity of statin therapy to reduce ASCVD risk. • Evidence is inadequate to support treatment to specific LDL-C or non-HDL-C treatment goals. • Regularly monitor patients for adherence to lifestyle and appropriate intensity of statin therapy. • Nonstatin drug therapy may be considered in selected individuals.
Conflict of Industry Interest/Relationships With • Panel members disclosed conflict of interest information to the full panel in advance of the deliberations • Members with conflicts recused themselves from voting on any aspect of the guideline where a conflict might exist • All 16 members of the NHLBI ATP IV Panel transitioned to the ACC/AHA guideline Expert Panel • Independent contractors performed the systematic review with the assistance of the Expert Panel and provided methodological guidance to the Expert Panel
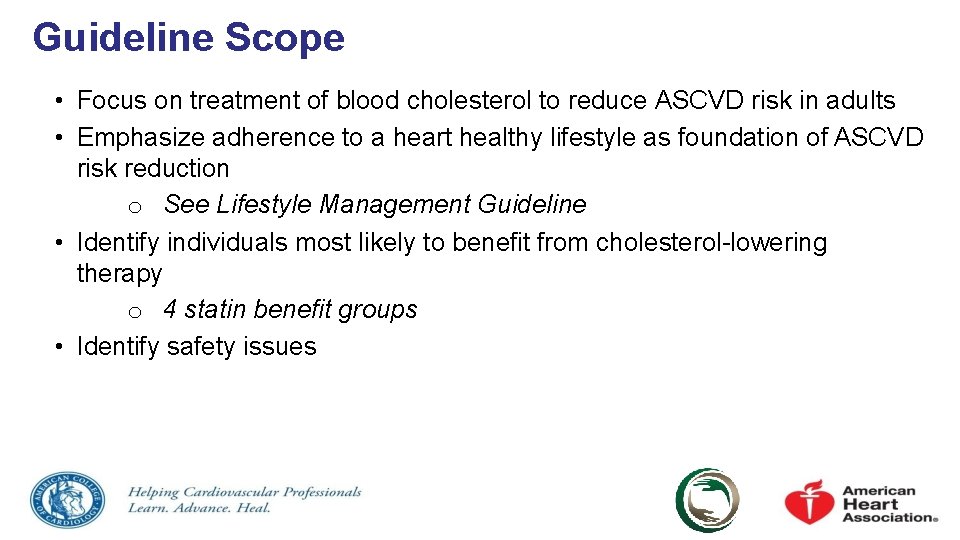
Guideline Scope • Focus on treatment of blood cholesterol to reduce ASCVD risk in adults • Emphasize adherence to a heart healthy lifestyle as foundation of ASCVD risk reduction o See Lifestyle Management Guideline • Identify individuals most likely to benefit from cholesterol-lowering therapy o 4 statin benefit groups • Identify safety issues
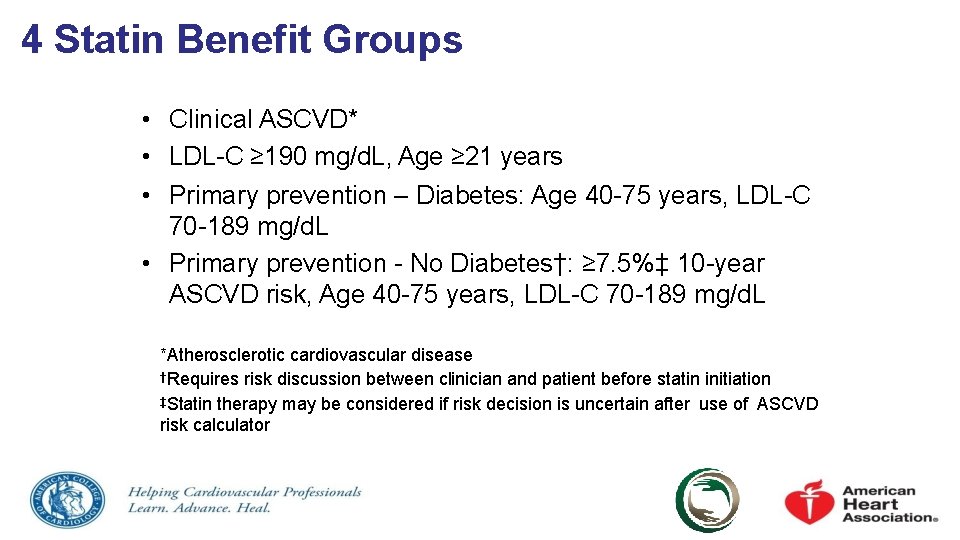
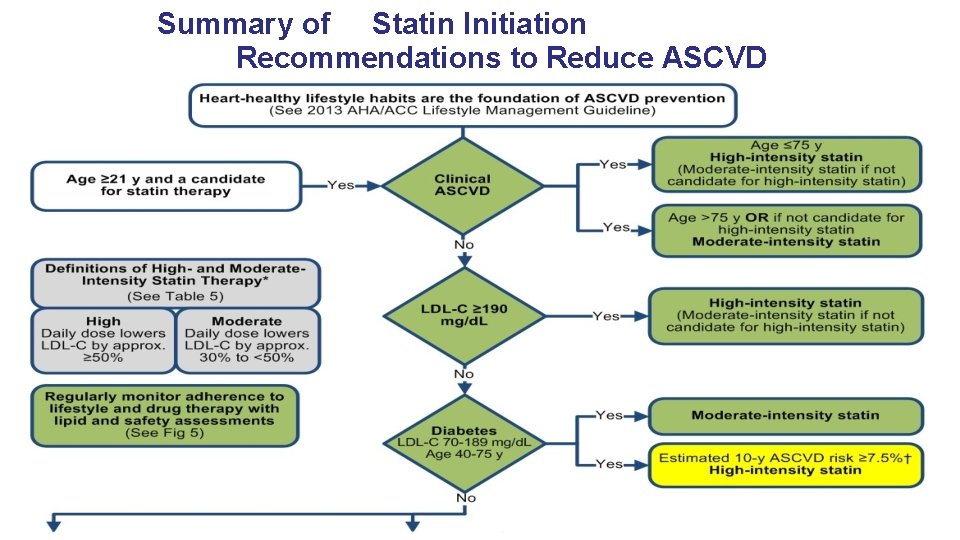
4 Statin Benefit Groups • Clinical ASCVD* • LDL-C ≥ 190 mg/d. L, Age ≥ 21 years • Primary prevention – Diabetes: Age 40 -75 years, LDL-C 70 -189 mg/d. L • Primary prevention - No Diabetes†: ≥ 7. 5%‡ 10 -year ASCVD risk, Age 40 -75 years, LDL-C 70 -189 mg/d. L *Atherosclerotic cardiovascular disease †Requires risk discussion between clinician and patient before statin initiation ‡Statin therapy may be considered if risk decision is uncertain after use of ASCVD risk calculator
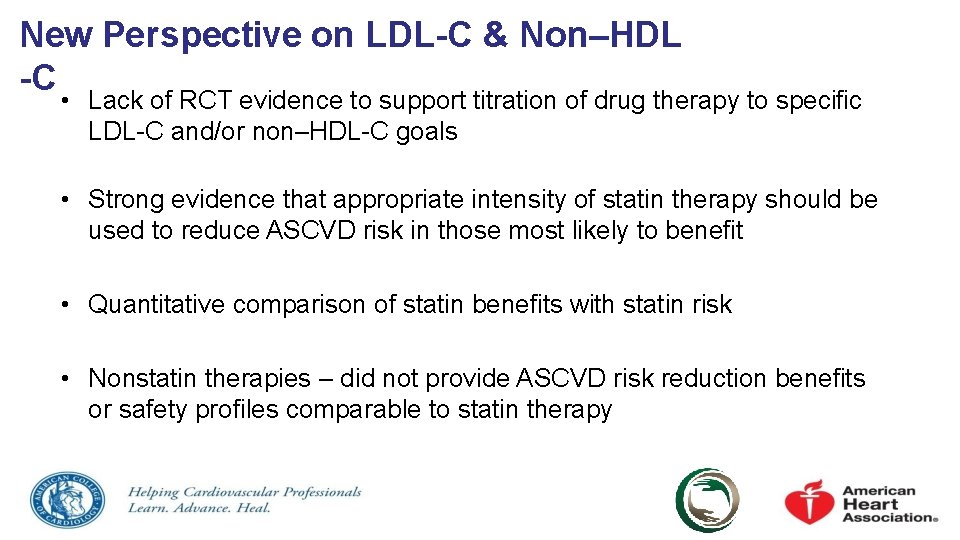
New Perspective on LDL-C & Non–HDL -C • Lack of RCT evidence to support titration of drug therapy to specific LDL-C and/or non–HDL-C goals • Strong evidence that appropriate intensity of statin therapy should be used to reduce ASCVD risk in those most likely to benefit • Quantitative comparison of statin benefits with statin risk • Nonstatin therapies – did not provide ASCVD risk reduction benefits or safety profiles comparable to statin therapy
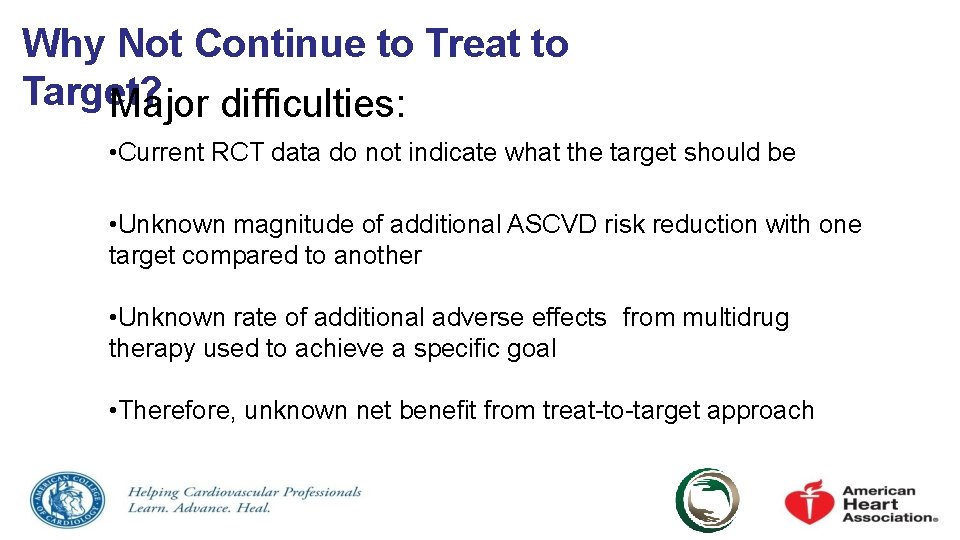
Why Not Continue to Treat to Target? Major difficulties: • Current RCT data do not indicate what the target should be • Unknown magnitude of additional ASCVD risk reduction with one target compared to another • Unknown rate of additional adverse effects from multidrug therapy used to achieve a specific goal • Therefore, unknown net benefit from treat-to-target approach
Summary of Statin Initiation Recommendations to Reduce ASCVD Risk (Revised Figure)
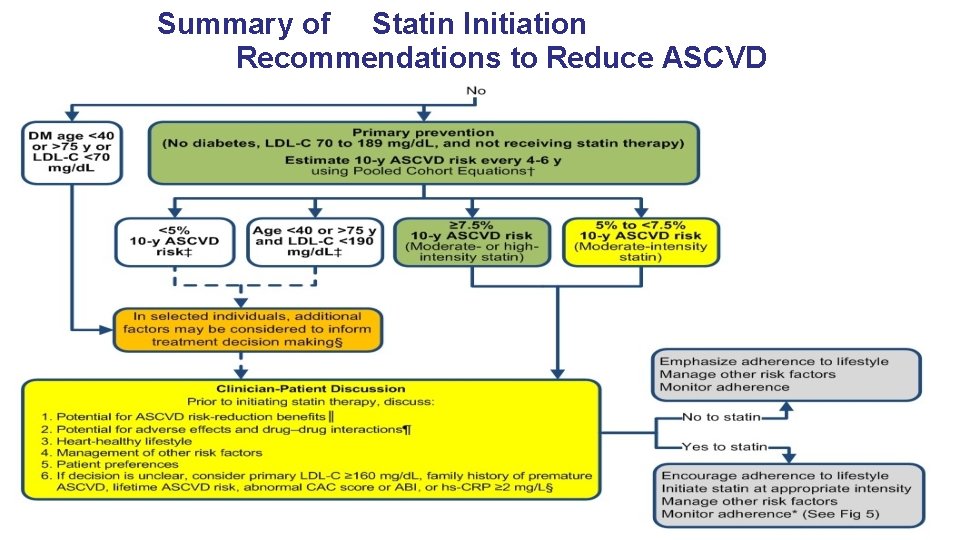
Summary of Statin Initiation Recommendations to Reduce ASCVD Risk (Revised Figure)
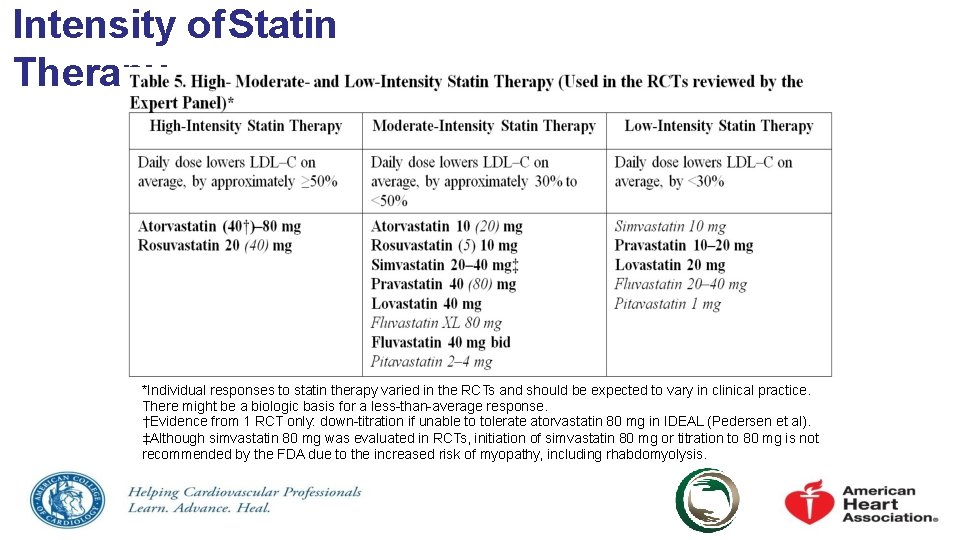
Intensity of. Statin Therapy *Individual responses to statin therapy varied in the RCTs and should be expected to vary in clinical practice. There might be a biologic basis for a less-than-average response. †Evidence from 1 RCT only: down-titration if unable to tolerate atorvastatin 80 mg in IDEAL (Pedersen et al). ‡Although simvastatin 80 mg was evaluated in RCTs, initiation of simvastatin 80 mg or titration to 80 mg is not recommended by the FDA due to the increased risk of myopathy, including rhabdomyolysis.
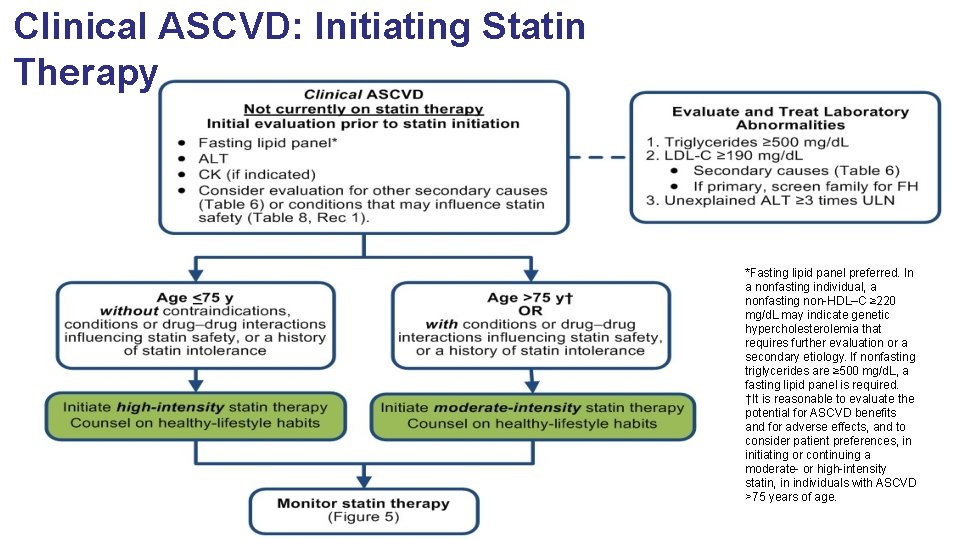
Clinical ASCVD: Initiating Statin Therapy *Fasting lipid panel preferred. In a nonfasting individual, a nonfasting non-HDL–C ≥ 220 mg/d. L may indicate genetic hypercholesterolemia that requires further evaluation or a secondary etiology. If nonfasting triglycerides are ≥ 500 mg/d. L, a fasting lipid panel is required. †It is reasonable to evaluate the potential for ASCVD benefits and for adverse effects, and to consider patient preferences, in initiating or continuing a moderate- or high-intensity statin, in individuals with ASCVD >75 years of age.
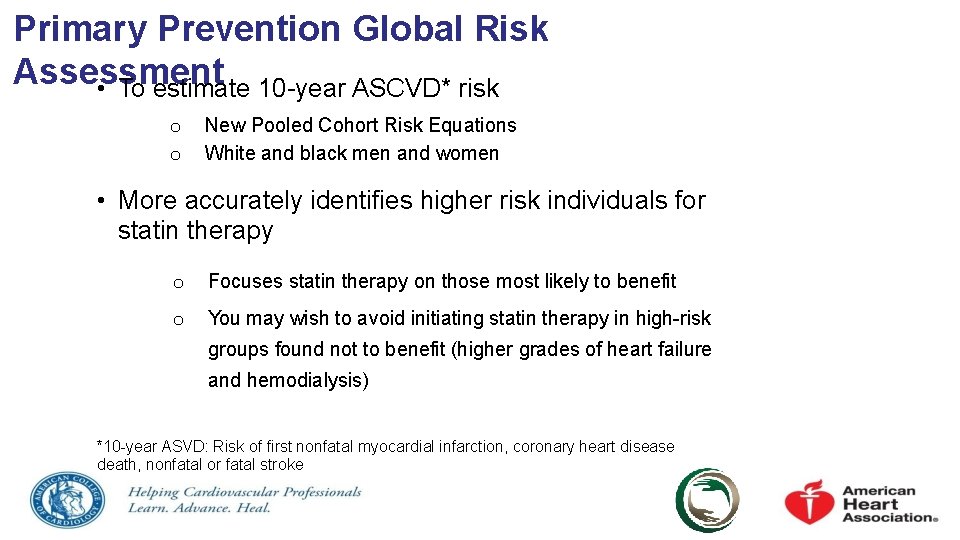
Primary Prevention Global Risk Assessment • To estimate 10 -year ASCVD* risk o o New Pooled Cohort Risk Equations White and black men and women • More accurately identifies higher risk individuals for statin therapy o Focuses statin therapy on those most likely to benefit o You may wish to avoid initiating statin therapy in high-risk groups found not to benefit (higher grades of heart failure and hemodialysis) *10 -year ASVD: Risk of first nonfatal myocardial infarction, coronary heart disease death, nonfatal or fatal stroke
Primary Prevention Statin Therapy • Thresholds for initiating statin therapy derived from 3 exclusively primary prevention RCTs • Before initiating statin therapy, clinicians and patients engage in a discussion of the potential for ASCVD risk reduction benefits, potential for adverse effects, drug interactions, and patient preferences
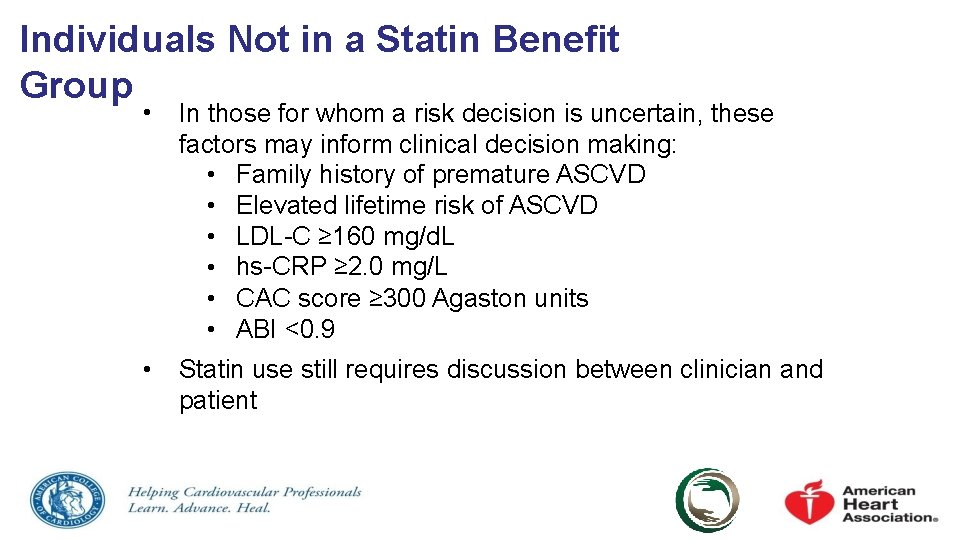
Individuals Not in a Statin Benefit Group • In those for whom a risk decision is uncertain, these factors may inform clinical decision making: • Family history of premature ASCVD • Elevated lifetime risk of ASCVD • LDL-C ≥ 160 mg/d. L • hs-CRP ≥ 2. 0 mg/L • CAC score ≥ 300 Agaston units • ABI <0. 9 • Statin use still requires discussion between clinician and patient
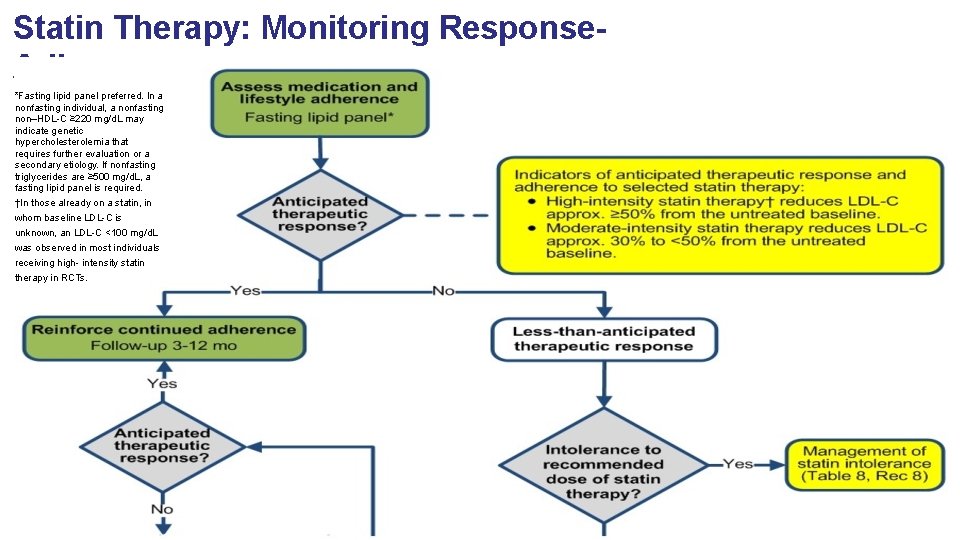
Statin Therapy: Monitoring Response. Adherence *Fasting lipid panel preferred. In a nonfasting individual, a nonfasting non–HDL-C ≥ 220 mg/d. L may indicate genetic hypercholesterolemia that requires further evaluation or a secondary etiology. If nonfasting triglycerides are ≥ 500 mg/d. L, a fasting lipid panel is required. †In those already on a statin, in whom baseline LDL-C is unknown, an LDL-C <100 mg/d. L was observed in most individuals receiving high- intensity statin therapy in RCTs.
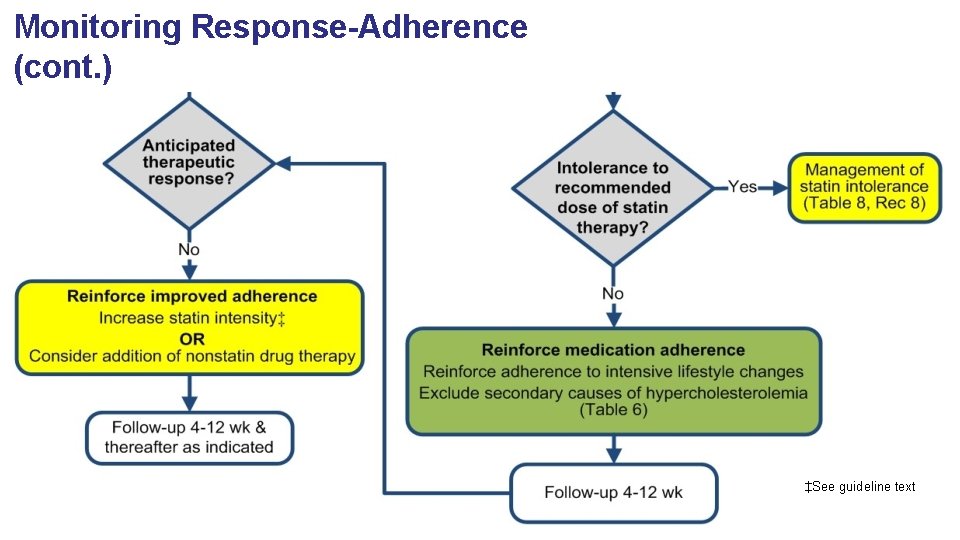
Monitoring Response-Adherence (cont. ) ‡See guideline text
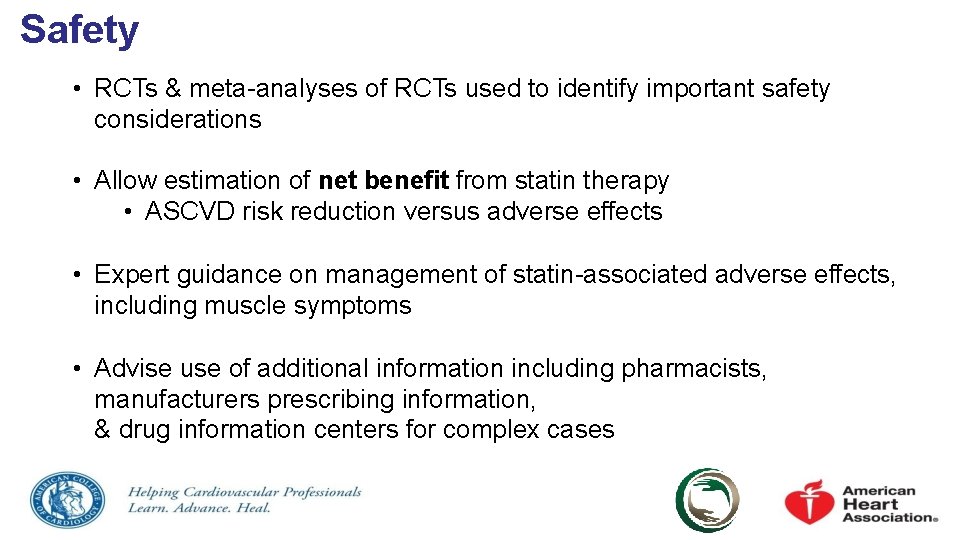
Safety • RCTs & meta-analyses of RCTs used to identify important safety considerations • Allow estimation of net benefit from statin therapy • ASCVD risk reduction versus adverse effects • Expert guidance on management of statin-associated adverse effects, including muscle symptoms • Advise use of additional information including pharmacists, manufacturers prescribing information, & drug information centers for complex cases
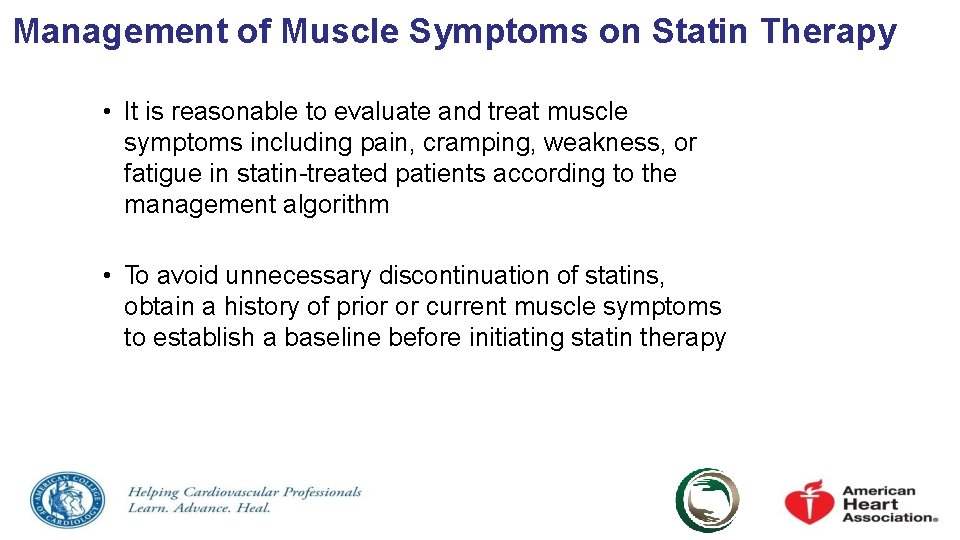
Management of Muscle Symptoms on Statin Therapy • It is reasonable to evaluate and treat muscle symptoms including pain, cramping, weakness, or fatigue in statin-treated patients according to the management algorithm • To avoid unnecessary discontinuation of statins, obtain a history of prior or current muscle symptoms to establish a baseline before initiating statin therapy
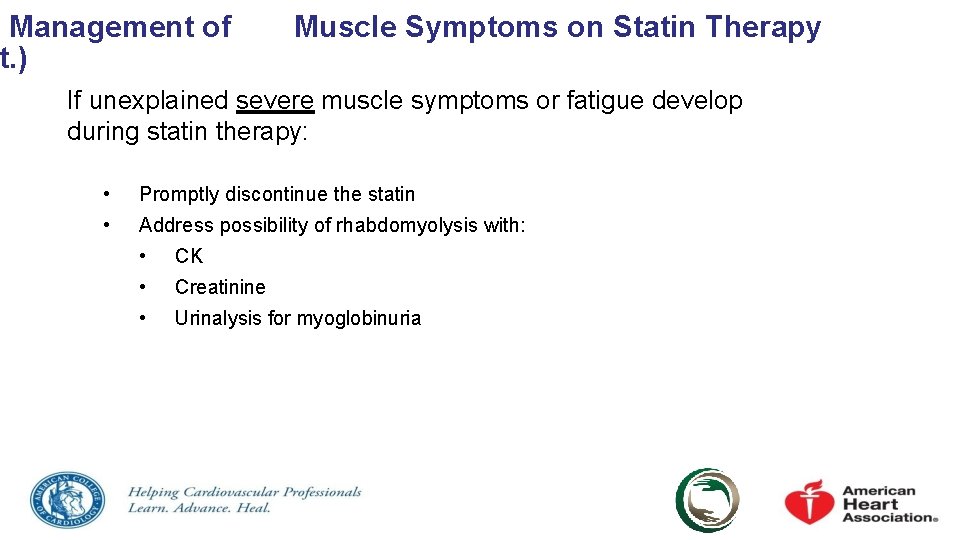
Management of t. ) Muscle Symptoms on Statin Therapy If unexplained severe muscle symptoms or fatigue develop during statin therapy: • • Promptly discontinue the statin Address possibility of rhabdomyolysis with: • • • CK Creatinine Urinalysis for myoglobinuria
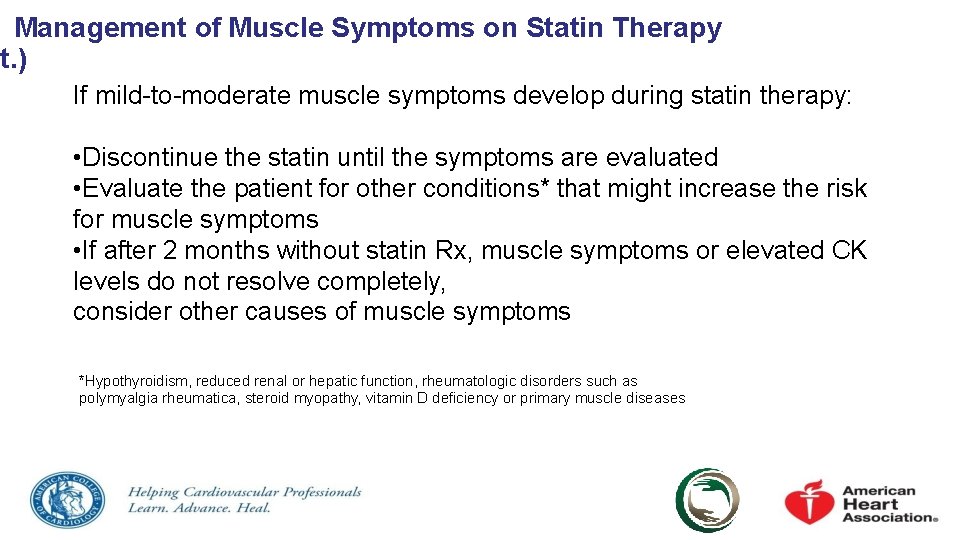
Management of Muscle Symptoms on Statin Therapy nt. ) If mild-to-moderate muscle symptoms develop during statin therapy: • Discontinue the statin until the symptoms are evaluated • Evaluate the patient for other conditions* that might increase the risk for muscle symptoms • If after 2 months without statin Rx, muscle symptoms or elevated CK levels do not resolve completely, consider other causes of muscle symptoms *Hypothyroidism, reduced renal or hepatic function, rheumatologic disorders such as polymyalgia rheumatica, steroid myopathy, vitamin D deficiency or primary muscle diseases
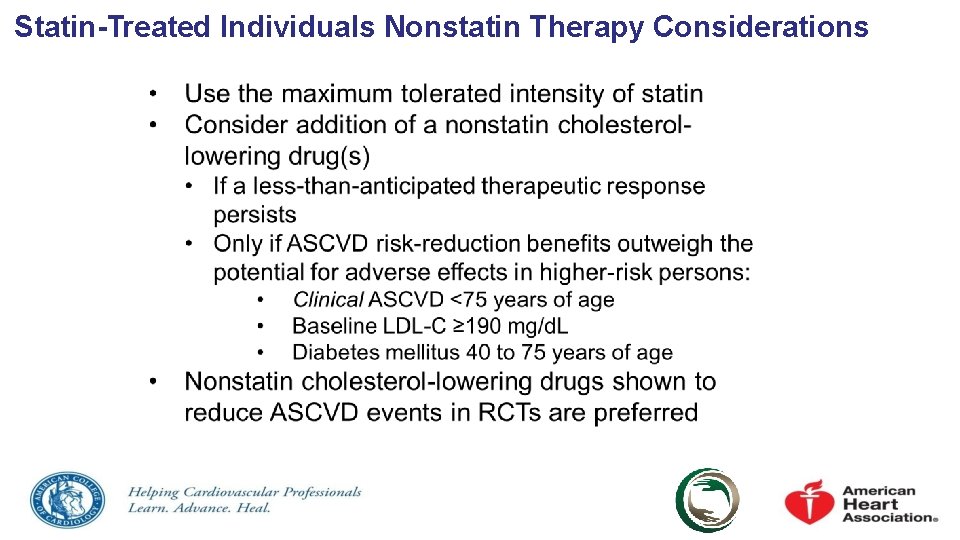
Statin-Treated Individuals Nonstatin Therapy Considerations
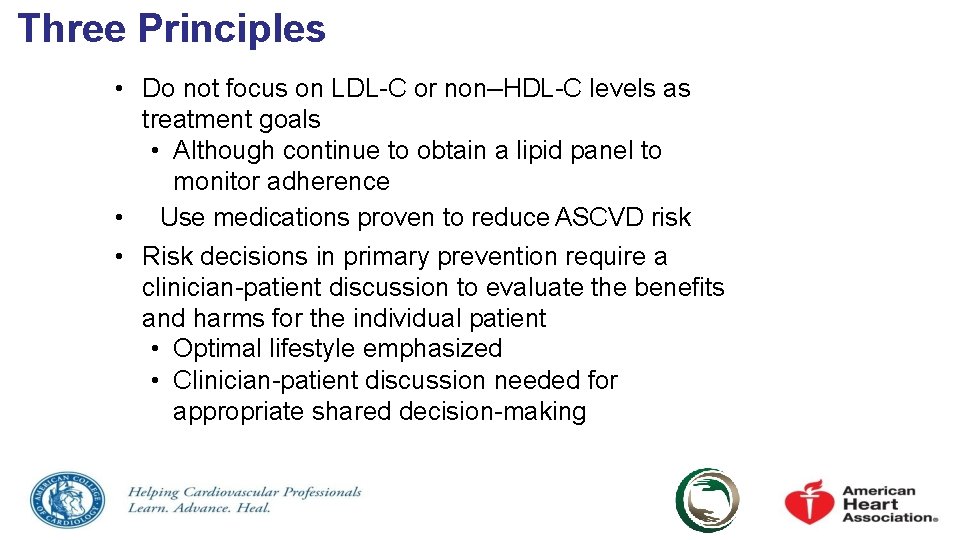
Three Principles • Do not focus on LDL-C or non–HDL-C levels as treatment goals • Although continue to obtain a lipid panel to monitor adherence • Use medications proven to reduce ASCVD risk • Risk decisions in primary prevention require a clinician-patient discussion to evaluate the benefits and harms for the individual patient • Optimal lifestyle emphasized • Clinician-patient discussion needed for appropriate shared decision-making
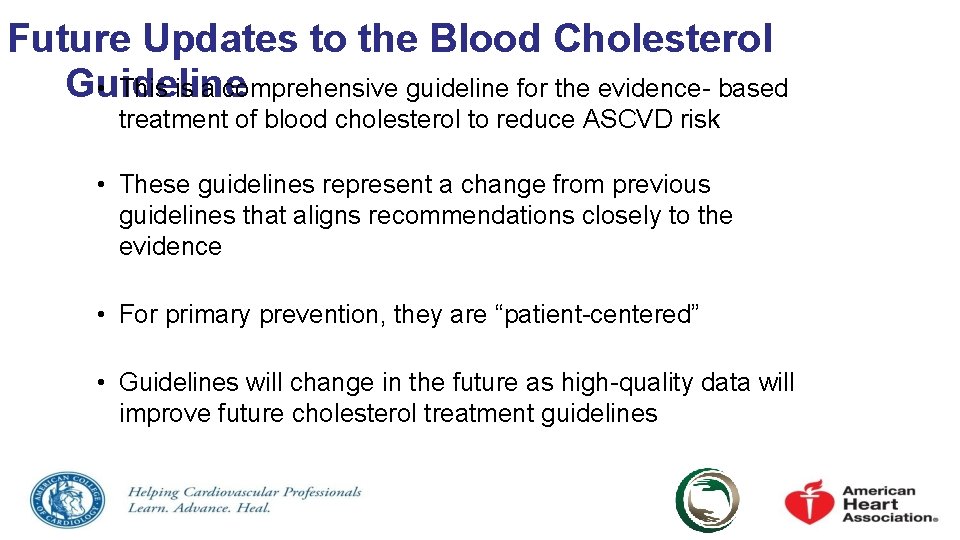
Future Updates to the Blood Cholesterol Guideline • This is a comprehensive guideline for the evidence- based treatment of blood cholesterol to reduce ASCVD risk • These guidelines represent a change from previous guidelines that aligns recommendations closely to the evidence • For primary prevention, they are “patient-centered” • Guidelines will change in the future as high-quality data will improve future cholesterol treatment guidelines
2013 Preven tion Guidelines Tools RISK CALCULATOR Helping Cardiovascular Professionals Learn. Advance. Heal.
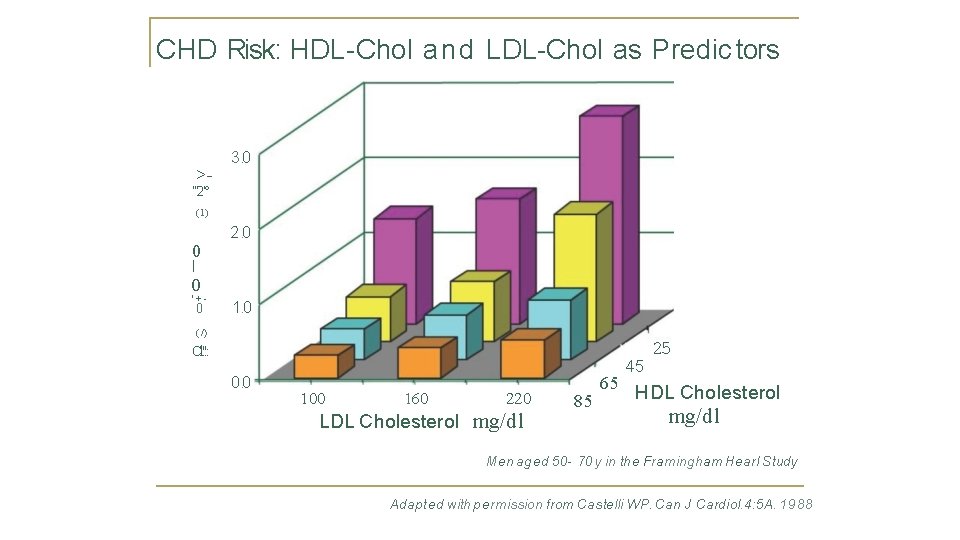
CHD Risk: HDL-Chol a n d LDL-Chol as Predic tors >- 3. 0 "'2'° (1) 0 2. 0 I 0 '+- 0 1. 0 (/) Cl'. '. : 0. 0 100 160 220 LDL Cholesterol mg/dl 85 65 45 25 HDL Cholesterol mg/dl Men aged 50 - 70 y in the Framingham Hearl Study Adapted with p ermission from Castelli WP. Can J Cardiol. 4: 5 A. 1988
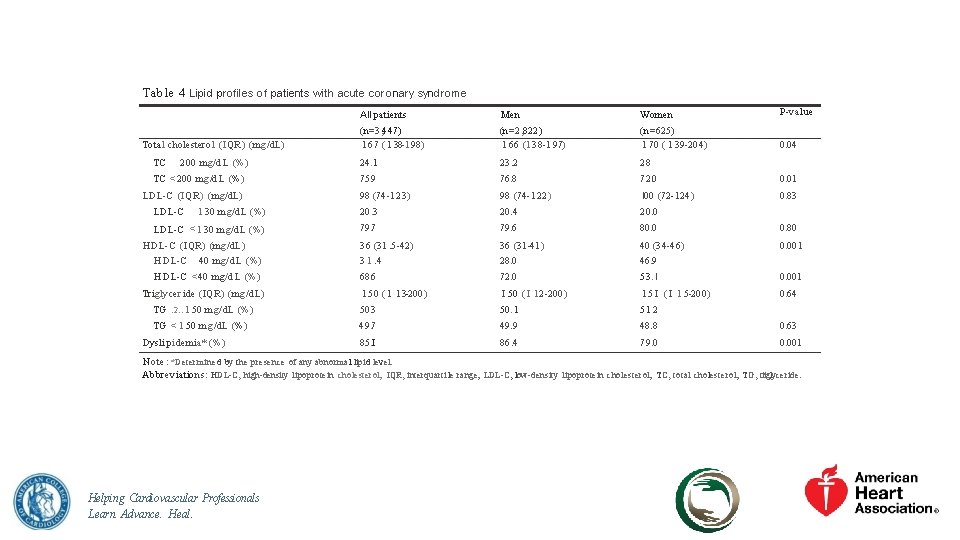
Table 4 Lipid profiles of patients w ith acute coro nary syndrome Total cholestero l (IQR) (mg/d. L) TC 200 mg/d L (%) TC <200 mg/d L (%) LDL-C (IQR) (mg/d. L) LDL-C 1 30 mg/d. L (%) LDL-C < 1 30 mg/d. L (%) H DL-C (IQR) (mg/d. L) H DL-C 40 mg/d L (%) H DL-C <40 mg/d L (%) Triglyceride (IQR) (mg/d L) TG : 2: : 1 50 mg/d. L (%) TG < 1 50 mg/d. L (%) Dysli pidemia* (%) All patients Men Women P-val ue (n=3, 447) 1 67 ( 1 38 -1 98) (n=2, 822) 1 66 (138 -197) (n=625) 1 70 ( 1 39 -204) 0. 04 24. 1 23. 2 28 75. 9 76. 8 72. 0 0. 01 98 (74 -123) 20. 3 98 (74 -122) 20. 4 I 00 (72 -124) 0. 83 20. 0 79. 7 79. 6 80. 0 0. 80 36 (31. 5 -42) 3 1. 4 36 (31 -41) 28. 0 40 (34 -46) 46. 9 0. 001 68. 6 72. 0 53. I 0. 001 1 50 ( 1 1 3 -200) 50. 3 I 50 ( I 12 -200) 50. 1 1 5 I ( I 1 5 -200) 51. 2 0. 64 49. 7 49. 9 48. 8 0. 63 85. I 86. 4 79. 0 0. 001 Note: *Determine d by the presence of any abnorma l lipi d level. Abbreviations: HDL-C, high-density lipoprotein cholesterol; IQR, interquarti le range; LDL-C, low-density lipoprotein cholesterol; TC, total cholesterol; TG, ti·iglyceride. Helping Cardiovascular Professionals Learn. Advance. Heal.
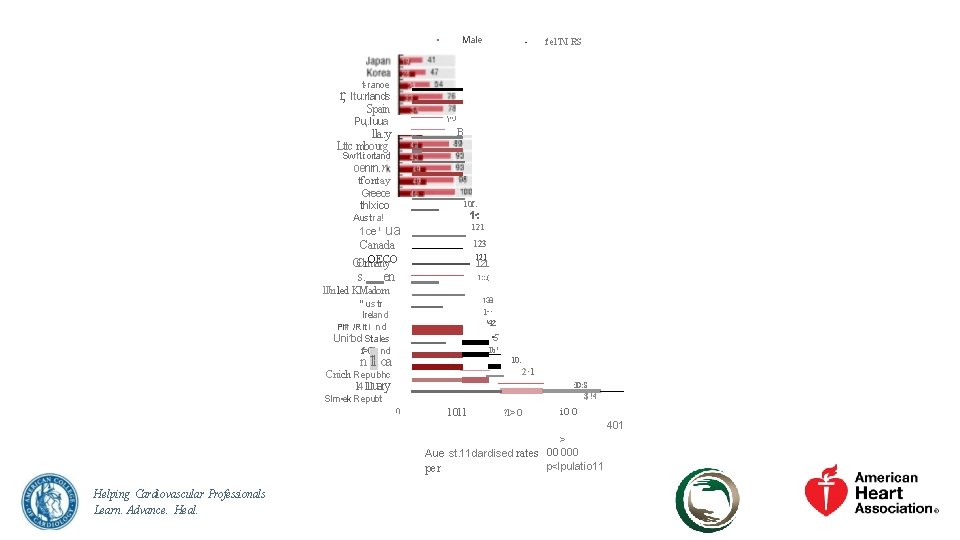
• Male - fel. TI RS t-ranoe r, ltu: rlands Spain Pu, . luua 'j!!J B lla. : y Ltt. c mbourg • Sw 11. i: ortand oenrn. r tf ont·ay Greece 10 f. thlxico Aust ra! 1 ce 1 1·: 121 ua 123 Canada OECO GC!rmany s. 121 en 1; : . ( 11 J. ruled KMadom 138 "ustr Ireland Plf!k' /Rlt l nd Uni 1 od Stales f>OI nd 1 • · '42 • 5 lb' n 11· oa 10: 2· 1 Cnich Repubhc 14111 uary Slm • ek Repubt : JD: S $ !4 () 1011 ? l>O i. OO 401 > Aue st. 11 dardised rates 00 000 p<lpulatio 11 per Helping Cardiovascular Professionals Learn. Advance. Heal.
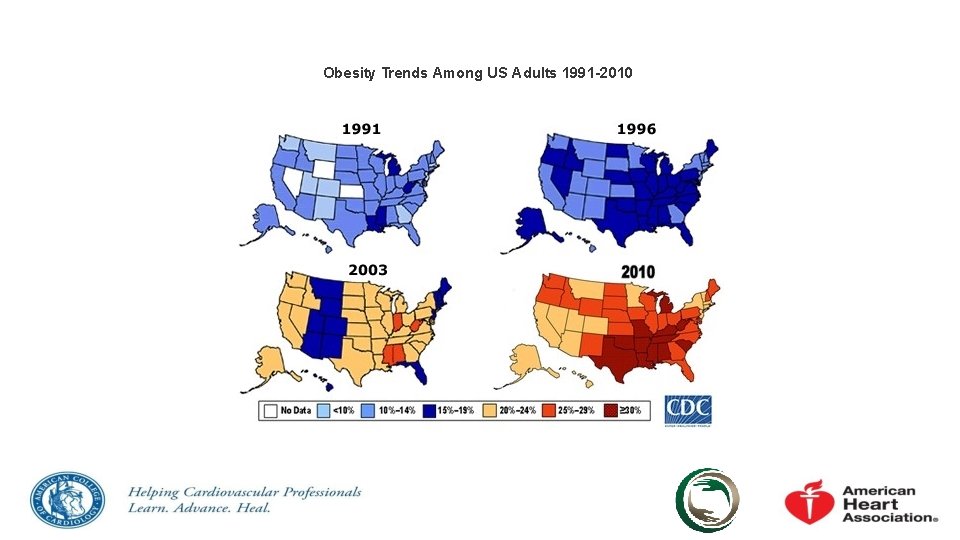
Obesity Trends Among US Adults 1991 -2010
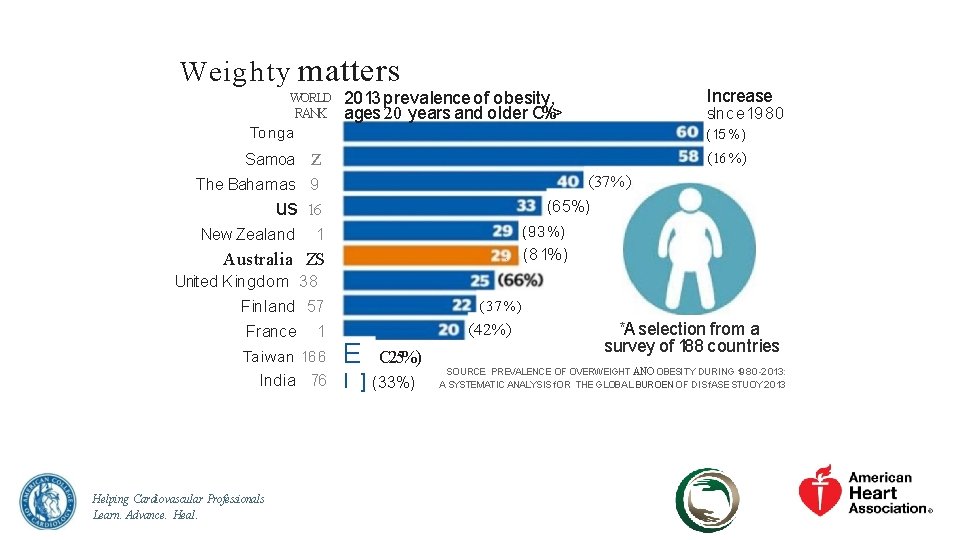
Weighty matters WORLD RANK Increase 2013 prevalence of obesity, ages 20 years and older C%> slnce 19 80 Tonga Samoa (15%) z (16 %) (37%) The Bahamas 9 us 16 New Zealand 1 (93%) Australia ZS . (81%) (65%) Unit ed K ingdom 38 Finland 57 France 1 Taiwan 166 Ind ia 76 Helping Cardiovascular Professionals Learn. Advance. Heal. (3 7 % ) (42%) E I ] C 25%) (33%) *A selection from a survey of 188 countries SOURCE. PREVALENCE OFOVERWEIGHT ANO OBESITY DURING 1980 -2013: A SYSTEMATIC ANALYSIS f. OR THE GLOBAL BUROEN OF DISf. ASE STUOY 2013
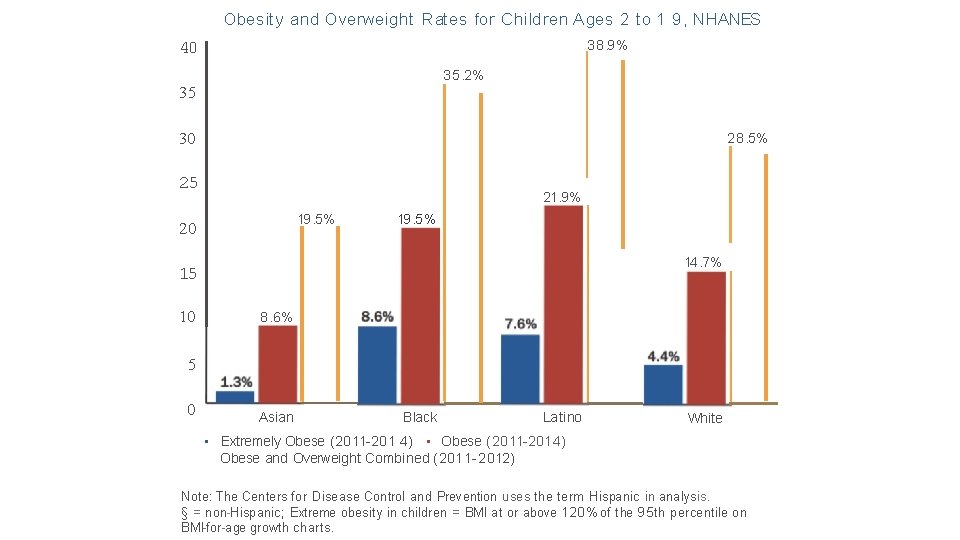
Obesity and Overweight Rates for Chi ldren Ages 2 to 1 9, NHANES 38. 9% 40 35. 2% 35 30 28. 5% 25 21. 9% 19. 5% 20 19. 5% 14. 7% 15 10 8. 6% 5 0 Asian Black Latino White • Extremely Obese (2011 -201 4) • Obese (2011 -2014) Obese and Overweight Combined (2011 -2012) Note: The Centers for Disease Control and Prevention uses the term Hispanic in analysis. § = non-Hispanic; Extreme obesity in children = BMI at or above 120% of t he 95 th percentile on BMl-for-age growth charts.
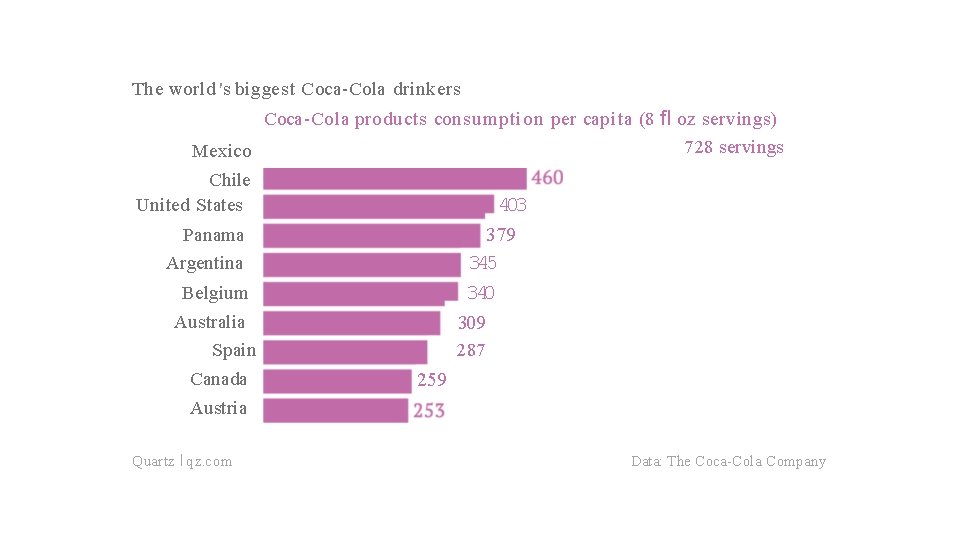
The world 's biggest Coca-Cola drinkers Coca-Cola products consumption per capita (8 fl oz servings) 728 servings Mexico Chile United States 403 Panama Argentina Belgium Australia Spain Canada 379 345 340 309 287 259 Austria Quartz I qz. com Data: The Coca-Cola Company
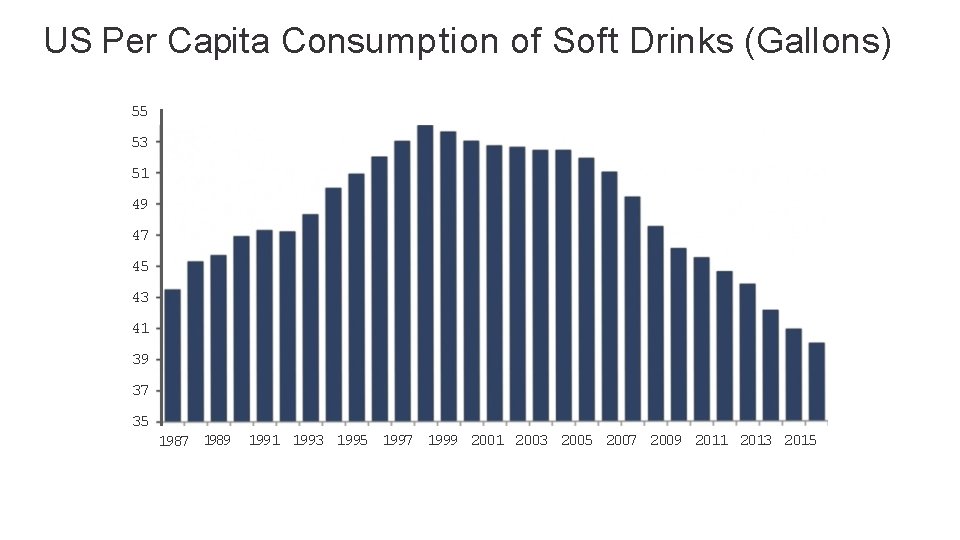
US Per Capita Consumption of Soft Drinks (Gallons) 55 53 51 49 47 45 43 41 39 37 35 1987 1989 1991 1993 1995 1997 1999 2001 2003 2005 2007 2009 2011 2013 2015
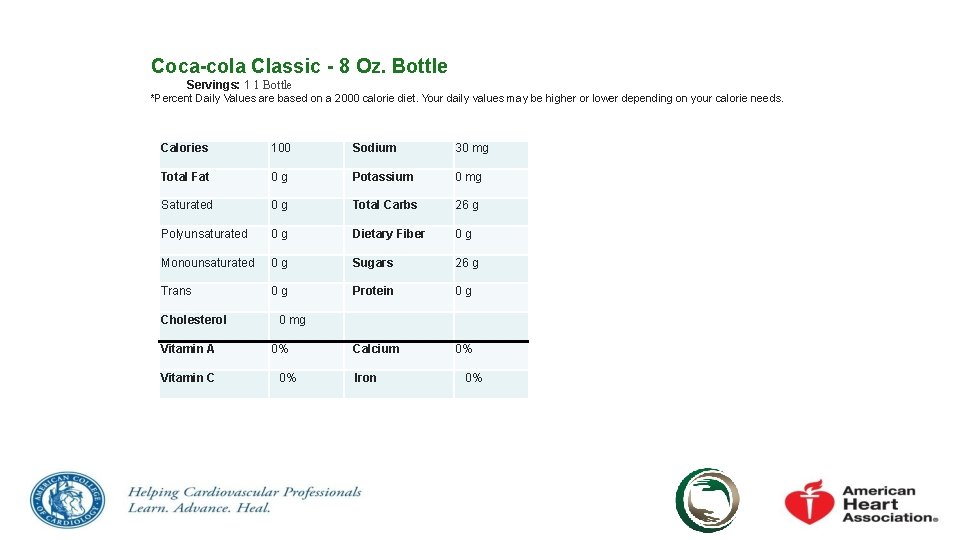
Coca-cola Classic - 8 Oz. Bottle Servings: 1 1 Bottle *Percent Daily Values are based on a 2000 calorie diet. Your daily values may be higher or lower depending on your calorie needs. Calories 100 Sodium 30 mg Total Fat 0 g Potassium 0 mg Saturated 0 g Total Carbs 26 g Polyunsaturated 0 g Dietary Fiber 0 g Monounsaturated 0 g Sugars 26 g Trans 0 g Protein 0 g Calcium 0% Cholesterol Vitamin A Vitamin C 0 mg 0% 0% Iron 0%
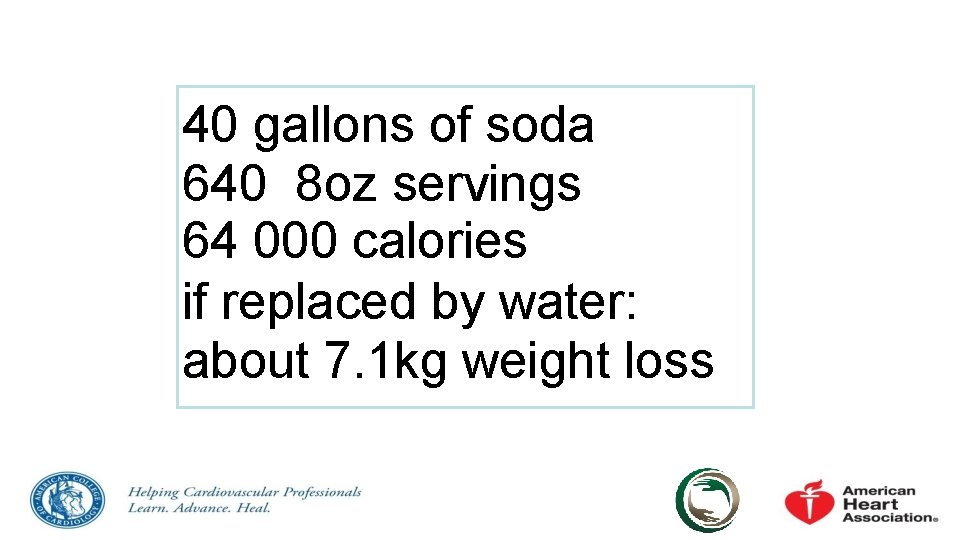
40 gallons of soda 640 8 oz servings 64 000 calories if replaced by water: about 7. 1 kg weight loss
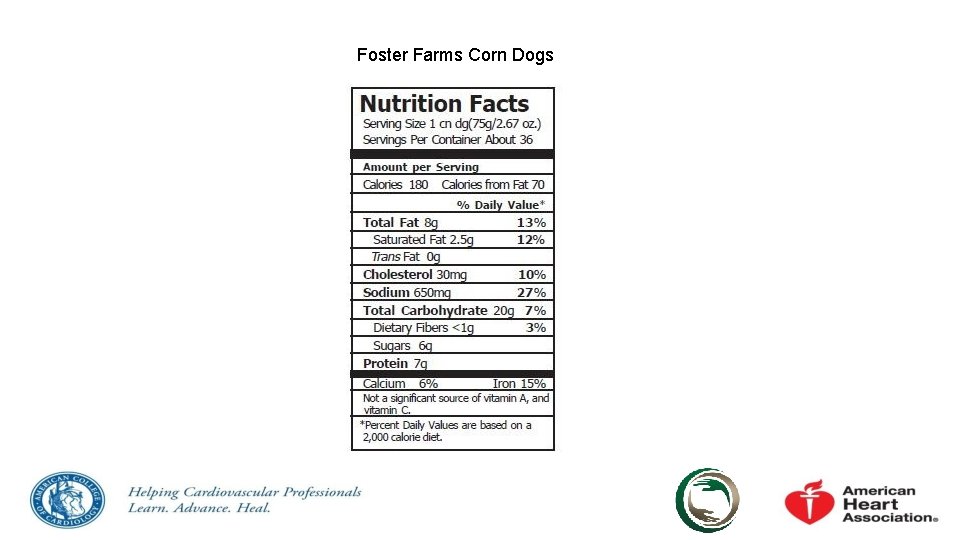
Foster Farms Corn Dogs
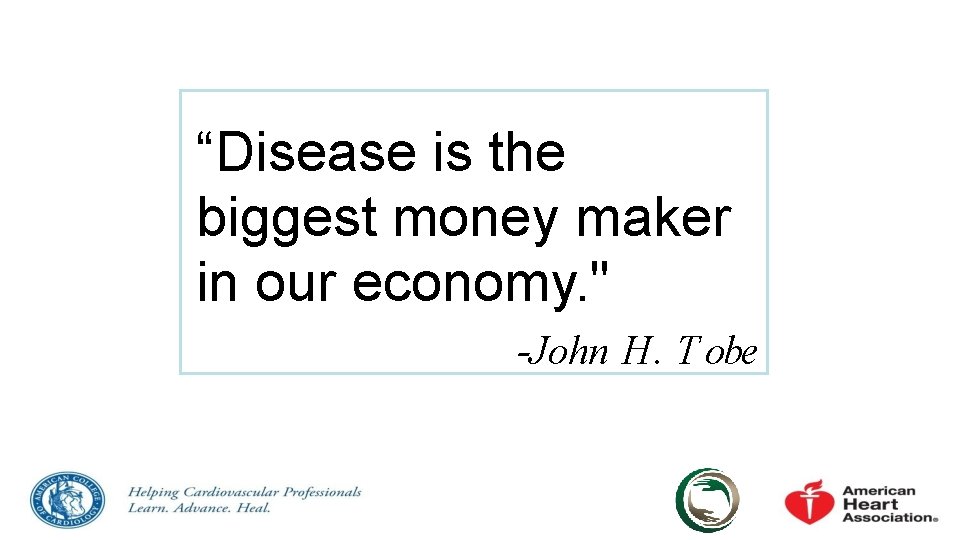
“Disease is the biggest money maker in our economy. " -John H. T obe
MONSANTO B I O T E CHN O L O GY innovation - collabora ti on - spee d m Mcdonald's Kraft Con. Agra @ Fooas Food you love Helping Cardiovascular Professionals Learn. Advance. Heal.
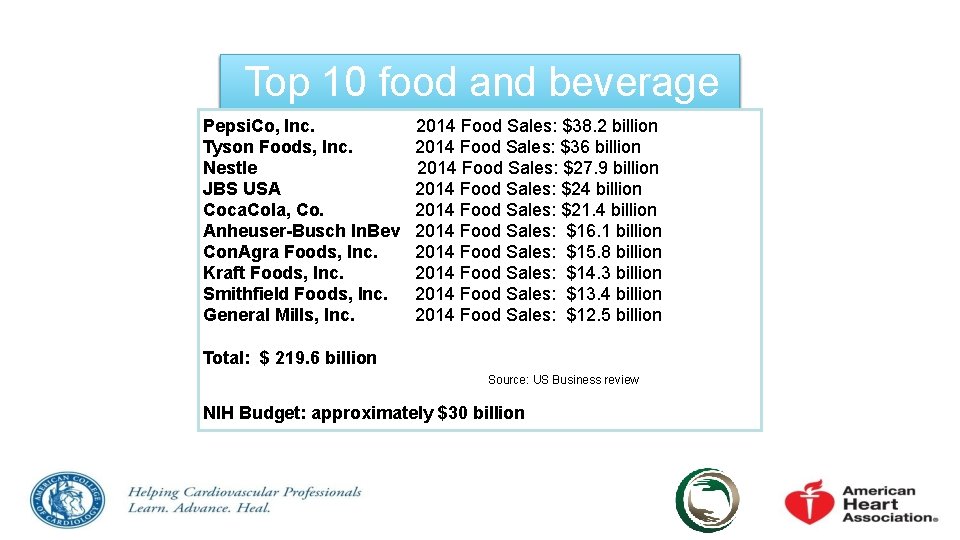
Top 10 food and beverage Pepsi. Co, Inc. 2014 Food Sales: $38. 2 billion in the USA Tysonmanufactures Foods, Inc. 2014 Food Sales: $36 billion Nestle JBS USA Coca. Cola, Co. Anheuser-Busch In. Bev Con. Agra Foods, Inc. Kraft Foods, Inc. Smithfield Foods, Inc. General Mills, Inc. 2014 Food Sales: $27. 9 billion 2014 Food Sales: $24 billion 2014 Food Sales: $21. 4 billion 2014 Food Sales: $16. 1 billion 2014 Food Sales: $15. 8 billion 2014 Food Sales: $14. 3 billion 2014 Food Sales: $13. 4 billion 2014 Food Sales: $12. 5 billion Total: $ 219. 6 billion Source: US Business review NIH Budget: approximately $30 billion
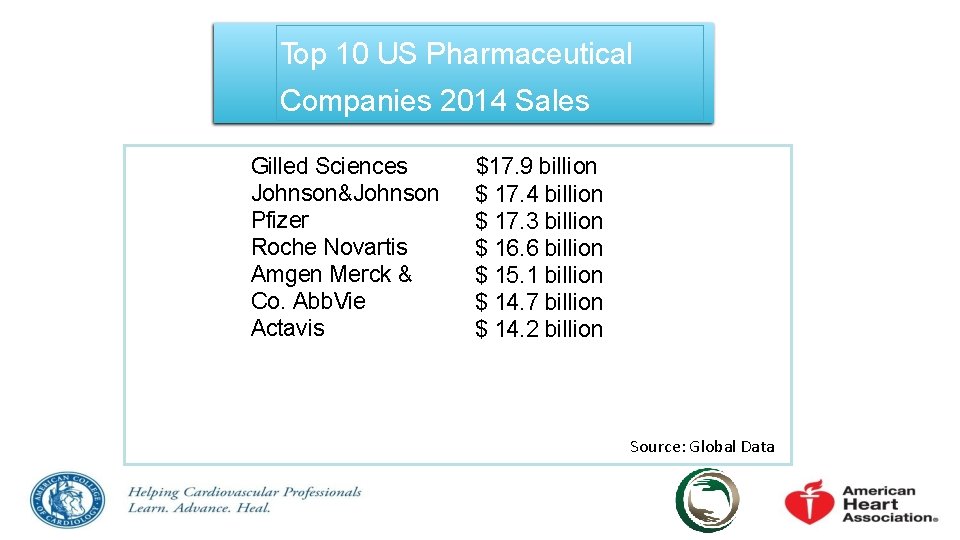
Top 10 US Pharmaceutical Companies 2014 Sales Gilled Sciences Johnson&Johnson Pfizer Roche Novartis Amgen Merck & Co. Abb. Vie Actavis $17. 9 billion $ 17. 4 billion $ 17. 3 billion $ 16. 6 billion $ 15. 1 billion $ 14. 7 billion $ 14. 2 billion Source: Global Data
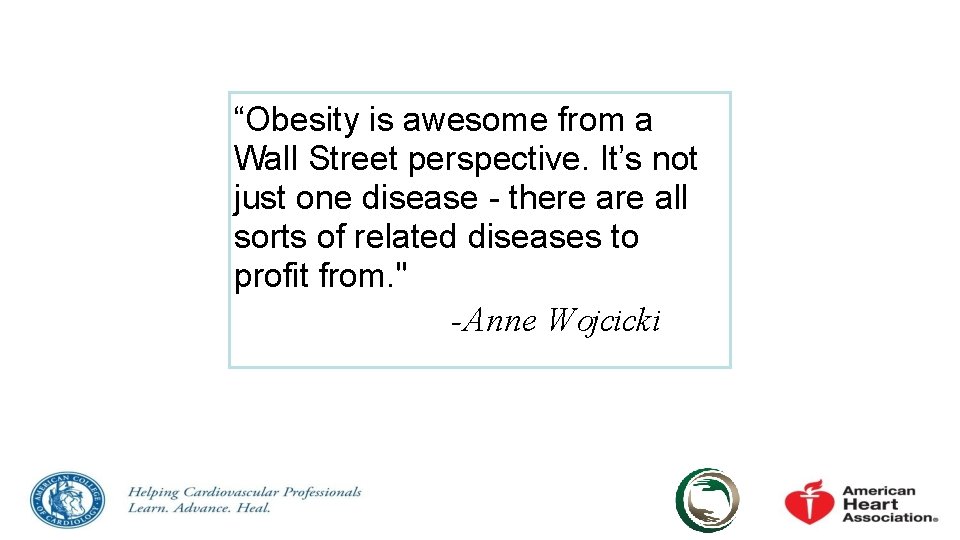
“Obesity is awesome from a Wall Street perspective. It’s not just one disease - there all sorts of related diseases to profit from. " -Anne Wojcicki
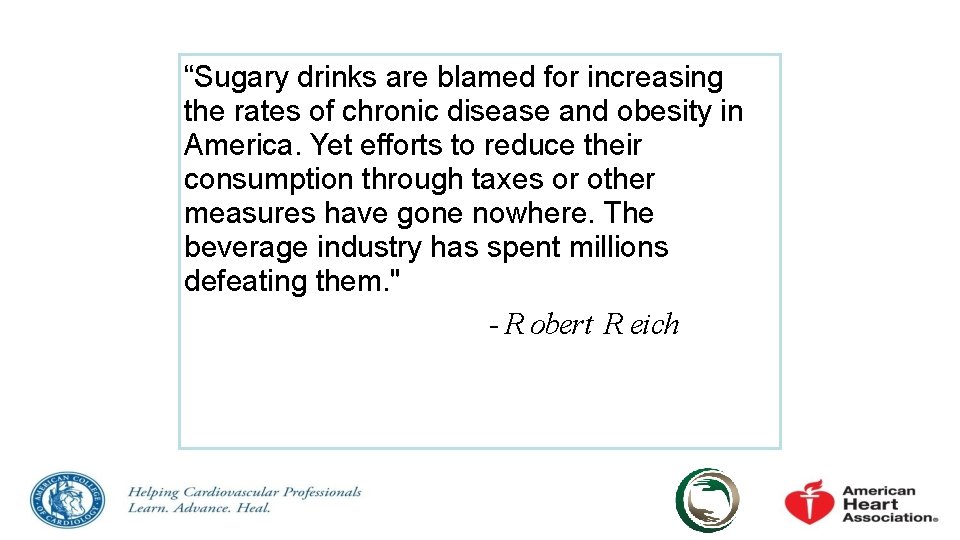
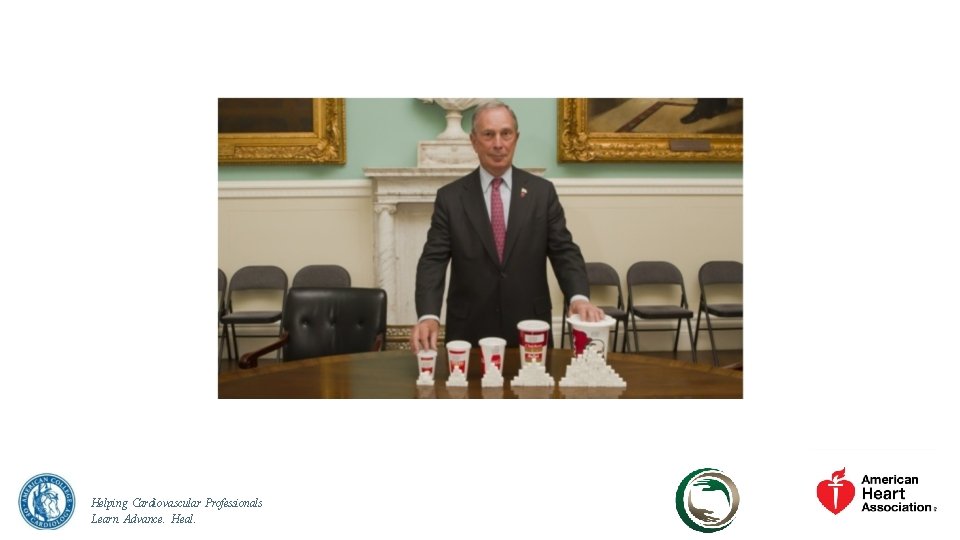
“Sugary drinks are blamed for increasing the rates of chronic disease and obesity in America. Yet efforts to reduce their consumption through taxes or other measures have gone nowhere. The beverage industry has spent millions defeating them. " - R obert R eich
Helping Cardiovascular Professionals Learn. Advance. Heal.
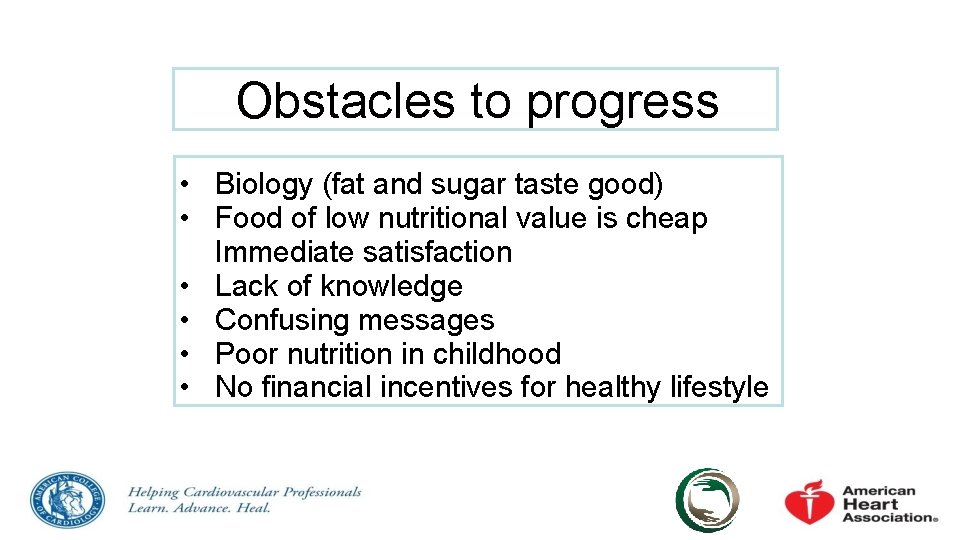
Obstacles to progress • Biology (fat and sugar taste good) • Food of low nutritional value is cheap Immediate satisfaction • Lack of knowledge • Confusing messages • Poor nutrition in childhood • No financial incentives for healthy lifestyle
Educate yourself Educate the patient Be skeptical Find ways to motivate Put patient first
“Medicine is a social science, and politics is nothing else but medicine on a large scale. Medicine, as a social science, as a science of human beings, has the obligation to point out problems and to attempt their theoretical solution: the politician, the practical anthropologist, must find the means for their actual solution. " - R udolf Virchow