Linux My SQL http www chinaunix net http


![2、分析问题:WHERE – My. SQL mysql slow query show [global status]、show processlist、show engine innodb status](https://slidetodoc.com/presentation_image_h2/af72b3f549c9a659b775d90de828cfd0/image-10.jpg "2、分析问题:WHERE – My. SQL mysql slow query show [global status]、show processlist、show engine innodb status")


![2、分析问题:WHERE – show status/processlist show [global] status 重点关注key hit ratio, qcache hit ratio, lock,](https://slidetodoc.com/presentation_image_h2/af72b3f549c9a659b775d90de828cfd0/image-16.jpg "2、分析问题:WHERE – show status/processlist show [global] status 重点关注key hit ratio, qcache hit ratio, lock,")

")


- Slides: 42
Linux 下的 My. SQL �� 叶金荣 http: //www. chinaunix. net http: //imysql. cn
2、分析问题:WHERE – OS vmstats iostats pidstat mpstats top sar
2、分析问题:WHERE – My. SQL mysql slow query show [global status]、show processlist、show engine innodb status profiling(mysql 5. 0+) mysql explain 其他,如 mysqlreport
2、分析问题:WHERE - vmstats, iostats, pidstat, sar
2、分析问题:WHERE - iostat vmstats, iostats, pidstat, sar
2、分析问题:WHERE - microslow 打上microslow补丁,支持最小微秒单位,同时还能显示执行计划 主要选项:long_query_time, log_slow_filter, log_slow_verbosity 详细解释查看 http: //www. percona. com/docs/wiki/patches: microsl ow_innodb
2、分析问题:WHERE – 分析 slowlog 几个slow query log分析 具 mysqlsla – 重点推荐 mysqldumpslow mysql-explain-slow-log mysql-log-filter myprofi
2、分析问题:WHERE - mysqlsla
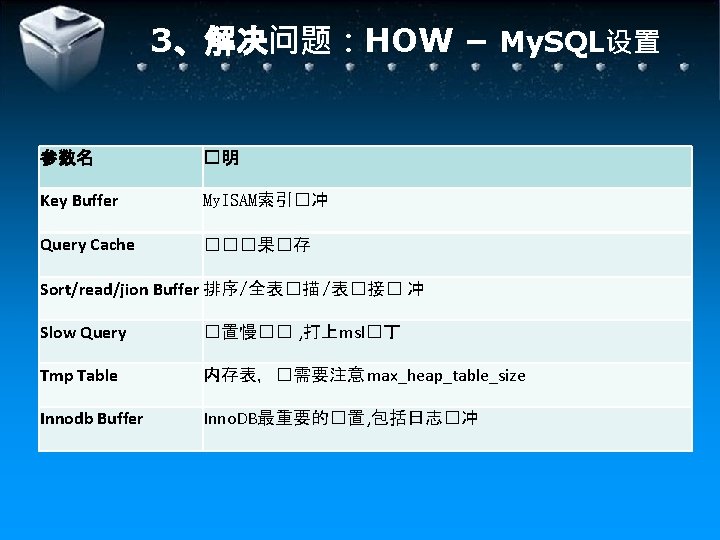
2、分析问题:WHERE – show status/processlist show [global] status 重点关注key hit ratio, qcache hit ratio, lock, slow query, innodb buffer hit ratio, innodb data/log write/read show processlist 重点关注一些异常状态的查询,或者耗时很长的查询 show engine innodb status 重点关注log flush状态,锁状态,事务状态,内存分配消耗
2、分析问题:WHERE - profiling mysql profiling +---------------------+-------+ | Status | Duration | +---------------------+-------+ | (initialization) | 0. 000009 | | checking query cache for query | 0. 000071 | | Opening tables | 0. 000018 | | System lock | 0. 00001 | | Table lock | 0. 0000660 | | init | 0. 000034 | | optimizing | 0. 00001 |
2、分析问题:WHERE - profiling | statistics | 0. 000027 | | preparing | 0. 000027 | | executing | 0. 000006 | | Sending data | 0. 000252 | | end | 0. 000035 | | query end | 0. 000015 | | storing result in query cache | 0. 000014 | | freeing items | 0. 000346 | | closing tables | 0. 000015 | | logging slow query | 0. 000007 | +----------------------+------+
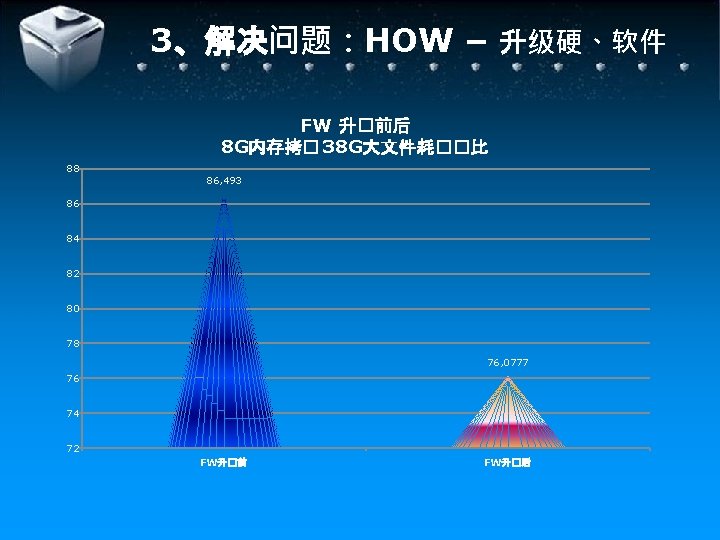
3、解决问题:HOW – 升级硬、软件 不同RAID�� & 不同磁�数 的IO性能�比 140 130 120 100 89 80 68 60 40 20 0 raid 5(4) raid 5(6) raid 1+0(4) raid 1+0(6)
3、解决问题:HOW – 升级硬、软件 232 XFS 72 33 Reiser. FS 1750 83 41 文件系�性能���比 553 23 Create 8 Read Ext 3 Delete
3、解决问题:HOW – 升级硬、软件 250000 200000 150000 write cache 25% write cache 50% write cache 75% 100000 50000 0 8 16 32 64 128 256 512 1024 2048
3、解决问题:HOW – 引擎 My. ISAM Inno. DB Tuko. DB Xtra. DB Memcached for My. SQL Waffle Grid Project
3、解决问题:HOW – Innodb Plugin
3、解决问题:HOW – 补丁 Performance Improving § IO Pathces: multiple threads, Adaptive checkpoint, IO Control of Insert buffer, multiple pages, § Extra rollback segments § Enhanced read_write locks § Split buffer_pool mutex even more § Inno. DB IO patches Usability § § § § Microslow Limit data dictionary IO access pattern Show buffer pool content Show memory usage Show locks held Extra undo slots