
Linking Pollution to Water Body Integrity First Year
Linking Pollution to Water Body Integrity - First Year of Research Vladimir Novotny CDM Chair Professor Northeastern University
STAR WATERSHED PROJECT FUNDED BY USEPA 2003 -2007 Development of Risk Propagation Model for Estimating Ecological Response of Streams to Anthropogenic Stresses and Stream Modification o Project Team n n PI - Vladimir Novotny, NEU Center for Urban Environmental Studies Co-PI’s NEU CUER p p p n Co-PI p n n Marquette University Neal O’Reilly Co-PI p Univ. of Wisconsin Milwaukee Timothy Ehlinger Co-PI p n Elias Manolakos Ferdinand Hellweger Ramanitharan Kandiah Illinois State Water Survey Alena Bartosova 5 graduate students
Project objectives o A model that will include stresses such as p Pollutant inputs p Watershed and water body modification n Land use changes Chanelization and impoundments Riparian corridor modifications o Development of a quantitative layered risk propagation from basic landscape and watershed stressors to the biotic IBI endpoints o Study the possibility of mitigating the stresses that would have the most beneficial impact on the biotic endpoints o Apply the model to another geographic region

NUMERIC INDICES OF BIOTIC INTEGRITY o Fish o Benthic macroinvertebrates o Physical - Habitat
SIMPLISTIC RELATIONSHIPS
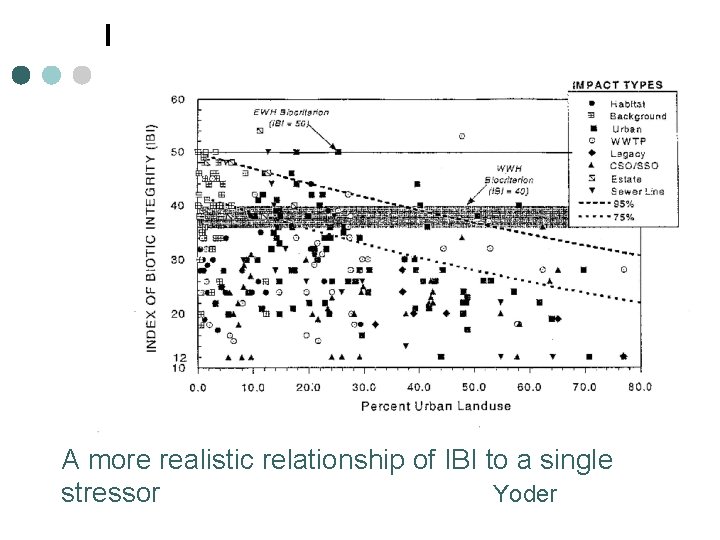
A more realistic relationship of IBI to a single stressor Yoder
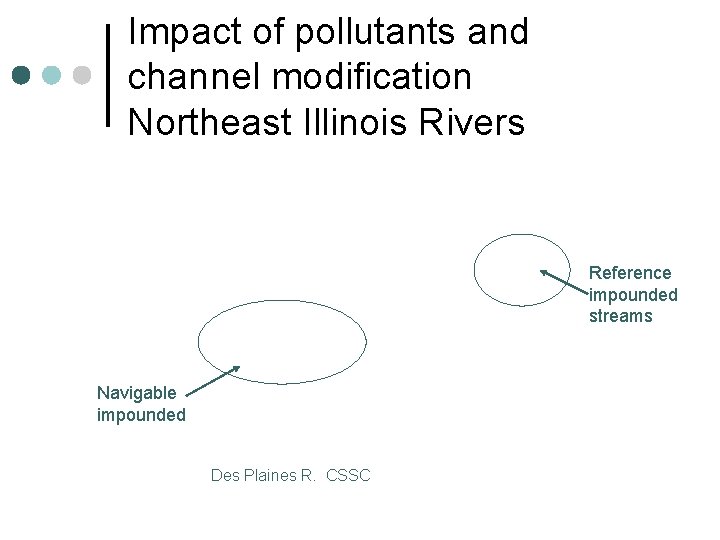
Impact of pollutants and channel modification Northeast Illinois Rivers Reference impounded streams Navigable impounded Des Plaines R. CSSC
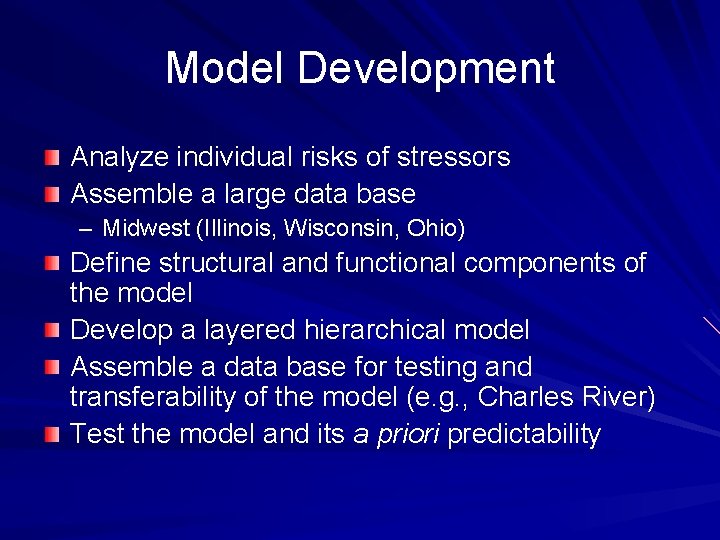
Model Development Analyze individual risks of stressors Assemble a large data base – Midwest (Illinois, Wisconsin, Ohio) Define structural and functional components of the model Develop a layered hierarchical model Assemble a data base for testing and transferability of the model (e. g. , Charles River) Test the model and its a priori predictability
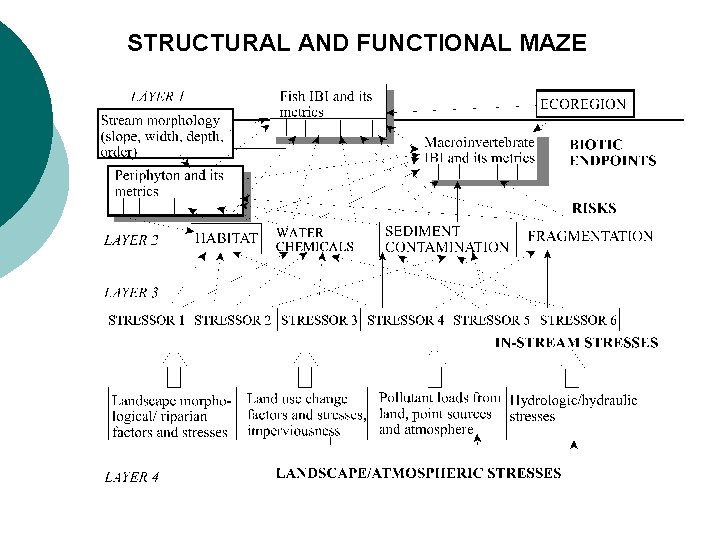
STRUCTURAL AND FUNCTIONAL MAZE
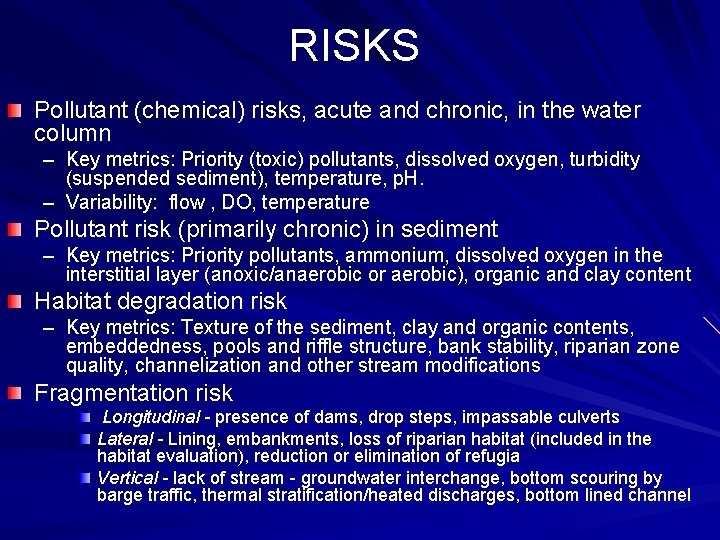
RISKS Pollutant (chemical) risks, acute and chronic, in the water column – Key metrics: Priority (toxic) pollutants, dissolved oxygen, turbidity (suspended sediment), temperature, p. H. – Variability: flow , DO, temperature Pollutant risk (primarily chronic) in sediment – Key metrics: Priority pollutants, ammonium, dissolved oxygen in the interstitial layer (anoxic/anaerobic or aerobic), organic and clay content Habitat degradation risk – Key metrics: Texture of the sediment, clay and organic contents, embeddedness, pools and riffle structure, bank stability, riparian zone quality, channelization and other stream modifications Fragmentation risk Longitudinal - presence of dams, drop steps, impassable culverts Lateral - Lining, embankments, loss of riparian habitat (included in the habitat evaluation), reduction or elimination of refugia Vertical - lack of stream - groundwater interchange, bottom scouring by barge traffic, thermal stratification/heated discharges, bottom lined channel
Fragmentation Risk Fragmentation can result from any factor (biotic or abiotic) that causes decrease in the ability of species to move/migrate among sub-populations or between portions of their habitat necessary for different stages of their life (e. g spawning migrations) and it can be both physical (e. g. , biologically impassable culverts, dams, waterfalls, road crossings and bridges) and caused by pollutants (e. g. , localized fish kills or a polluted mixing zone without a zone of passage or a thermal plume or stratification).
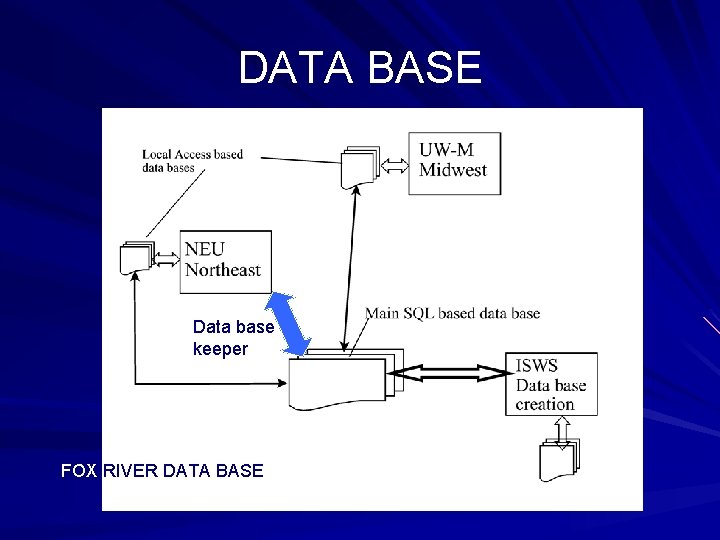
DATA BASE Data base keeper FOX RIVER DATA BASE
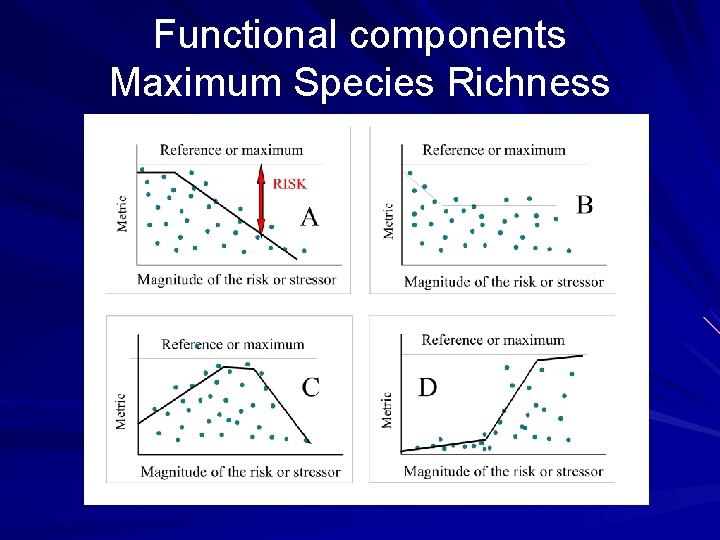
Functional components Maximum Species Richness
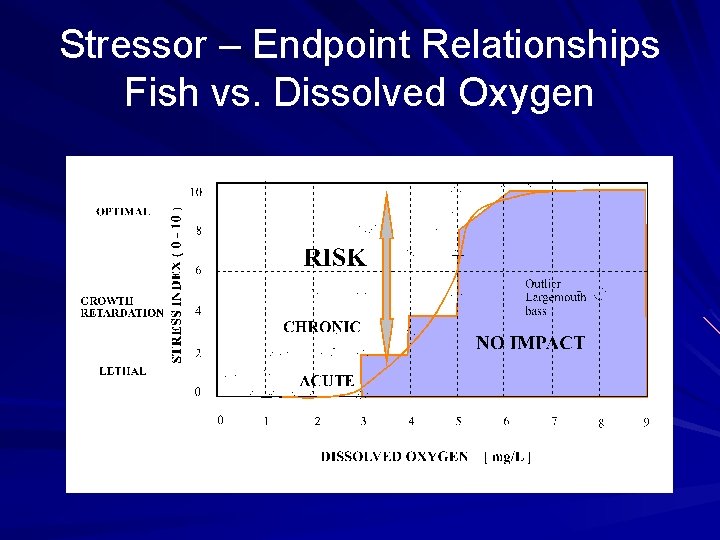
Stressor – Endpoint Relationships Fish vs. Dissolved Oxygen
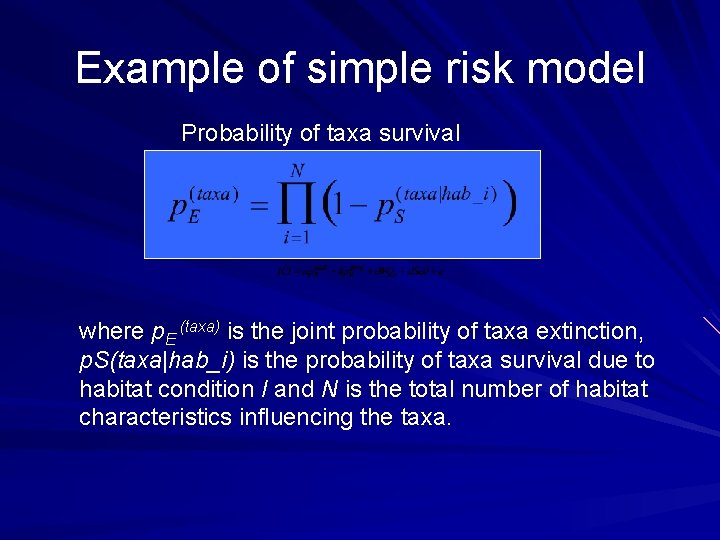
Example of simple risk model Probability of taxa survival where p. E (taxa) is the joint probability of taxa extinction, p. S(taxa|hab_i) is the probability of taxa survival due to habitat condition I and N is the total number of habitat characteristics influencing the taxa.
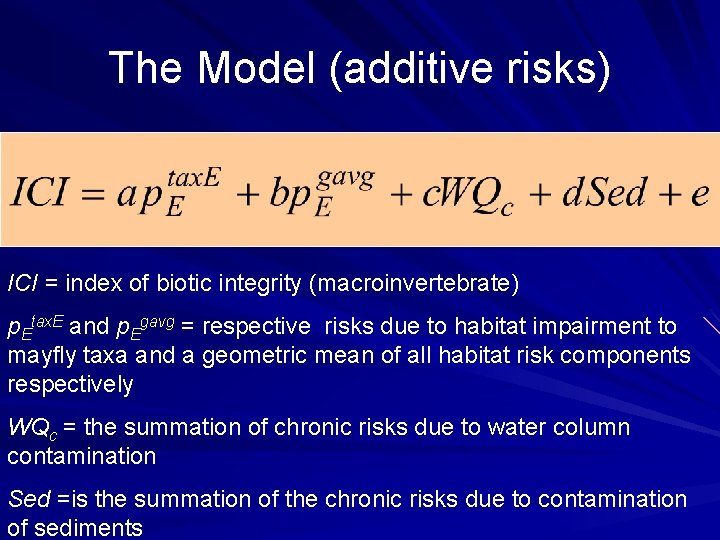
The Model (additive risks) ICI = index of biotic integrity (macroinvertebrate) p. Etax. E and p. Egavg = respective risks due to habitat impairment to mayfly taxa and a geometric mean of all habitat risk components respectively WQc = the summation of chronic risks due to water column contamination Sed =is the summation of the chronic risks due to contamination of sediments
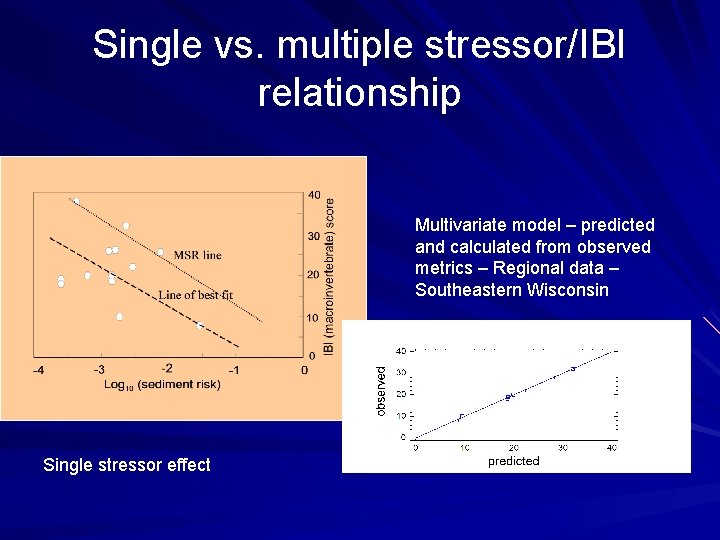
Single vs. multiple stressor/IBI relationship Multivariate model – predicted and calculated from observed metrics – Regional data – Southeastern Wisconsin Single stressor effect

Artificial (Feed forward/backward) Neural Nets or More Advance Learning Models Randomness (white noise) Network based schemes which can flag the formation of parameter patterns that start affecting severely metrics that contribute to IBI
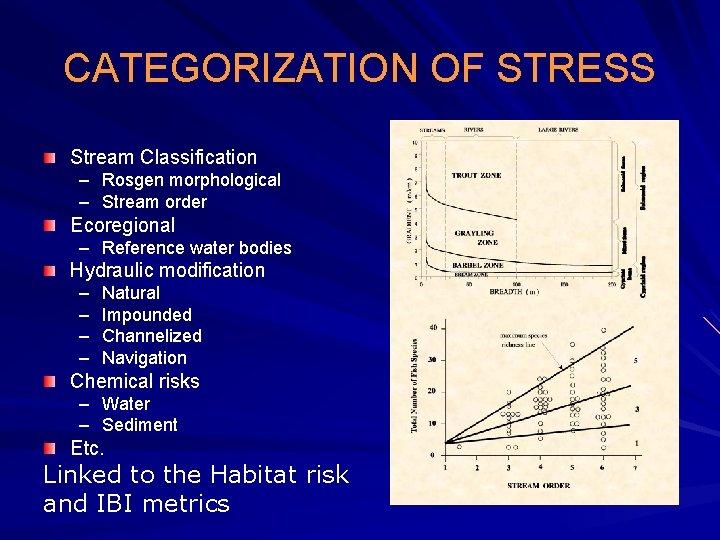
CATEGORIZATION OF STRESS Stream Classification – Rosgen morphological – Stream order Ecoregional – Reference water bodies Hydraulic modification – – Natural Impounded Channelized Navigation Chemical risks – Water – Sediment Etc. Linked to the Habitat risk and IBI metrics
USE OF THE MODEL Watershed and water/body vulnerability classification (another project) Assist watershed manager with selection of priority watersheds Development of watershed wide best management practices Watershed mapping based on vulnerability TMDL

Northeastern University established Center for Urban Environmental Studies www. coe. neu/environment novotny@coe. neu. edu
First year accomplishments Interdisciplinary team was formed Northeastern University of Wisconsin/Marquette University Illinois Water Survey Two Technical Review Reports Methodology was developed Data Base development Four review publications submitted
- Slides: 22