Linkage Disequilibrium Outline Linkage disequilibrium LD Definition of

Linkage Disequilibrium
 – Definition of linkage disequilibrium – Importance of disequilibrium")
Outline • Linkage disequilibrium (LD) – Definition of linkage disequilibrium – Importance of disequilibrium – Measures of disequilibrium • SNP selection – Public resources – Tag SNP selection programs • Imputation

Definitions SNP 1: rs 3822050 and SNP 2: rs 10517002 • Allele – Different versions of DNA sequence at a given location • Genotype – The two alleles in an individual at a given locus • Haplotype – A series of alleles along a single chromosome • Diplotype – a set of haplotype pairs in an individual SNP 1: C and T SNP 2: C and A SNP 1: C/C, C/T or T/T SNP 2: C/C, C/A or A/A SNP 1 SNP 2 C C C A T C T A C C C A C T C C C T C A C C T C

What is Linkage Disequilibrium? Linkage Disequilibrium: Two loci that are in linkage disequilibrium are inherited together more often than would be expected by chance. Zondervan & Cardon, 2004 Systematic studies of common genetic variants are facilitated by the fact that individuals who carry a particular SNP allele at one site often predictably carry specific alleles at other nearby variant sites. This correlation is known as linkage disequilibrium The international Hap. Map consortium, 2005 Linkage Disequilibrium refers to the nonindependence of alleles at different sites. Pritchard and Przeworski 2001

Linkage Equilibrium SNP 1 SNP 2 SNP 1: C/T C A C C SNP 2: C/A T C T A haplotype frequencies in population match what is expected based on allele frequencies Example: frequency of C-A haplotype equals frequency of C allele at SNP 1 * frequency of A allele at SNP 2 Linkage Disequilibrium SNP 1 SNP 2 SNP 1: C/T C A C C SNP 2: C/A T C T A haplotype frequencies in population differ from what is expected based on allele frequencies

It is a Matter of Scale "Nothing in biology makes sense except in the light of evolution” -Theodosius Dobzhansky, 1973

Current Haplotypes Arose from Ancient Mutation Events 1. Ancestral state has no variation at either SNP position. C A 2. Mutation leads to first SNP C A T A 3. Asecond mutation leads to second SNP C T A A T C 4. Recombination or recurrent mutation needed for all four haplotypes T A C A T T A C T C C C

Haplotypes The International Hap. Map Consortium. Nature | Vol 437 | 27 Octobe

Focus on Pairwise LD A B A b a B a b B A a p. AB pa. B p. B b p. Ab pb p. A If loci are independent, then we expect p. AB= p. A* p. B p. Ab= p. A* pb p. AB= p. A* p. B pab pa

Measuring LD for pairs of sites- D A B A b a B a b B A a p. AB pa. B p. B b p. Ab pb p. A pab pa One important measure of LD is DAB = p. AB – p. Ap. B Notice that D=0 if and only the two sites are independent A disadvantage of D is that the range of possible values depends greatly on the marginal allele frequencies.
 proposed an adjusted statistic that")
Measuring LD for pairs of sites- D’ Lewontin (1964) proposed an adjusted statistic that has range [-1, 1]: B A a p. AB pa. B p. B b p. Ab pab pb p. A pa D’ = D/max(D), where max(D) is dependent on the marginal allele frequencies If DAB>0: D’AB = DAB/(min(Pa. PB, PAPb)) If DAB<0: D’AB = DAB/(min(PAPB, Pa. Pb))

Properties of D’ • D’ favored in medical genetics – D’=0 implies independence – |D’|<1 implies that there has been recombination between the two sites in the history of the sample (or recurrent mutation) – |D’=1| implies “complete LD” • No historic recombination • Neither site has experienced recurrent mutation or gene conversion • Genotypes not perfectly correlated (unequal allele frequency) • D’ inflated in smaller samples

Measuring LD for pairs of sites- r 2 Along with D’, the other most widely used statistic is r 2: B A a p. AB pa. B r 2 = DAB 2 / (p. A*p. B*pa*pb) b p. Ab pab p. A pa r 2 has range [0, 1]. Its value is 1 if just 2 of the 4 haplotypes are present. r 2 is intimately connected to the power of association mapping [Pritchard & Przeworski 2001] p. B pb

Properties of r 2 • r 2 favored in population genetics – r 2 =0 implies independence – r 2 =1 implies “perfect LD” • Marker loci have identical allele frequencies • Genotype is perfectly correlated – Related to power if (N 2=N 1/r 2) • where N 1 is sample size needed for directly genotyped SNP, N 2 is sample size needed to test tagged SNP and r 2 is the LD between the directly genotyped SNP and the tagged SNP). • Assume need 1, 000 for directly genotyped SNP, examples of sample size needed for tagged SNPs, depending on r 2 – r 2=1. 0, N 1= N 2=1, 000 – r 2=0. 2, N 2 = 1, 000/0. 2 = 5, 000

What factors affect LD? • • Mutation Historical recombination Natural selection Founder effects Migration Random drift Population admixture

LD over time • Recombination assorts SNPs on haplotypes. • Under assumption of random mating and a large population, LD will break down over time.

Applications of LD • LD is the sine qua non of genetic association studies: – We are interested in testing for an association between disease status and causal mutations – If all polymorphisms were independent at the population level, association studies would have to examine every one of them. – Instead we can test a subset and get information on all of them. • LD is also used in studies of human history, natural selection and the biology of recombination

LD Across a Gene Genotype at one site can predict genotype at another site Proportion of sites are correlated

SNP Selection • We use information about allele frequencies and LD across the genome to make informed choices as to which variants to genotype – Identify SNPs in region of interest – Interested in minimal set of SNPs needed to capture variation in region.

Identify variation for your region • Option 1: sequence individuals in your sample for the entire gene/region of interest • Option 2: sequence a subset of individuals to identify variation in your region • Option 3: Use public databases to identify known variation in your region

SNP Database Resources • NCBI SNP Database, db. SNP – http: //www. ncbi. nlm. nih. gov/SNP/ • International Hap. Map Project – http: //www. hapmap. org/ • NHLBI Program for Genomic Applications (http: //www. nhlbi. nih. gov/resources/pga/) – Seattle. SNPs (http: //pga. mbt. washington. edu/) – Innate. Immunity (http: //innateimmunity. net/) • 1, 000 genomes project – http: //www. 1000 genomes. org • Exome variant server (EVS) – http: //evs. gs. washington. edu/EVS/
")
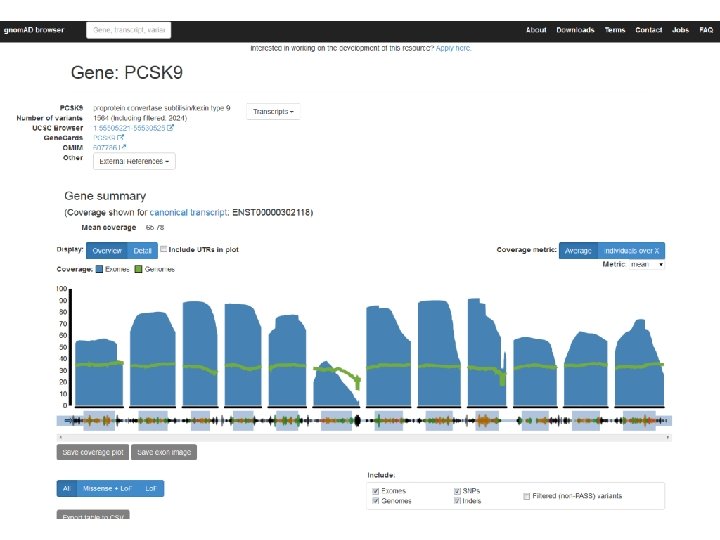
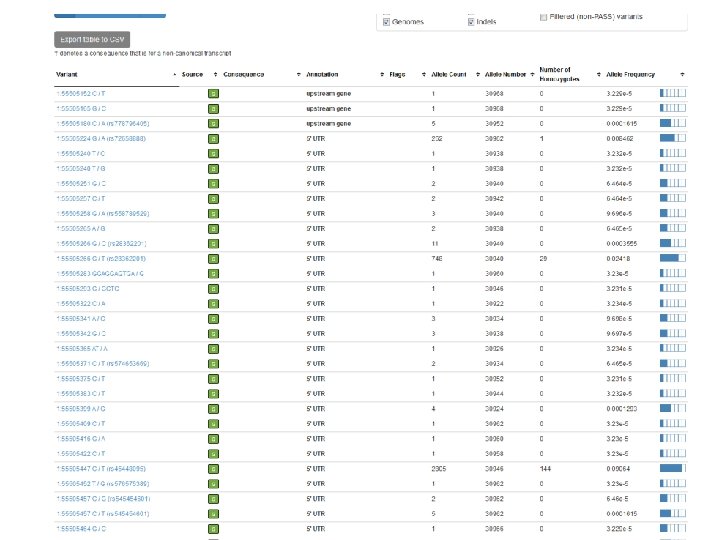
Exome Aggregation Consortium (Ex. AC)

gnom. AD browser http: //gnomad. broadinstitute. org/

Tag SNPs – tag. SNPs • SNPs are selected based on their pair wise ability to predict genotype of untyped SNPs • Based on an r 2 concept of LD structure • Example program: LDSelect – haplotype-tagging SNPs (ht. SNPs) • SNPs are selected to optimize resolution of existing haplotypes • Based on a D’ concept of LD structure • Example program: Haploview, Haplo. Blockfinder – Multi-marker tag. SNPs • Use tag. SNP concept, but extend past pair wise LD • Example program: tagger

Tag SNPs – using r 2 information A/T 1 G/A 2 G/C 3 T/C 4 G/C 5 A/C 6 A A T T G G A A G C T C C C G C A C C C After Carlson et al. (2004) AJHG 74: 106 Think-Pair-Share Exercise: Which SNPs are in high LD? How many SNPs would you need to genotype to effectively capture the variation across the region?

Tag SNPs – using r 2 information A/T 1 G/A 2 G/C 3 T/C 4 G/C 5 A/C 6 A A T T G G A A G C T C C C G C A C C C After Carlson et al. (2004) AJHG 74: 106 Tags: Test for association:

Tag SNPs are Population Specific European-Americans CRP African-Americans CRP

Limitations of tag SNPs • Ultimately, we are interested in identifying common polymorphisms that are causally associated with disease risk, we cannot determine if signal is from the tag. SNP or from a correlated SNP. • What happens if your tag. SNP fails in the genotyping/QC stage?

Imputation • We also use LD information to impute genotype information. • Common example is in genome-wide association studies. – Example: SNPs on a GWAS chip can be used to infer information on all variants in Hap. Map and 1000 genomes data • Recent literature focuses on appropriate reference populations (see for example Eur J Hum Genet. 2015 Jul; 23(7): 975 -83. )

Imputation with family data
")
Imputation with Population Data Nature Reviews Genetics 11, 499 -511 (July 2010)

Imputation Programs • IMPUTE 2 – http: //mathgen. stats. ox. ac. uk/impute_v 2. html • Beagle – http: //faculty. washington. edu/browning/beagle. ht ml • Ma. CH/minimac – http: //genome. sph. umich. edu/wiki/Ma. CH: _1000_Genom es_Imputation_Cookbook – http: //genome. sph. umich. edu/wiki/Minimac

Example Ma. CH • Uses a hidden Marcov-model – Iteratively update the phase of each individuals genotype data conditional on haplotype estimates of other samples. • • • Gi is the observed genotype of individual i, D-i is estimated haplotypes of all other individuals Z are the hidden states q is the crossover parameter between hidden states h is the error parameter
 • Probability of each")
Imputation Output • A “best guess” genotype (i. e. TT) • Probability of each genotype (i. e. pr(TT), pr(TA), pr(AA)) • A “dosage”. If T is 0 and A is 1, then people are on a scale from 0 to 2 (where 0=TT, 1=TA and 2=AA). • dosage=pr(TA)+2*pr(TT) • A quality score (typically an “information” or r 2 measure) that captures the uncertainty in the imputation.

Haplotype Reference Consortium http: //www. haplotype-reference-consortium. org/

Haplotype Reference Consortium
 refers to the nonindependence of alleles at different sites")
Summary • Linkage disequilibrium (LD) refers to the nonindependence of alleles at different sites in the genome • LD is shaped by population genetic forces • We exploit LD information in genetic epidemiology – Selecting tag. SNPs for association studies – Imputation in GWAS studies • LD complicates interpretation of association studies

Tag SNPs – using r 2 information A/T 1 A A T T G/A 2 G G A A high r 2 G/C 3 G C T/C 4 T C C C high r 2 G/C 5 A/C 6 A C C C G C high r 2 After Carlson et al. (2004) AJHG 74: 106 Tags: SNP 1 SNP 3 SNP 6 3 in total Test for association: SNP 1 captures 1 & 2 SNP 3 captures 3 & 5 SNP 6 captures 4 & 6

Picking tag SNPs using multimarker r 2 A/T 1 G/A 2 G/C 3 T/C 4 G/C 5 A/C 6 Tags: SNP 1 SNP 3 A A T T G G A A G C T C C C G C http: //www. broad. mit. edu/mpg/tagger A C C C 2 in total Test for association: SNP 1 captures 1+2 SNP 3 captures 3+5 SNP 1 and 3 in combo also captures 4 and 6
- Slides: 41