
Linear Regression with Multiple Regressors y b 0
Linear Regression with Multiple Regressors y = b 0 + b 1 x 1 + b 2 x 2 +. . . bkxk + u 1. Definition 2. Estimation 3. Properties Economics: 332 - 11 1
Outline 1. 2. 3. 4. Omitted variable bias Multiple regression and OLS Measures of fit Sampling distribution of the OLS estimator 2
Omitted Variable Bias (SW Section 6. 1) The error u arises because of factors, or variables, that influence Y but are not included in the regression function. There always omitted variables. Sometimes, the omission of those variables can lead to bias in the OLS estimator. 3
Omitted variable bias, ctd. The bias in the OLS estimator that occurs as a result of an omitted factor, or variable, is called omitted variable bias. For omitted variable bias to occur, the omitted variable “Z” must satisfy two conditions: The two conditions for omitted variable bias 1. Z is a determinant of Y (i. e. Z is part of u); and 2. Z is correlated with the regressor X (i. e. corr(Z, X) ≠ 0) then ρXu ≠ 0 and the OLS estimator is biased and is not consistent. Both conditions must hold for the omission of Z to result in omitted variable bias. 4
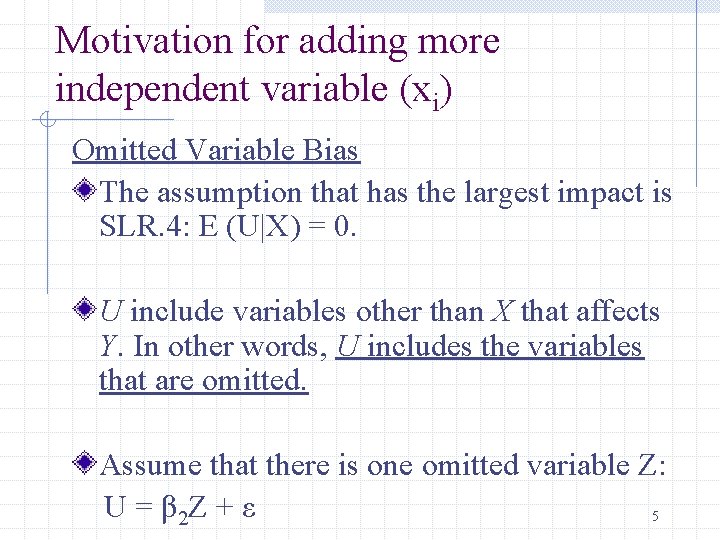
Motivation for adding more independent variable (xi) Omitted Variable Bias The assumption that has the largest impact is SLR. 4: E (U|X) = 0. U include variables other than X that affects Y. In other words, U includes the variables that are omitted. Assume that there is one omitted variable Z: U = β 2 Z + ε 5
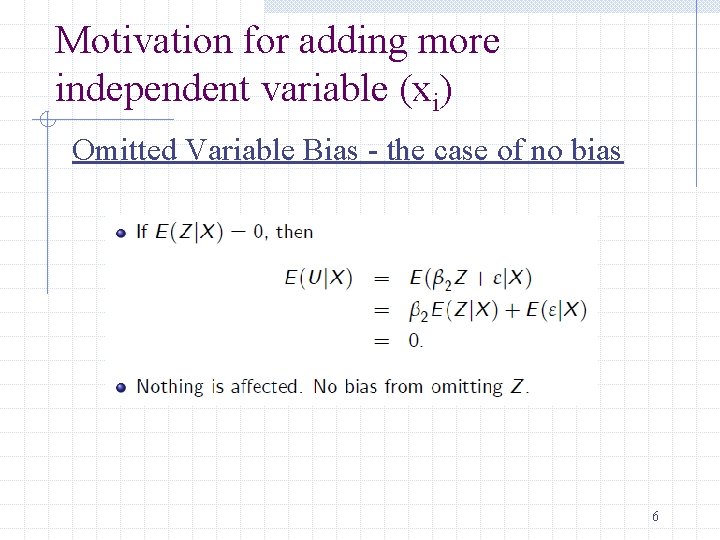
Motivation for adding more independent variable (xi) Omitted Variable Bias - the case of no bias 6
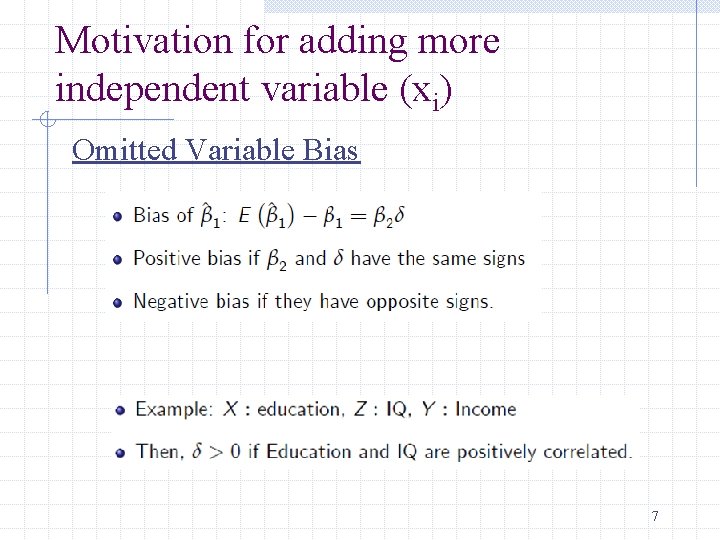
Motivation for adding more independent variable (xi) Omitted Variable Bias 7
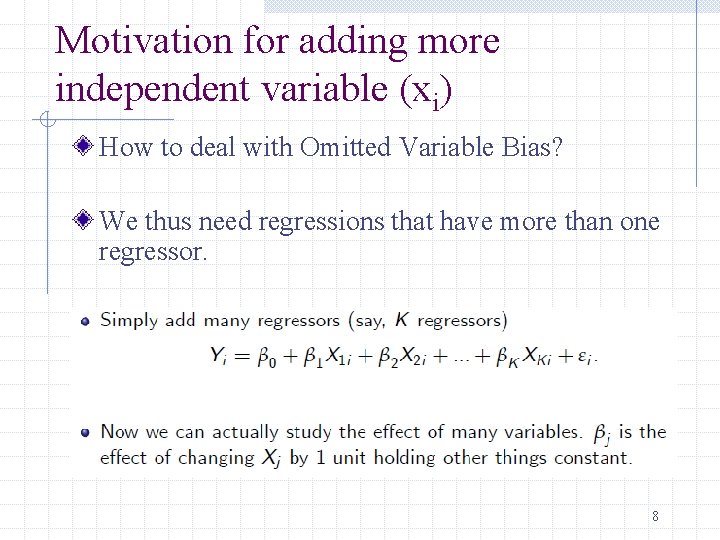
Motivation for adding more independent variable (xi) How to deal with Omitted Variable Bias? We thus need regressions that have more than one regressor. 8
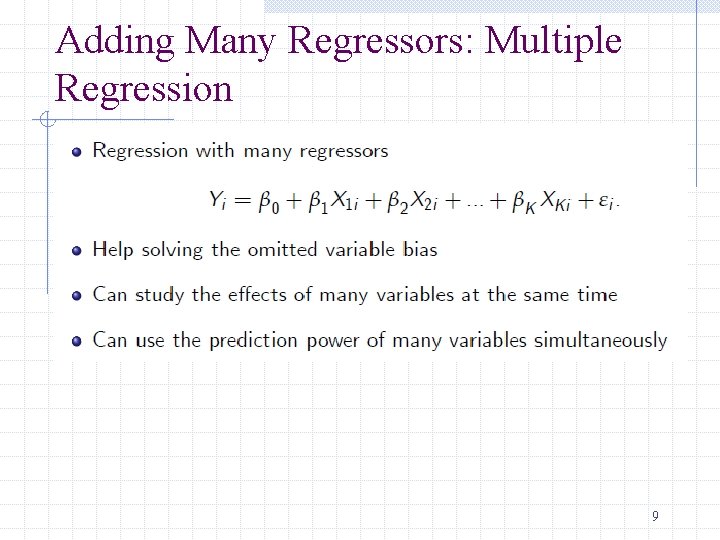
Adding Many Regressors: Multiple Regression 9
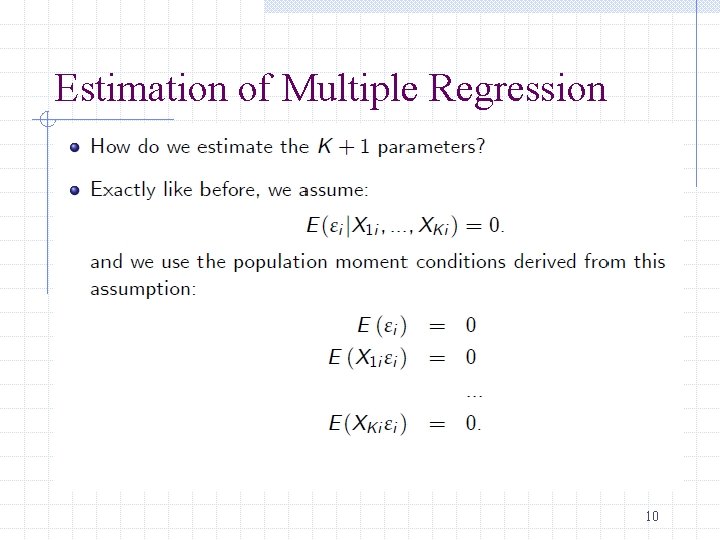
Estimation of Multiple Regression 10
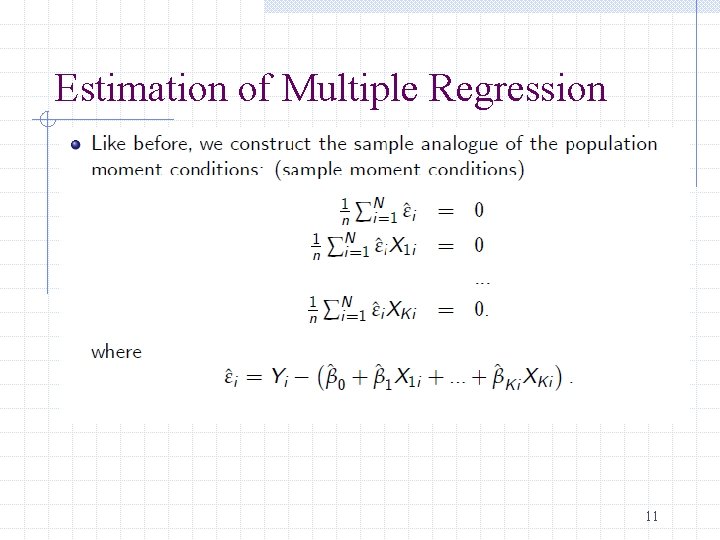
Estimation of Multiple Regression 11
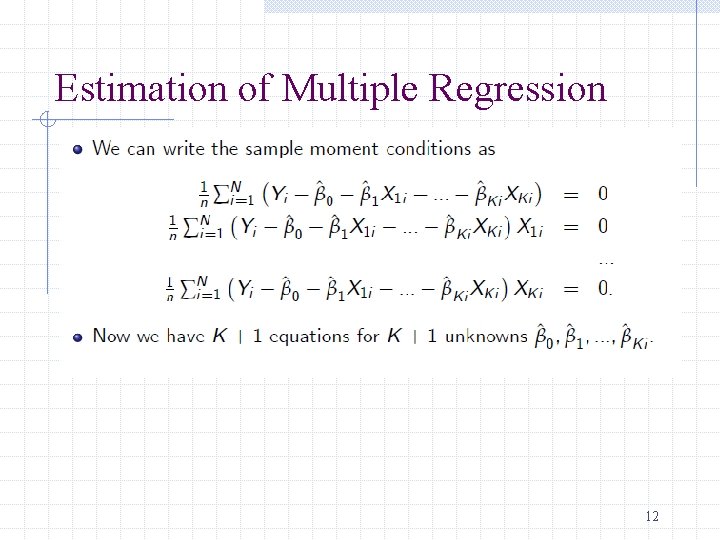
Estimation of Multiple Regression 12
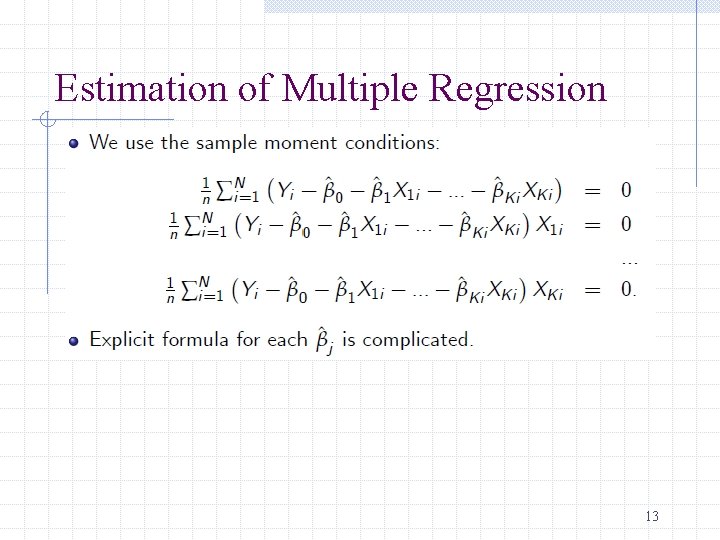
Estimation of Multiple Regression 13
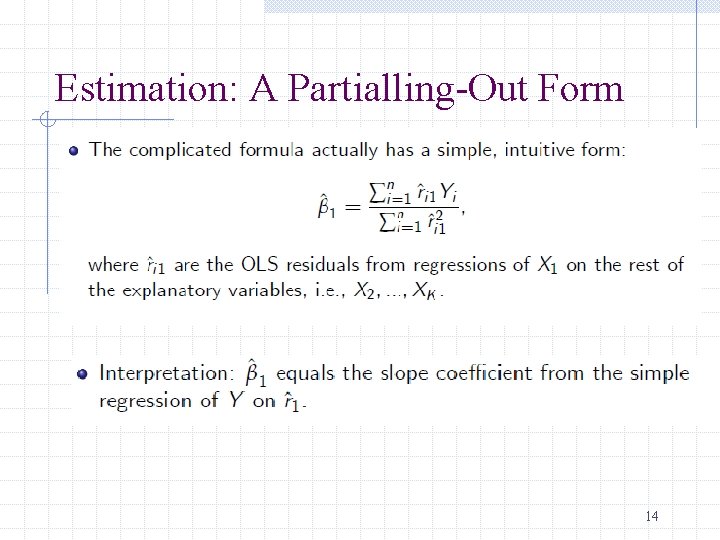
Estimation: A Partialling-Out Form 14
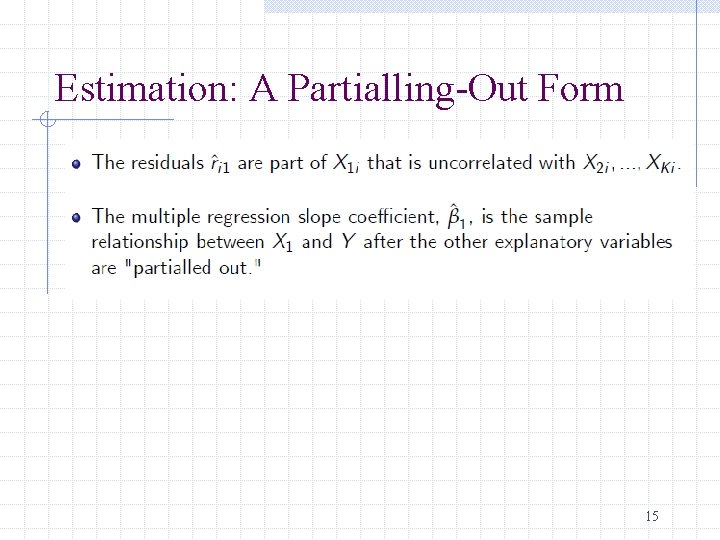
Estimation: A Partialling-Out Form 15
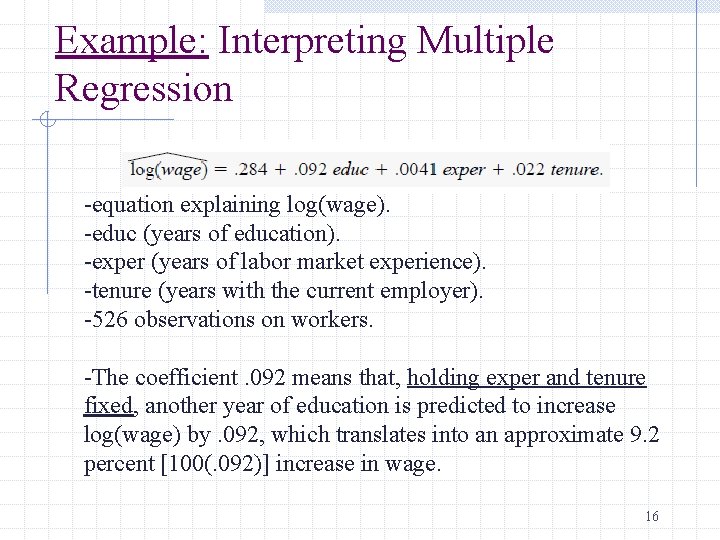
Example: Interpreting Multiple Regression -equation explaining log(wage). -educ (years of education). -exper (years of labor market experience). -tenure (years with the current employer). -526 observations on workers. -The coefficient. 092 means that, holding exper and tenure fixed, another year of education is predicted to increase log(wage) by. 092, which translates into an approximate 9. 2 percent [100(. 092)] increase in wage. 16
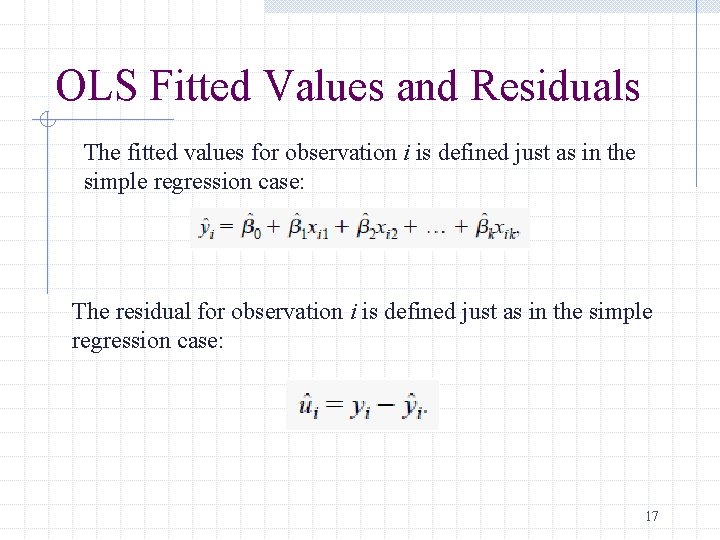
OLS Fitted Values and Residuals The fitted values for observation i is defined just as in the simple regression case: The residual for observation i is defined just as in the simple regression case: 17
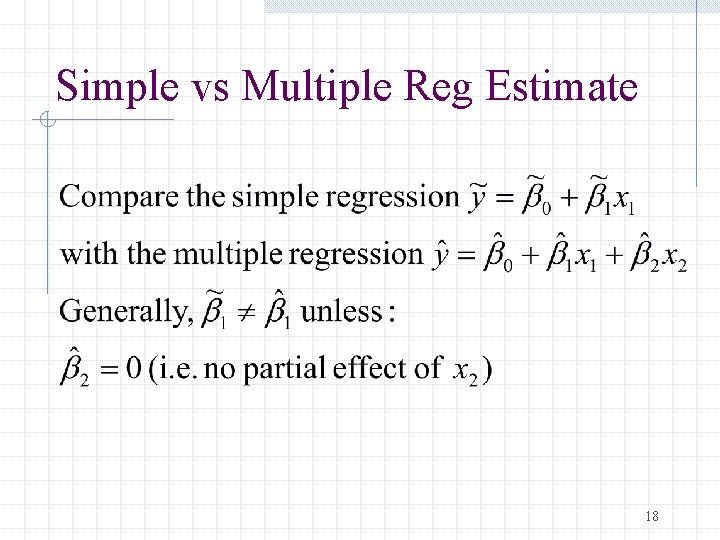
Simple vs Multiple Reg Estimate 18
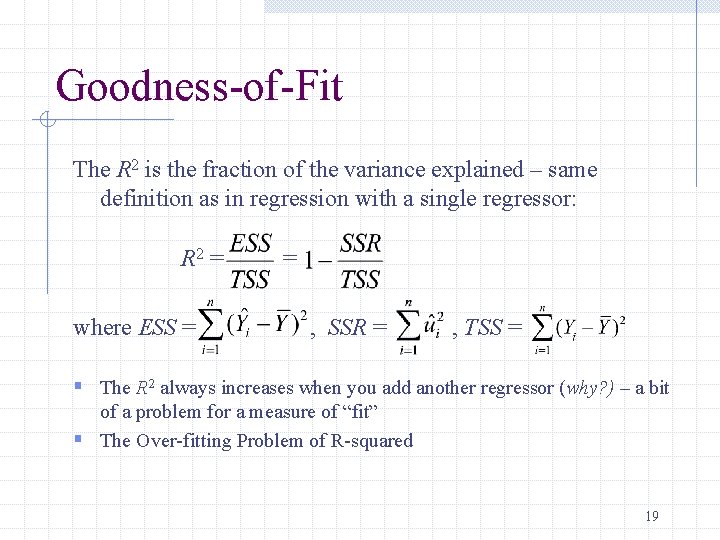
Goodness-of-Fit The R 2 is the fraction of the variance explained – same definition as in regression with a single regressor: R 2 = where ESS = , SSR = , TSS = § The R 2 always increases when you add another regressor (why? ) – a bit of a problem for a measure of “fit” § The Over-fitting Problem of R-squared 19
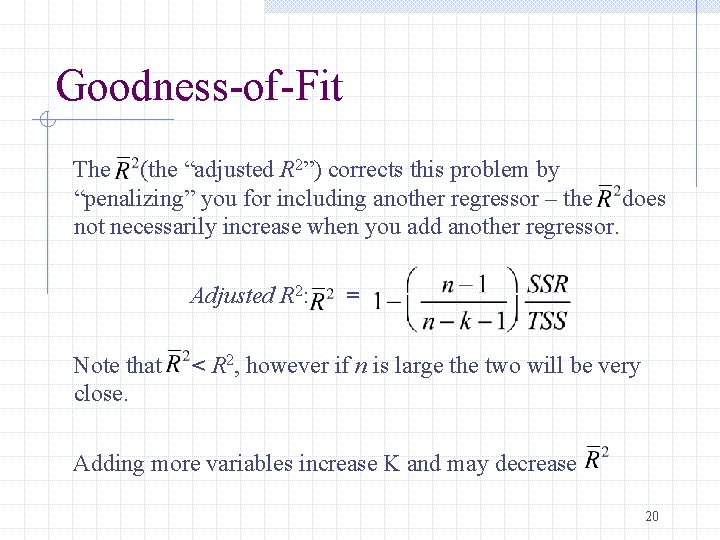
Goodness-of-Fit The (the “adjusted R 2”) corrects this problem by “penalizing” you for including another regressor – the does not necessarily increase when you add another regressor. Adjusted R 2: = Note that < R 2, however if n is large the two will be very close. Adding more variables increase K and may decrease 20
Unbiasedness of OLS Estimators 21
Unbiasedness of OLS Estimators 22
Unbiasedness of OLS Estimators 23
Examples of Perfect Colinearity 24
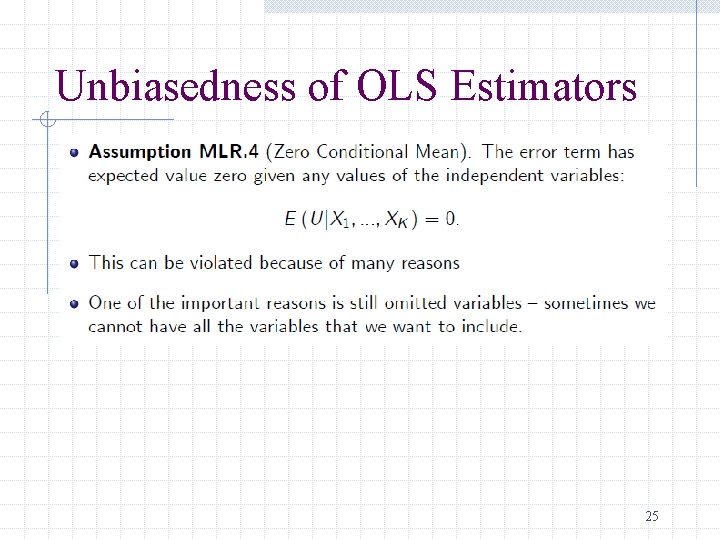
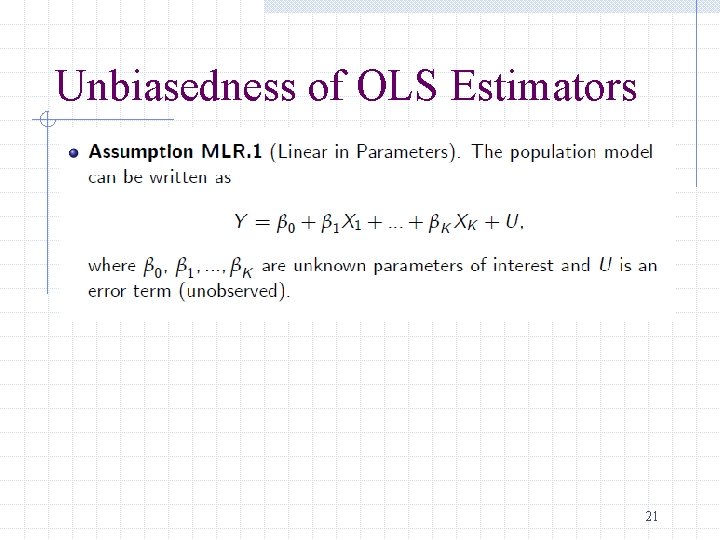
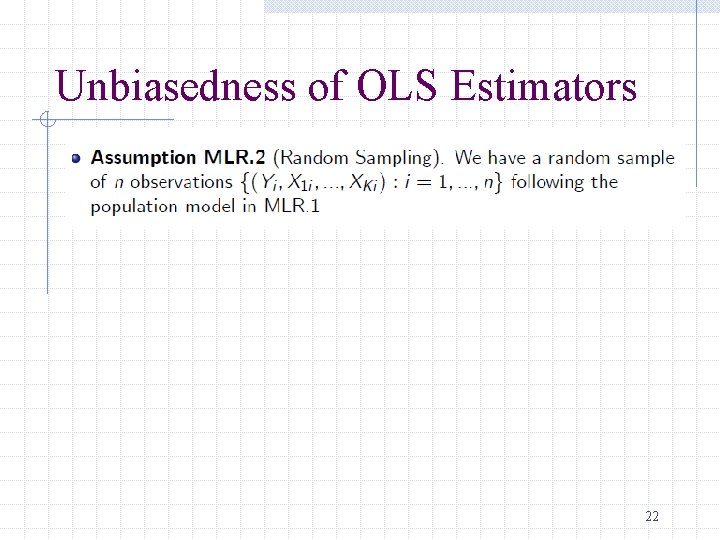
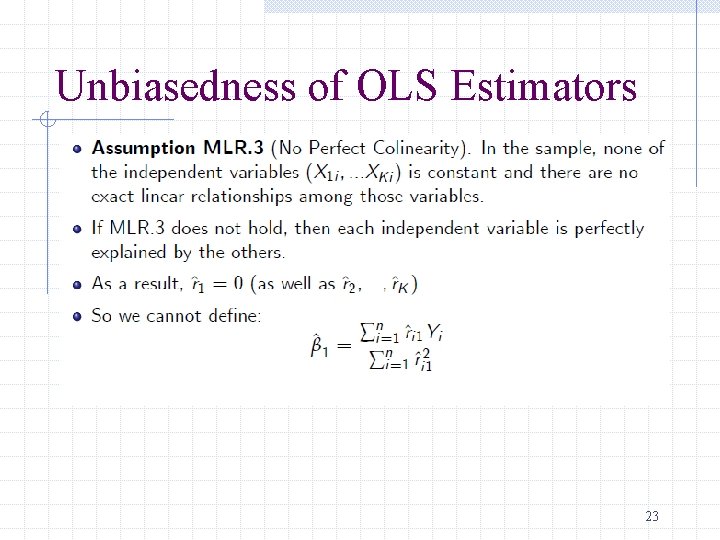
Unbiasedness of OLS Estimators 25
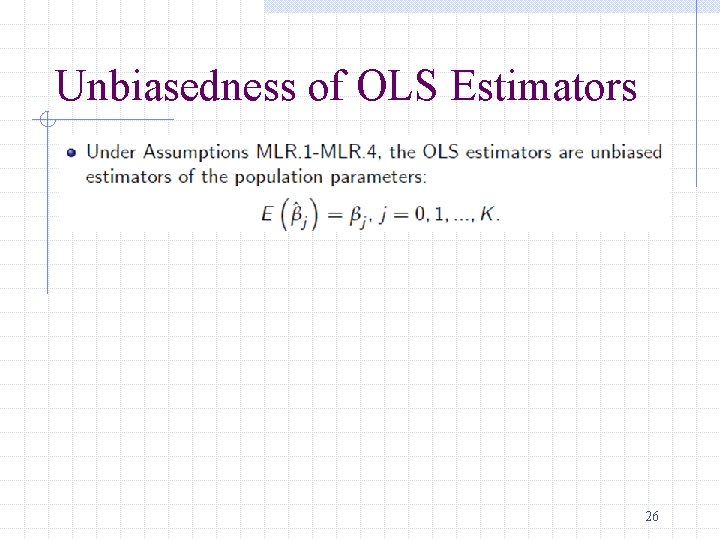
Unbiasedness of OLS Estimators 26
Variance of the OLS Estimators Now we know that the sampling distribution of our estimate is centered around the true parameter Want to think about how spread out this distribution is Much easier to think about this variance under an additional assumption 27
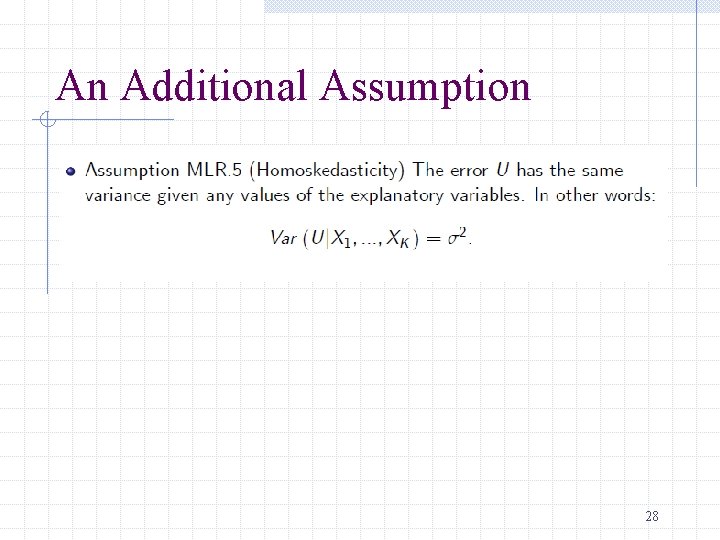
An Additional Assumption 28
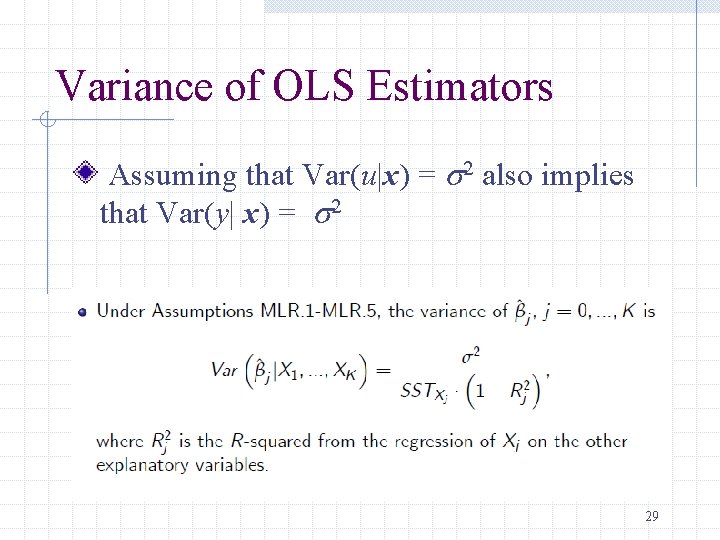
Variance of OLS Estimators Assuming that Var(u|x) = s 2 also implies that Var(y| x) = s 2 29
Estimating the Error Variance We don’t know what the error variance, s 2, is, because we don’t observe the errors, ui What we observe are the residuals, ûi We can use the residuals to form an estimate of the error variance 30
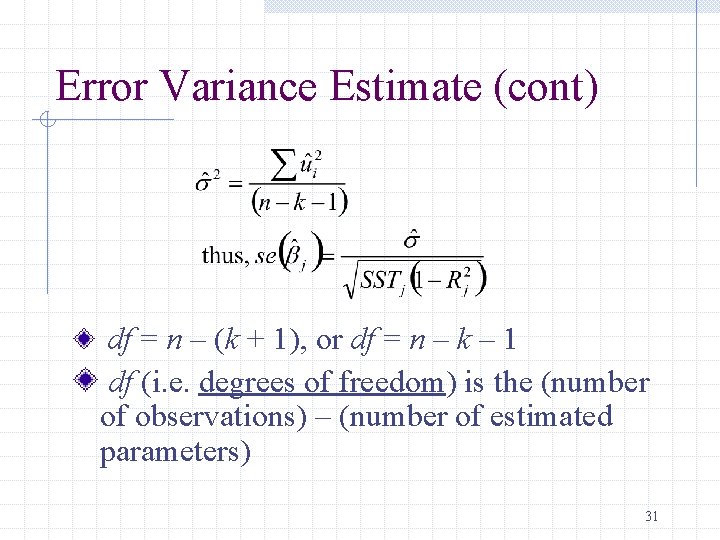
Error Variance Estimate (cont) df = n – (k + 1), or df = n – k – 1 df (i. e. degrees of freedom) is the (number of observations) – (number of estimated parameters) 31
Components of OLS Variances The error variance: a larger s 2 implies a larger variance for the OLS estimators The total sample variation: a larger SSTj implies a smaller variance for the estimators Linear relationships among the independent variables: a larger Rj 2 implies a larger variance for the estimators 32
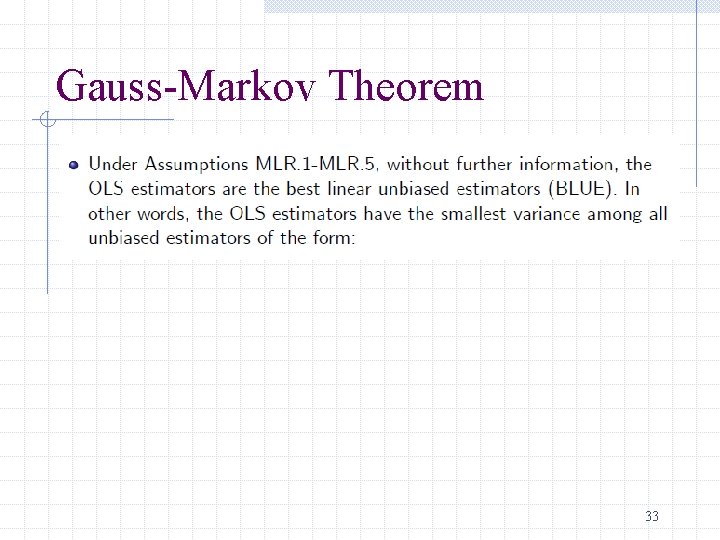
Gauss-Markov Theorem 33
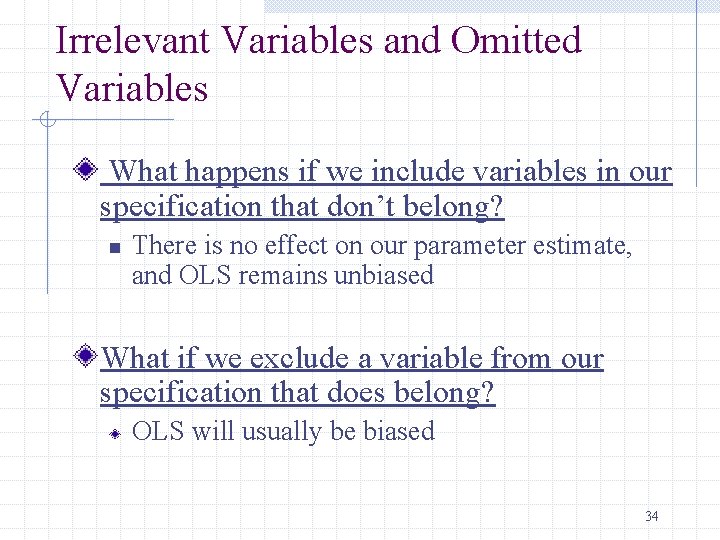
Irrelevant Variables and Omitted Variables What happens if we include variables in our specification that don’t belong? n There is no effect on our parameter estimate, and OLS remains unbiased What if we exclude a variable from our specification that does belong? OLS will usually be biased 34
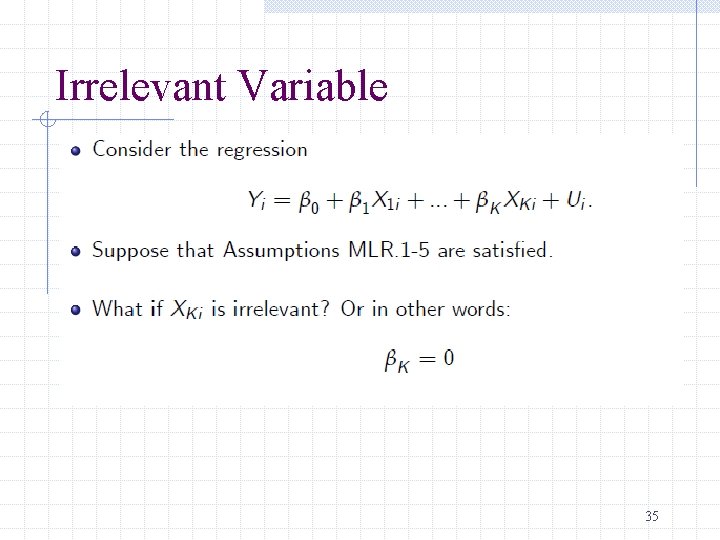
Irrelevant Variable 35
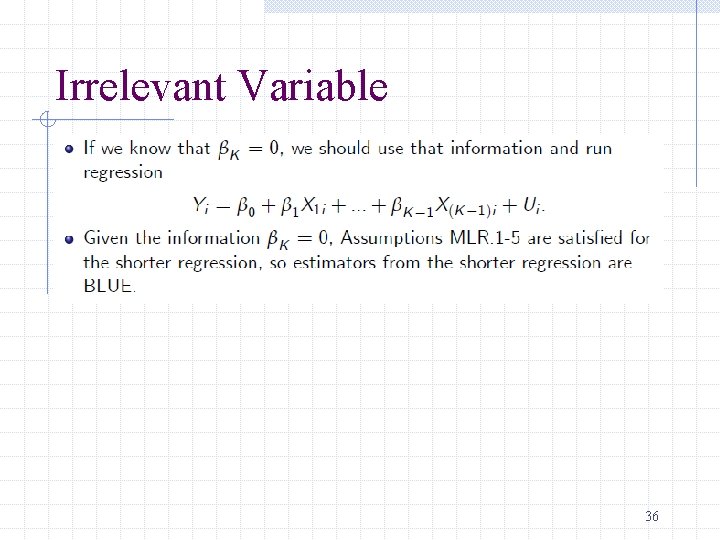
Irrelevant Variable 36

Omitted Variable 37
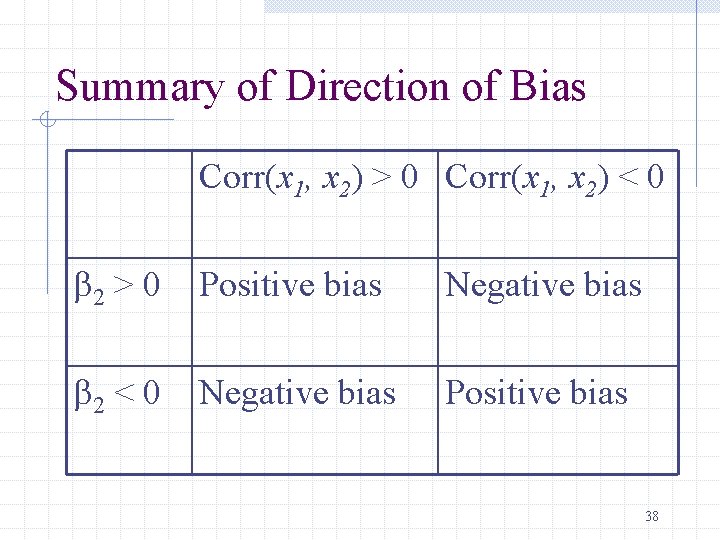
Summary of Direction of Bias Corr(x 1, x 2) > 0 Corr(x 1, x 2) < 0 b 2 > 0 Positive bias Negative bias b 2 < 0 Negative bias Positive bias 38
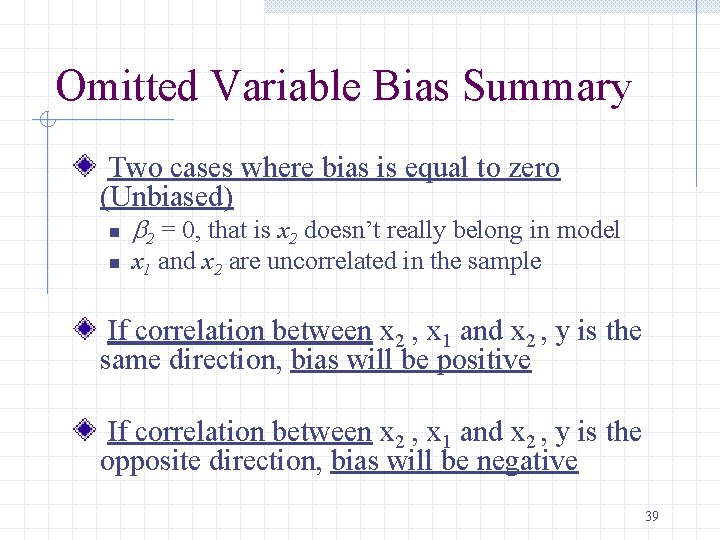
Omitted Variable Bias Summary Two cases where bias is equal to zero (Unbiased) n n b 2 = 0, that is x 2 doesn’t really belong in model x 1 and x 2 are uncorrelated in the sample If correlation between x 2 , x 1 and x 2 , y is the same direction, bias will be positive If correlation between x 2 , x 1 and x 2 , y is the opposite direction, bias will be negative 39
- Slides: 39