Linear Graphs Tables of Values Method Complete Lesson

Linear Graphs – Tables of Values Method – Complete Lesson Preview the presentation to check ability-level, AFL questions, and the animations during demonstrations. It is recommended to delete slides/sections not needed for your class.

Starter A task at the beginning of the lesson that reviews a skill required for the learning. Knowledge Check Questions to assess students’ current understanding and to consequently show progress. Real-Life Example A ‘hook’ to raise interest and provide a concrete example. Demonstration Slides for a teacher to lead students – didactically or via questioning – through a mathematical method. AFL Questions Assessment For Learning Questions, used to assess students’ competency for independent tasks/activities. Plenary An opportunity for students to prove/evaluate their learning.

Printing To print handouts from slides Select the slide from the left. Then click: File > Print > ‘Print Current Slide’ To print multiple slides Click on a section title to highlight all those slides, or press ‘Ctrl’ at the same time as selecting slides to highlight more than one. Then click: File > Print > ‘Print Selection’ To print double-sided handouts Highlight both slides before using ‘Print Selection’. Choose ‘Print on Both Sides’ and ‘Flip on Short Edge’.
 …")
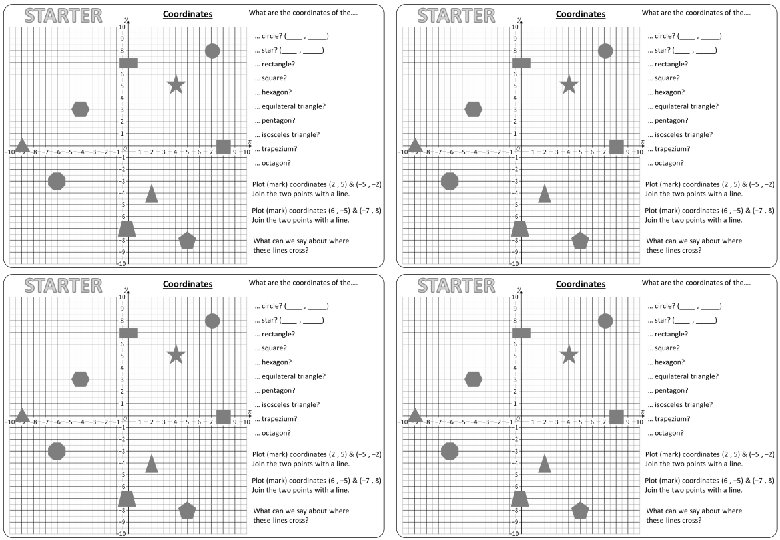
STARTER Coordinates What are the coordinates of the…. … circle? (____ , _____) … star? (____ , _____) … rectangle? … square? … hexagon? … equilateral triangle? … pentagon? … isosceles triangle? … trapezium? … octagon? Plot (mark) coordinates (2 , 5) & (− 5 , − 2) Join the two points with a line. Plot (mark) coordinates (6 , − 5) & (− 7 , 8) Join the two points with a line. What can we say about where these lines cross?
 … circle? (____")
STARTER Coordinates What are the coordinates of the…. (7 , 8) … circle? (____ , _____) (4 , 5) … star? (____ , _____) (0 , 7) … rectangle? (8 , 0) … square? (− 4 , 3) … hexagon? … equilateral triangle? (− 9 , 0) … pentagon? (5 , − 8) … isosceles triangle? (2 , − 4) … trapezium? (0 , − 7) … octagon? (− 6 , − 3) Plot (mark) coordinates (2 , 5) & (− 5 , − 2) Join the two points with a line. Plot (mark) coordinates (6 , − 5) & (− 7 , 8) Join the two points with a line. They are at where 90° What can we say about these (perpendicular). lines cross?

STARTER × 3 Two-Step Function Machines Calculate the output for each input. INPUT 1 2 4 0 − 2 Add 3 OUTPUT 5 OUTPUT INPUT Double INPUT 2 4 0 − 1 − 2 ÷ 2 INPUT 6 − 4 OUTPUT 2 8 − 4 − 7 − 10 +2 OUTPUT 2 1 0

STARTER × 3 Two-Step Function Machines Calculate the output for each input. INPUT 1 2 4 0 − 2 Add 3 OUTPUT 5 7 11 3 − 1 OUTPUT INPUT Double Answers INPUT 2 4 0 − 1 − 2 ÷ 2 INPUT 6 0 − 2 − 4 OUTPUT 2 8 − 4 − 7 − 10 +2 OUTPUT 5 2 1 0

LOPT PLOT INEL LINE RGHAP GRAPH ATRDENCOOI COORDINATE UQIENAOT EQUATION EILANR LINEAR

September 2021 Plotting Linear Graphs: Table of Values

Plot one of these lines using a table of values. KNOWLEDGE CHECK

Plot one of these lines using a table of values. KNOWLEDGE CHECK

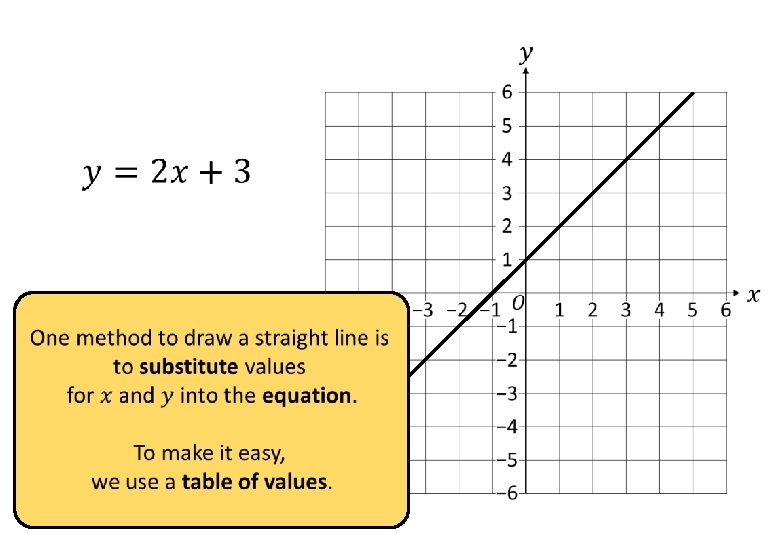
A taxi charges $2 per mile. There is also a $3 callout charge. How much does it cost to go… 2 miles? $7 3 miles? $9 10 miles? $23 How is distance related to cost? Can you draw a function machine? Can you write an equation? × 2 $ +3 Miles

Vocabulary Equation Point Variables We plot, or draw, a graph on a grid. The line represents all the values where the equation is true, is satisfied. Origin (0 , 0) Line Segment (it goes forever)
 Express the equation as a")
Draw the graph of: Always label your line! 1) Express the equation as a function machine. +2 2) Complete a Table of Values. − 3 − 2 − 1 0 1 2 3 − 1 0 3 4 5 1 2 3) Plot each pair of values as coordinates. 4) Join the points to make a line. × × × ×
 Express the equation as a function machine. − 3")
Draw the graph of: 1) Express the equation as a function machine. − 3 2) Complete a Table of Values. − 3 − 2 − 1 0 1 2 3 − 6 − 5 − 4 − 3 − 2 − 1 0 3) Plot each pair of values as coordinates. 4) Join the points to make a line. × × × ×
 Express the equation as a function machine. ×")
Draw the graph of: × 1) Express the equation as a function machine. × × 2) Complete a Table of Values. × − 3 − 2 − 1 0 1 2 3 − 6 − 4 − 2 0 2 4 6 3) Plot each pair of values as coordinates. 4) Join the points to make a line. × × ×
 Express the equation as a function machine. × 2")
Draw the graph of: 1) Express the equation as a function machine. × 2 × +1 × × 2) Complete a Table of Values. − 3 − 2 − 1 0 1 2 3 − 5 − 3 − 1 1 3 5 7? ? × × × 3) Plot each pair of values as coordinates. 4) Join the points to make a line.
 Express the equation as a function machine. × 3")
Draw the graph of: 1) Express the equation as a function machine. × 3 × − 4 × 2) Complete a Table of Values. − 3 − 2 − 1 0 1 2 3 − 12 − 7 − 4 − 1 2 5 3) Plot each pair of values as coordinates. 4) Join the points to make a line. × ×
 Complete a Table of Values. − 3 − 2")
Draw the graph of: 1) Complete a Table of Values. − 3 − 2 − 1 0 1 2 3 1 5 6 7 2 3 4 2) Plot each pair of values as coordinates. 3) Join the points to make a line.
 Complete a Table of Values. − 3 − 2")
Draw the graph of: 1) Complete a Table of Values. − 3 − 2 − 1 0 1 2 3 − 5 − 3 − 1 1 3 5 7 2) Plot each pair of values as coordinates. 3) Join the points to make a line.
 Complete a Table of Values. − 3 − 2")
Draw the graph of: 1) Complete a Table of Values. − 3 − 2 − 1 0 1 2 3 0. 5 1 1. 5 2 2. 5 3 3. 5 2) Plot each pair of values as coordinates. 3) Join the points to make a line.
 Complete a Table of Values. − 3 − 2")
Draw the graph of: 1) Complete a Table of Values. − 3 − 2 − 1 0 1 8 0 − 2 − 4 6 4 2 2 3 2) Plot each pair of values as coordinates. 3) Join the points to make a line.

You only need 2 points to plot a straight line. Why bother with the rest? 0 − 2 3 − 1 Do you agree?

Complete a table of values for each equation. Can you spot some mistakes? − 3 − 2 − 1 0 1 1 2 3 4 − 3 − 2 − 1 0 1 2 − 13 − 1 3 3 6 − 3 − 2 − 1 0 7 3 6 1 2 3

Are there patterns in the values? − 3 − 2 − 1 0 1 2 3 0 4 5 6 − 2 − 2 0 2 4 6 2 3 1 2 4 − 4 3 − 2 − 1 0 1 2 3 − 2 − 1 0 1 − 13 − 10 − 7 − 4 − 1 3 5 9 1 − 3 2 7 6 3 5

Complete a table of values for each equation. Can you spot some mistakes? − 3 − 2 − 1 0 − 2 − 3 − 2 − 1 0 1. 5 1 2 3 3 1 − 3 − 2 − 1 0 1 − 14 2 3 3. 5 − 3 − 2 − 1 0 7 2 3 − 1 1 2 3 − 4

Are there patterns in the values? − 3 − 2 − 1 0 1 2 3 − 2 − 1 0 1 − 5 − 2 − 1 1 3 5 7 − 14 − 11 − 8 − 5 − 2 − 1 4 − 3 − 2 − 1 0 3 1 1 2 3 1. 5 1 1. 5 2 2. 5 3 3. 5 0. 5 2 − 3 − 2 − 1 0 1 7 0 − 2 − 4 8 6 4 2 2 3

Drawing Straight Line Graphs − 3 − 2 − 1 0 1 2 ① 3 4 c) Join the points into a line and label. 4) What can we say about these 3 lines? − 3 − 2 − 1 0 1 2 3

Drawing Straight Line Graphs ① − 3 − 2 − 1 0 1 2 3 − 1 0 3 4 5 1 2 c) Join the points into a line and label. − 3 − 2 − 1 0 4) What can we say about these 3 lines? 2 3 − 5 − 4 − 3 − 2 − 1 0 1 2 3 1 5 6 7 2 3 4 1 They are parallel − 3 − 2 − 1 0 1 2 3 − 5 − 3 − 1 1 3 5 7

Drawing Straight Line Graphs − 3 − 2 − 1 0 1 2 ① 3 − 2 − 1 0 4 − 1 0 c) Join the points into a line and label. 4) What can we say about these 3 lines? Drawing Straight Line Graphs 1 2 ① 3 4 c) Join the points into a line and label. − 3 − 2 − 1 0 1 2 3 4) What can we say about these 3 lines?
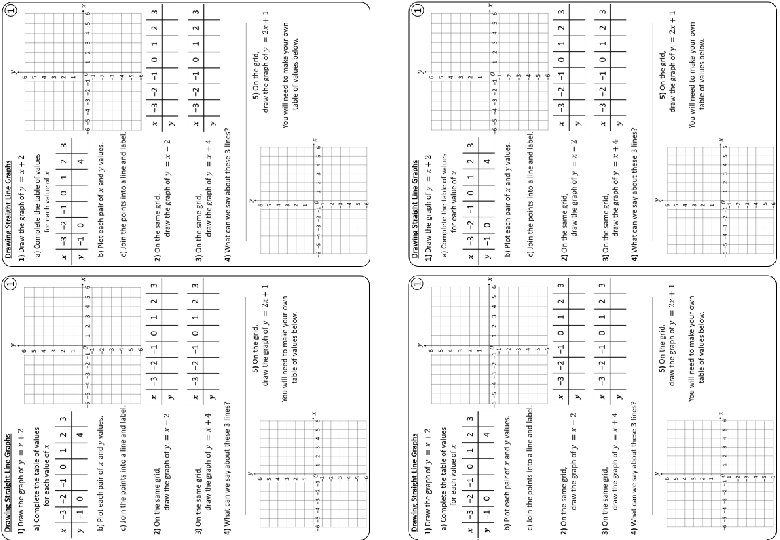

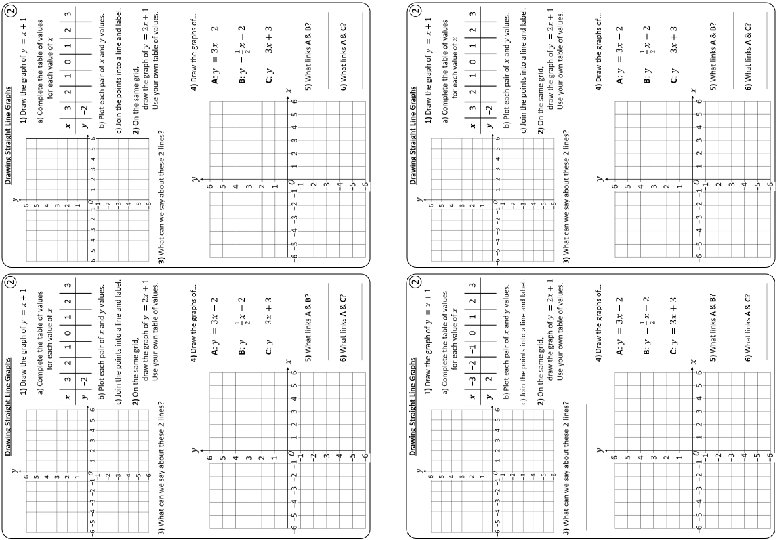
Drawing Straight Line Graphs − 3 − 2 − 1 0 ② 1 2 3 − 2 c) Join the points into a line and label. 3) What can we say about these 2 lines? 4) Draw the graphs of… 5) What links A & B? 6) What links A & C?

Drawing Straight Line Graphs ② − 3 − 2 − 1 0 1 2 3 − 2 − 1 0 2 3 4 1 c) Join the points into a line and label. 3) What can we say about these 2 lines? C A 4) Draw the graphs of… B 5) What links A & B? 6) What links A & C? They have the same gradient.

Drawing Straight Line Graphs − 3 − 2 − 1 0 ② 1 2 Drawing Straight Line Graphs 3 − 2 − 1 0 − 2 ② 1 2 3 − 2 c) Join the points into a line and label. 3) What can we say about these 2 lines? 4) Draw the graphs of… 5) What links A & B? 6) What links A & C?

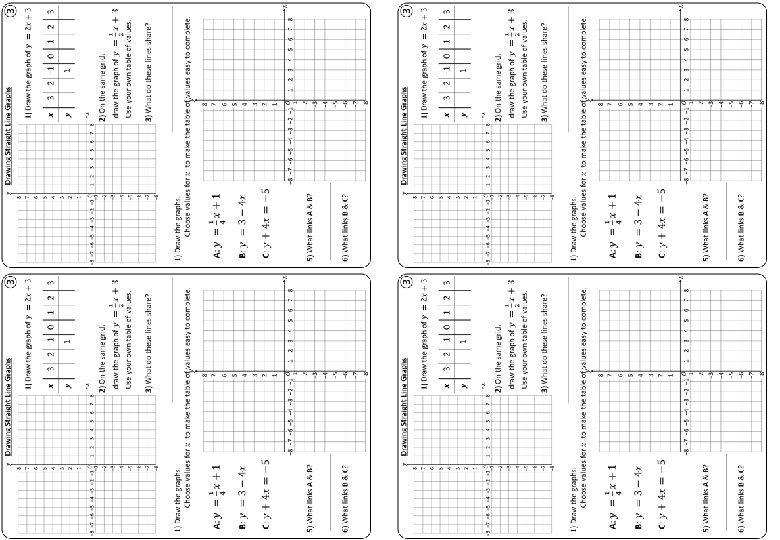
Drawing Straight Line Graphs ③ − 3 − 2 − 1 0 1 2 1 3) What do these lines share? 5) What links A & B? 6) What links B & C? 3

Drawing Straight Line Graphs ③ − 3 − 2 − 1 0 1 2 3 − 1 1 5 7 9 3 3) What do these lines share? 5) What links A & B? Cross at 90° 6) What links B & C? Parallel

Drawing Straight Line Graphs ③ − 3 − 2 − 1 0 1 2 3 ③ − 3 − 2 − 1 0 1 2 1 1 3) What do these lines share? 5) What links A & B? 6) What links B & C? 3

Plot one of these lines using a table of values. KNOWLEDGE CHECK

Plot one of these lines using a table of values. KNOWLEDGE CHECK

What do the three lines share on each grid?

What do the three lines share on each grid? Different lines, same gradient.

D C A B

Check your success!

Check your success!

Questions? Comments? Suggestions? …or have you found a mistake!? Any feedback would be appreciated . Please feel free to email: tom@goteachmaths. co. uk
- Slides: 51