Linear Functions Algebra 2 Concepts A relation is

Linear Functions Algebra 2 Concepts

A relation is a set of ordered pairs. The domain is the set of all x values in the relation domain = {-1, 0, 2, 4, 9} These are the x values written in a set from smallest to largest {(2, 3), (-1, 5), (4, -2), (9, 9), (0, -6)} These are the y values written in a set from smallest to largest range = {-6, -2, 3, 5, 9} The range is the set of all y values in the relation This is a relation

A function f from set A to set B is a rule of correspondence that assigns to each element x in the set A exactly one element y in the set B. re a ’s ed x l Al sign as 1 2 2 4 3 6 8 10 4 5 Set A is the domain This is a function ---it meets our conditions Set B is the range Must use all the x’s The x value can only be assigned to one y

Let’s look at another relation and decide if it is a function. The secondition says each x can have only one y, but it CAN be the No same y as another x gets assigned to. x tha has as n on mor e sig e 1 y ne e 2 d r a 2 ’s ed x l 4 Al sign 3 as 6 4 8 10 5 Set A is the domain This is a function ---it meets our conditions Set B is the range Must use all the x’s The x value can only be assigned to one y

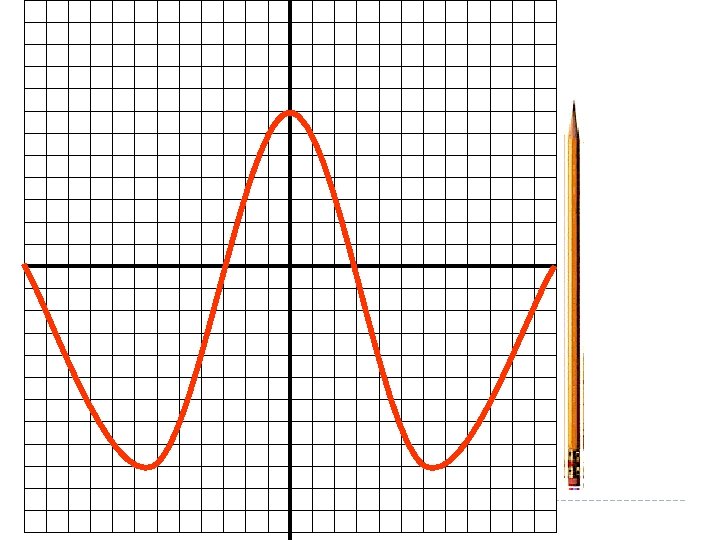
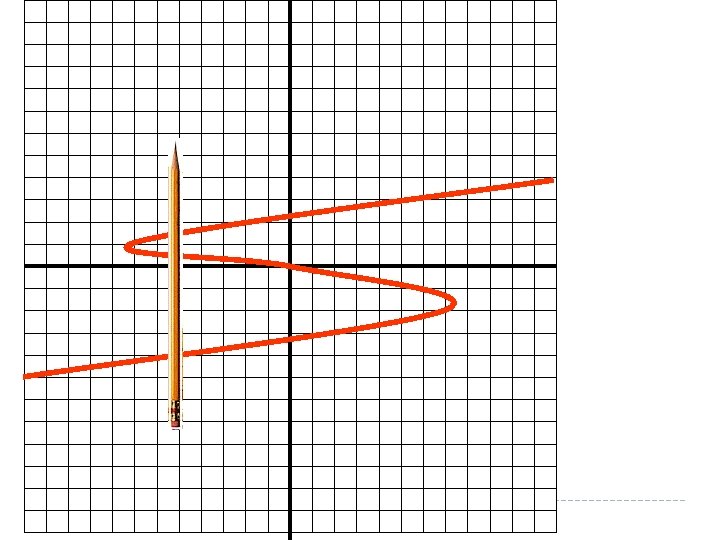
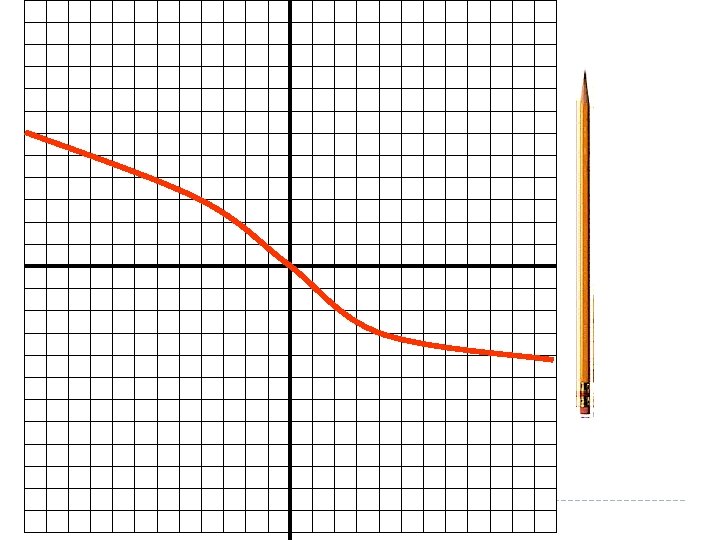
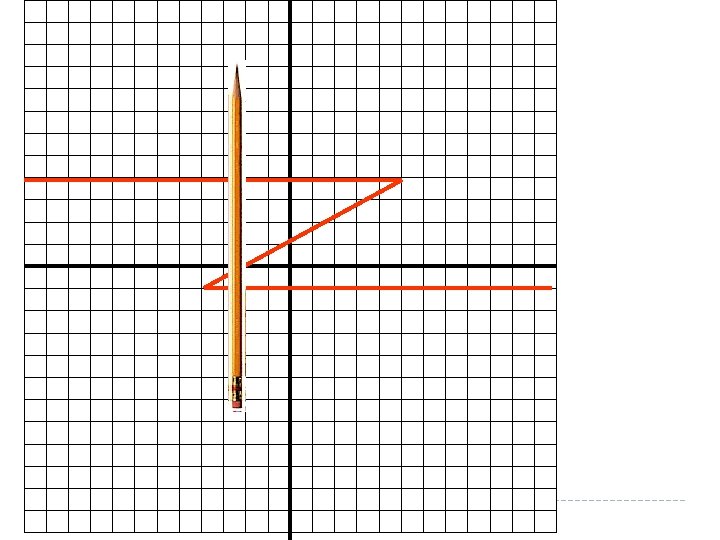
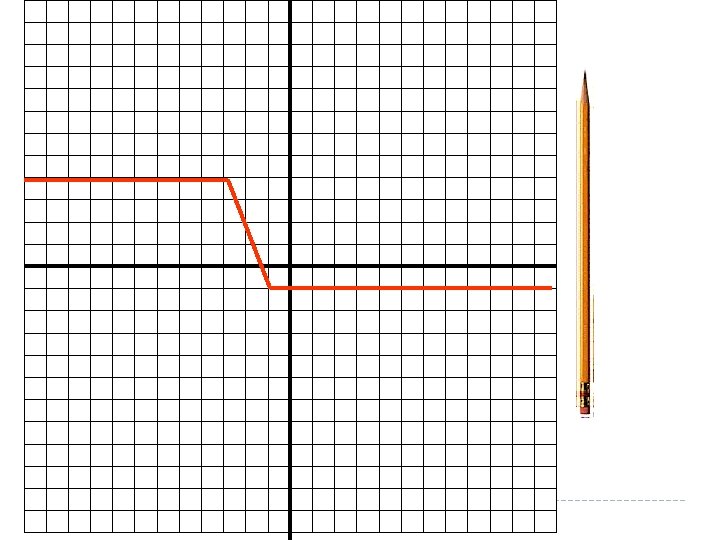
If a vertical line passes through a graph more than once, the graph is not the graph of a function. Hint: Pass a pencil across the graph held vertically to represent a vertical line. The pencil crosses the graph more than once. This is not a function because there are two y-values for the same x-value.

We commonly call functions by letters. Because function starts with f, it is a commonly used letter to refer to functions. This means the right hand side is a function called f This means the right hand side has the variable x in it The left side DOES NOT MEAN f times x like brackets usually do, it simply tells us what is on the right hand side. The left hand side of this equation is the function notation. It tells us two things. We called the function f and the variable in the function is x.

Remember---this tells you what is on the right hand side---it is not something you work. It says that the right hand side is the function f and it has x in it. So we have a function called f that has the variable x in it. Using function notation we could then ask the following: Find f (2). This means to find the function f and instead of having an x in it, put a 2 in it. So let’s take the function above and make brackets everywhere the x was and in its place, put in a 2. Don’t forget order of operations---powers, then multiplication, finally addition & subtraction
. This means to find the function f and instead of")
Find f (2 k). This means to find the function f and instead of having an x in it, put a 2 k in it. So let’s take the function above and make brackets everywhere the x was and in its place, put in a 2 k. Don’t forget order of operations---powers, then multiplication, finally addition & subtraction

Graphing Linear Equations

These equations are all in Slope. Intercept Form: Notice that these equations are all solved for y.

Just by looking at an equation in this form, we can draw the line (no tables). • The constant is the y-intercept. • The coefficient is the slope. Constant = 1, y-intercept = 1. Coefficient = 2, slope = 2. Constant = -4, y-intercept = -4. Coefficient = -1, slope = -1. y-intercept = -2 slope = 3/2.

Remember the Slope Formula!

The formula for Slope-Intercept Form is: • ‘b’ is the y-intercept. • ‘m’ is the slope. On the next three slides we will graph the three equations: using their y-intercepts and slopes.
 Plot the y-intercept as a point on the y-axis. The constant,")
right 1 1) Plot the y-intercept as a point on the y-axis. The constant, b = 1, so the y-intercept = 1. right 1 up 2 2) Plot more points by counting the slope up the numerator (down if negative) and right the denominator. The coefficient, m = 2, so the slope = 2/1.
 Plot the y-intercept as a point on the y-axis. The constant, b =")
1) Plot the y-intercept as a point on the y-axis. The constant, b = -4, so the y-intercept = -4. down 1 right 1 2) Plot more points by counting the slope up the numerator (down if negative) and right the denominator. The coefficient, m = -1, so the slope = -1/1.
 Plot the y-intercept as a point on the y-axis. The constant,")
right 2 1) Plot the y-intercept as a point on the y-axis. The constant, b = -2, so the y-intercept = -2. up 3 right 2 up 3 2) Plot more points by counting the slope up the numerator (down if negative) and right the denominator. The coefficient, m = 3/2, so the slope = 3/2.

Sometimes we must solve the equation for y before we can graph it. The constant, b = 3 is the y-intercept. The coefficient, m = -2 is the slope.
 Plot the y-intercept as a point on the y-axis. The constant, b =")
1) Plot the y-intercept as a point on the y-axis. The constant, b = 3, so the y-intercept = 3. down 2 right 1 2) Plot more points by counting the slope up the numerator (down if negative) and right the denominator. The coefficient, m = -2, so the slope = -2/1.

These equations are all in Slope. Intercept Form: Notice that these equations are all solved for y.

Just by looking at an equation in this form, we can draw the line (no tables). • The constant is the y-intercept. • The coefficient is the slope. Constant = 1, y-intercept = 1. Coefficient = 2, slope = 2. Constant = -4, y-intercept = -4. Coefficient = -1, slope = -1. y-intercept = -2 slope = 3/2.

The formula for Slope-Intercept Form is: • ‘b’ is the y-intercept. • ‘m’ is the slope. On the next three slides we will graph the three equations: using their y-intercepts and slopes.
 Plot the y-intercept as a point on the y-axis. The constant,")
right 1 1) Plot the y-intercept as a point on the y-axis. The constant, b = 1, so the y-intercept = 1. right 1 up 2 2) Plot more points by counting the slope up the numerator (down if negative) and right the denominator. The coefficient, m = 2, so the slope = 2/1.
 Plot the y-intercept as a point on the y-axis. The constant, b =")
1) Plot the y-intercept as a point on the y-axis. The constant, b = -4, so the y-intercept = -4. down 1 right 1 2) Plot more points by counting the slope up the numerator (down if negative) and right the denominator. The coefficient, m = -1, so the slope = -1/1.
 Plot the y-intercept as a point on the y-axis. The constant,")
right 2 1) Plot the y-intercept as a point on the y-axis. The constant, b = -2, so the y-intercept = -2. up 3 right 2 up 3 2) Plot more points by counting the slope up the numerator (down if negative) and right the denominator. The coefficient, m = 3/2, so the slope = 3/2.

Sometimes we must solve the equation for y before we can graph it. The constant, b = 3 is the y-intercept. The coefficient, m = -2 is the slope.
 Plot the y-intercept as a point on the y-axis. The constant, b =")
1) Plot the y-intercept as a point on the y-axis. The constant, b = 3, so the y-intercept = 3. down 2 right 1 2) Plot more points by counting the slope up the numerator (down if negative) and right the denominator. The coefficient, m = -2, so the slope = -2/1.
- Slides: 31