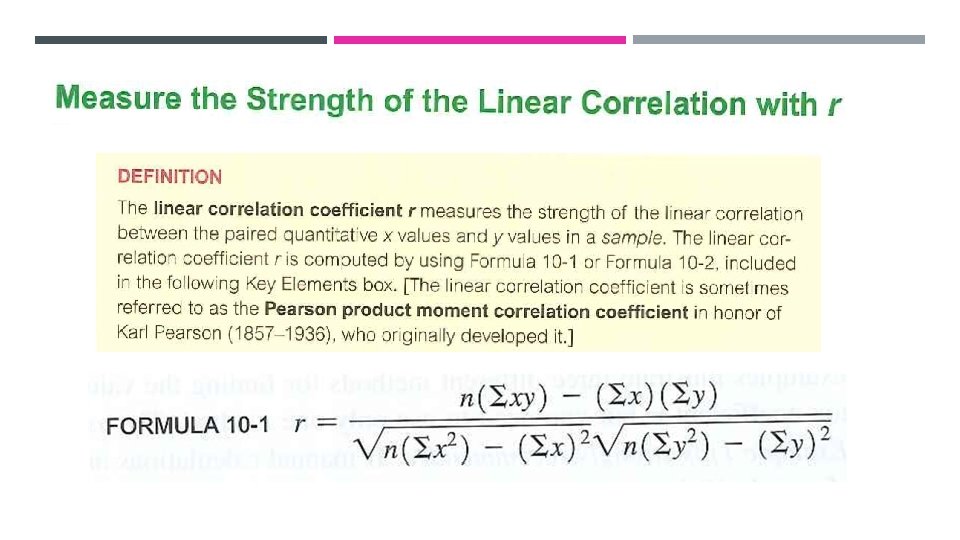
LINEAR CORRELATION AND REGRESSION OBJECTIVES OF LINEAR CORRELATION

LINEAR CORRELATION AND REGRESSION

OBJECTIVES OF LINEAR CORRELATION AND LINEAR REGRESSION

BASIC CONCEPT OF CORRELATION

EXAMPLE

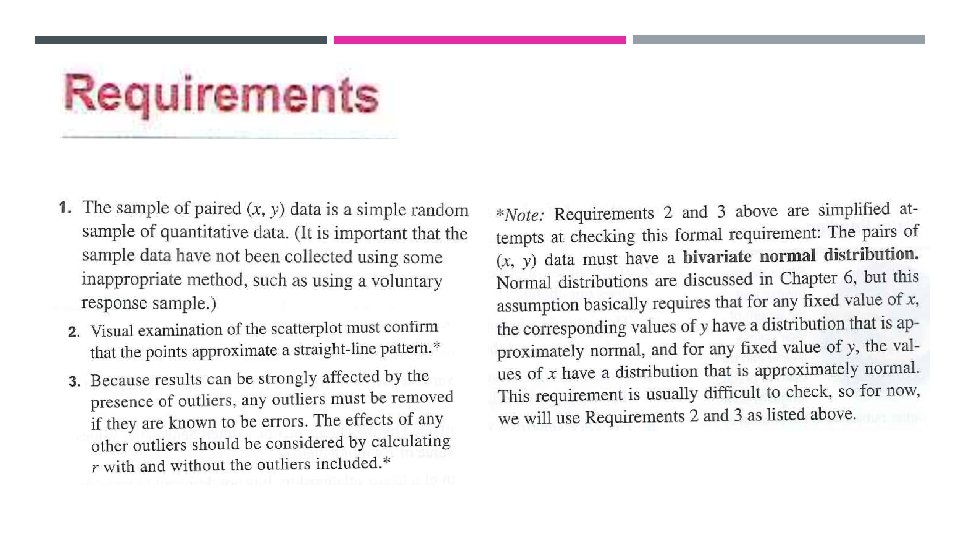
EXPLORING DATA WITH GRAPH

INTERPRETING SCATTERPLOTS
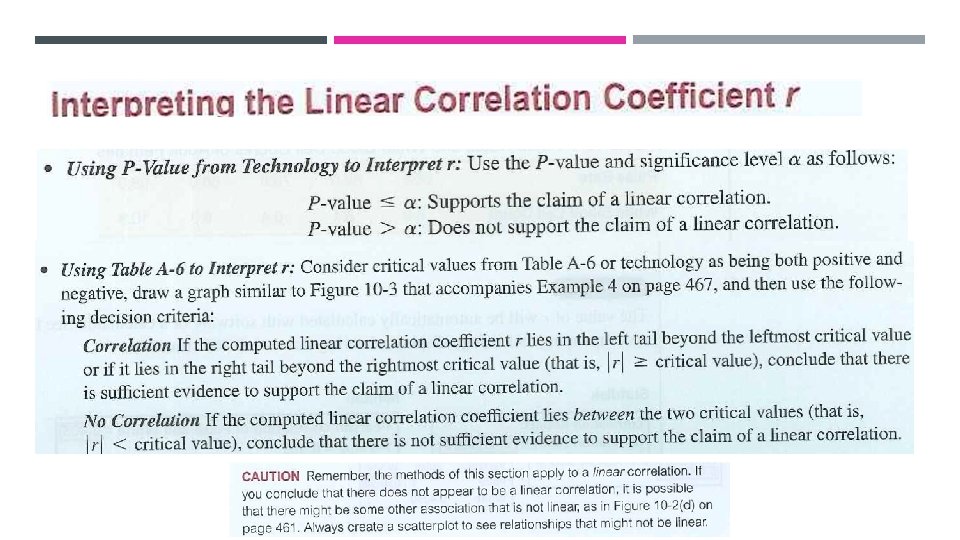

r= 1. 5 <r<1 0 <r<. 5 r= 0 -. 5 <r<0 -1<r<-. 5 r= -1 Perfect positive correlation Strong positive correlation Weak positive correlation No correlation Weak negative correlation Strong negative correlation Perfect negative correlation

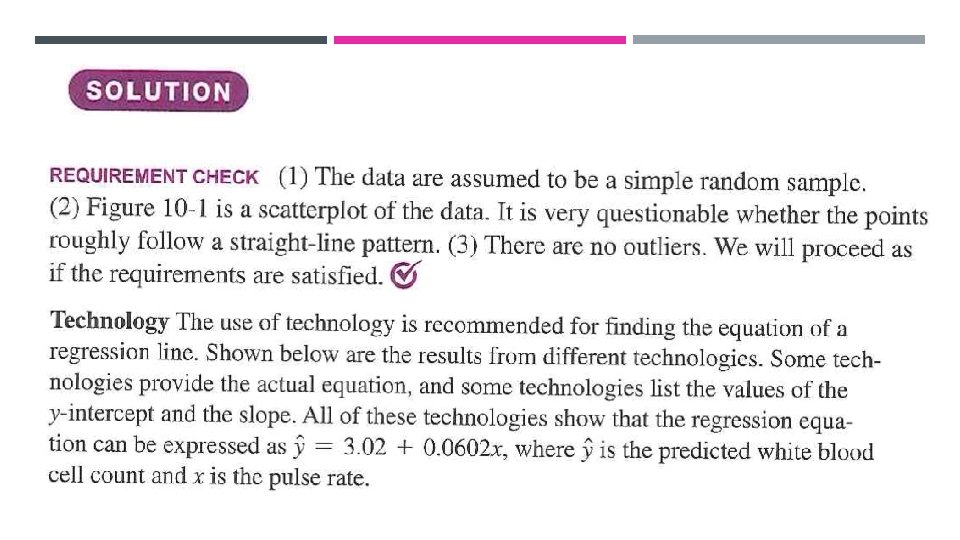
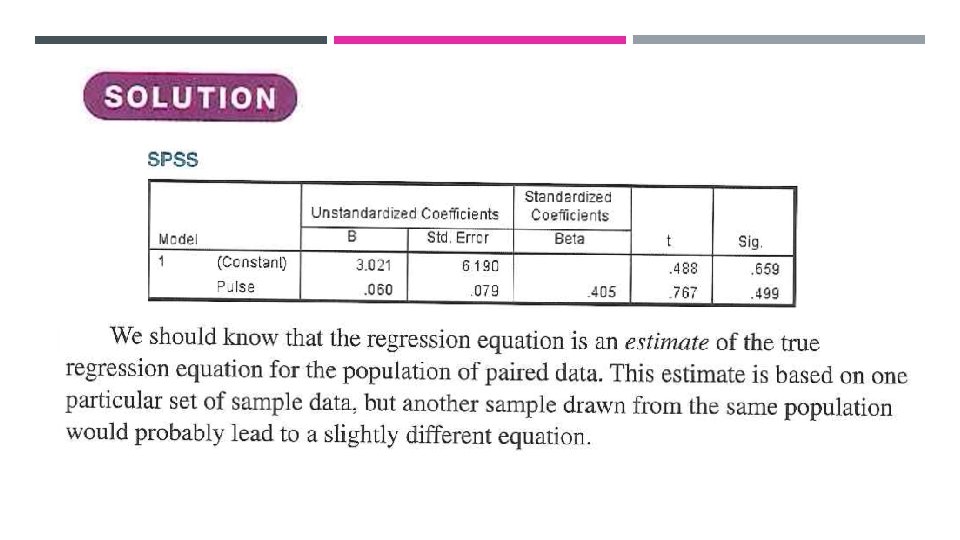
EXAMPLE 1 USING SPSS

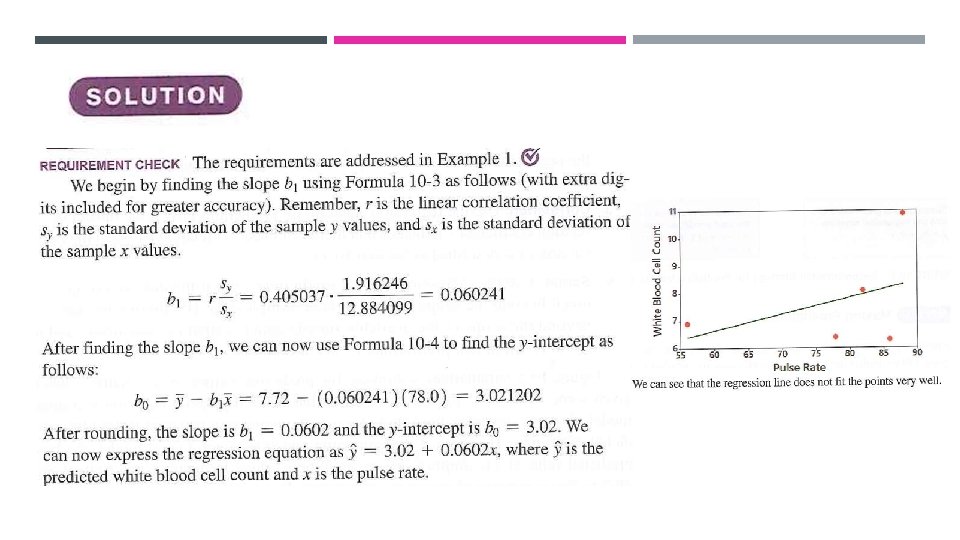
EXAMPLE 2 USING CALCULATOR
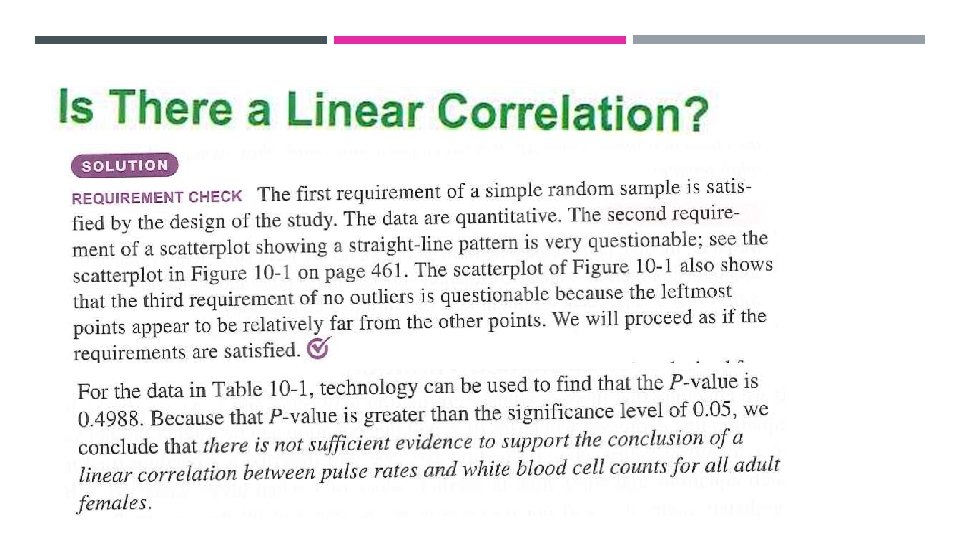

INTERPRETATION So r-0. 405 can we say the correlation is significant? We have to test the hypothesis : As p-value=0. 499 > 0. 05 then we do not reject H 0

17

With n-2=3 degrees of freedom, table A-3 shows that critical values of t=± 3. 182, therefor the test statistic fall into the non-rejection region. Alternative way for the decision is to compare p-value with significant level and as p-value=0. 499> 0. 05 then a similar decision can be made.

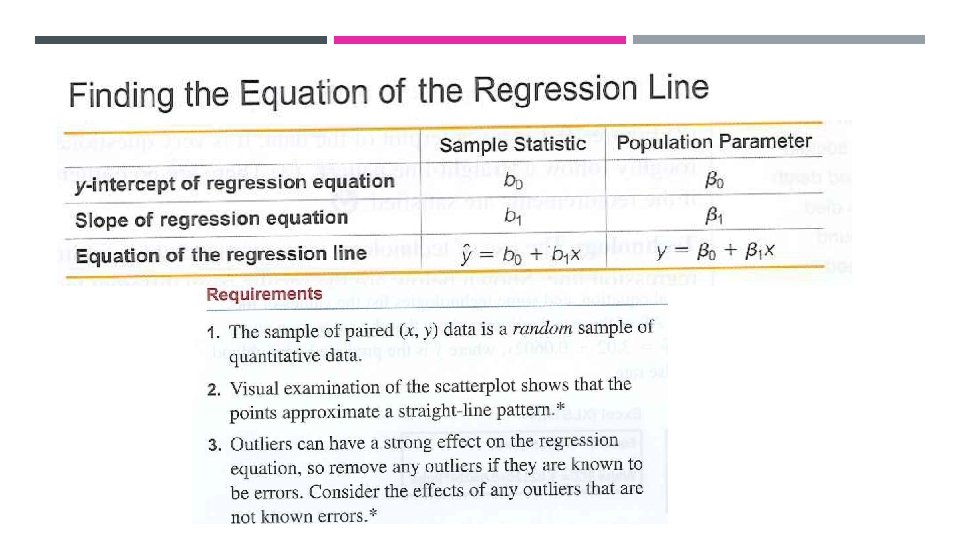
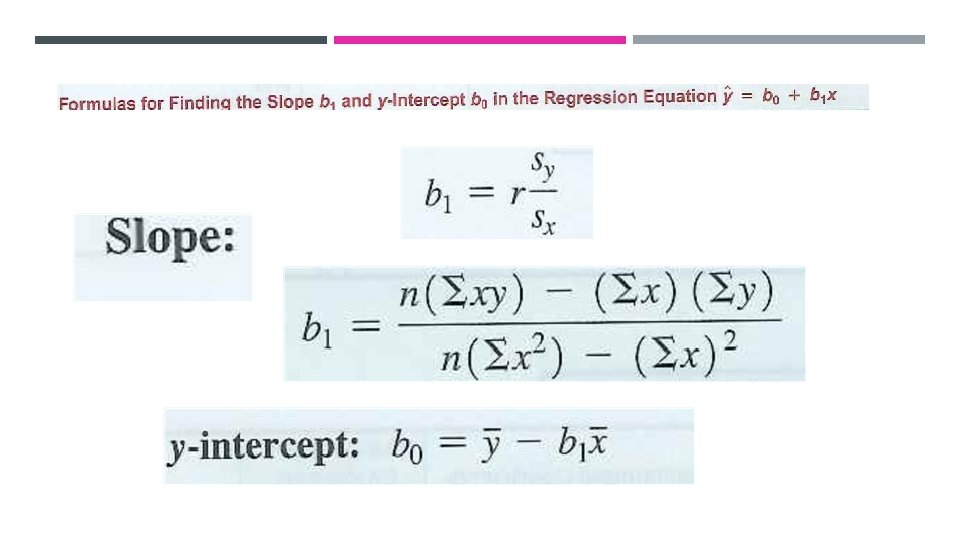
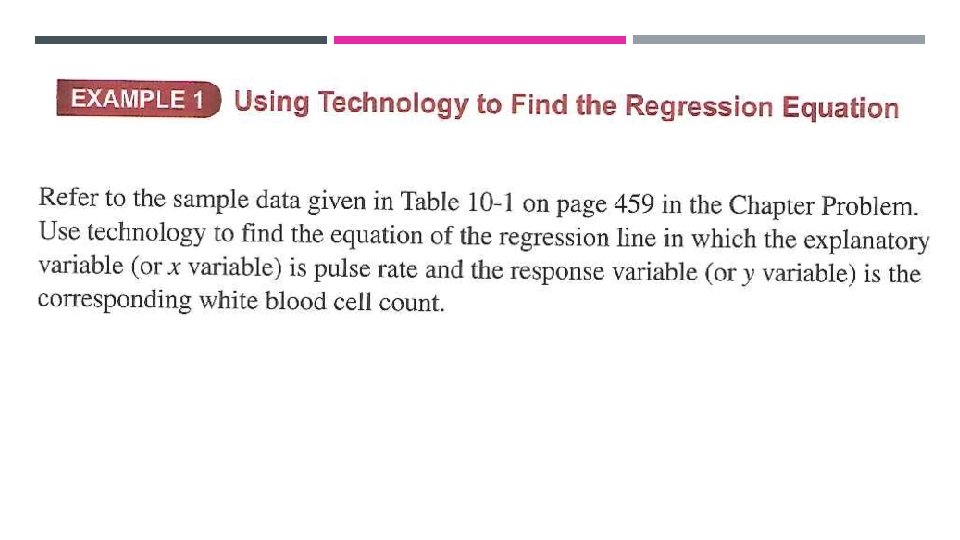
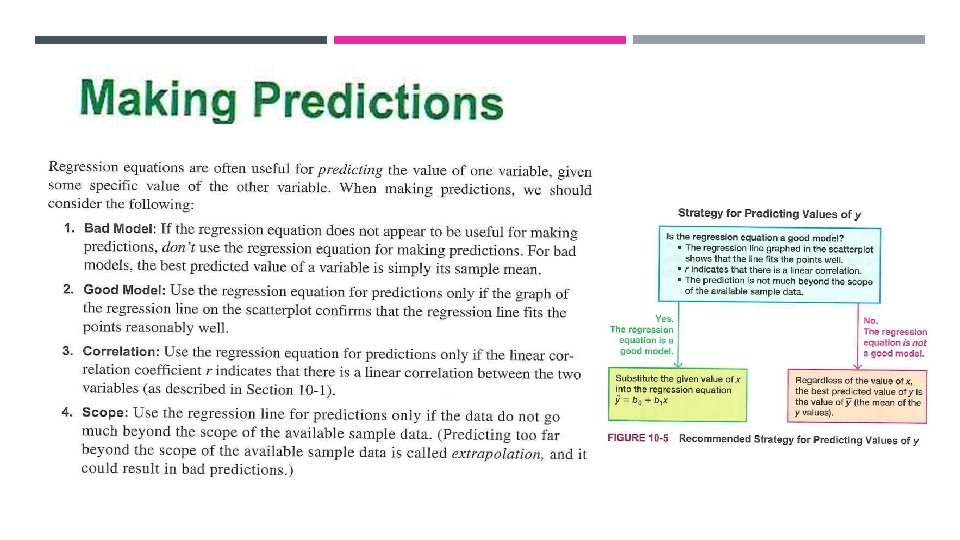
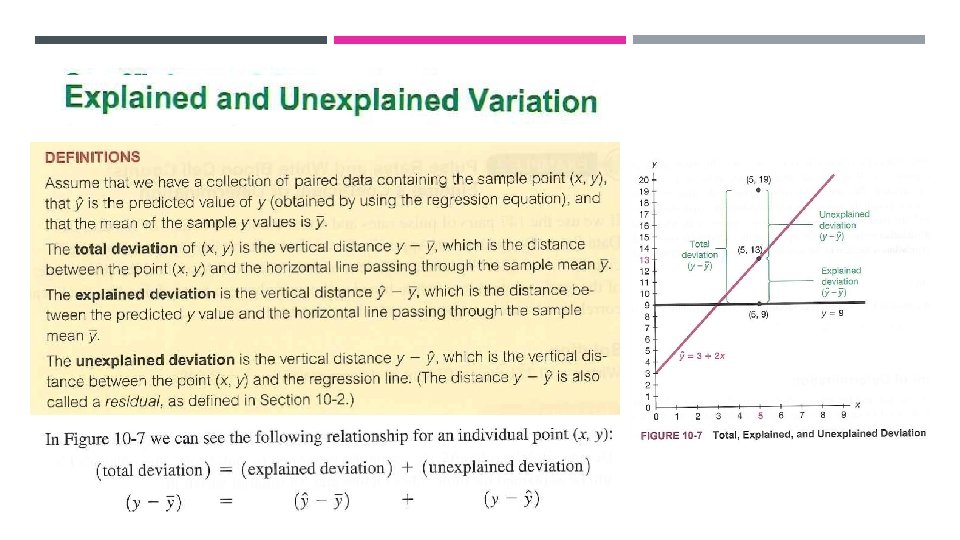
REGRESSION EQUATION

A residual plot can be another helpful tool for analysing correlation and regression results and for checking the requirements necessary for making inferences about correlation and regression. When analysing a residual plot, look for a pattern in the way the points are configured, and use these criteria:
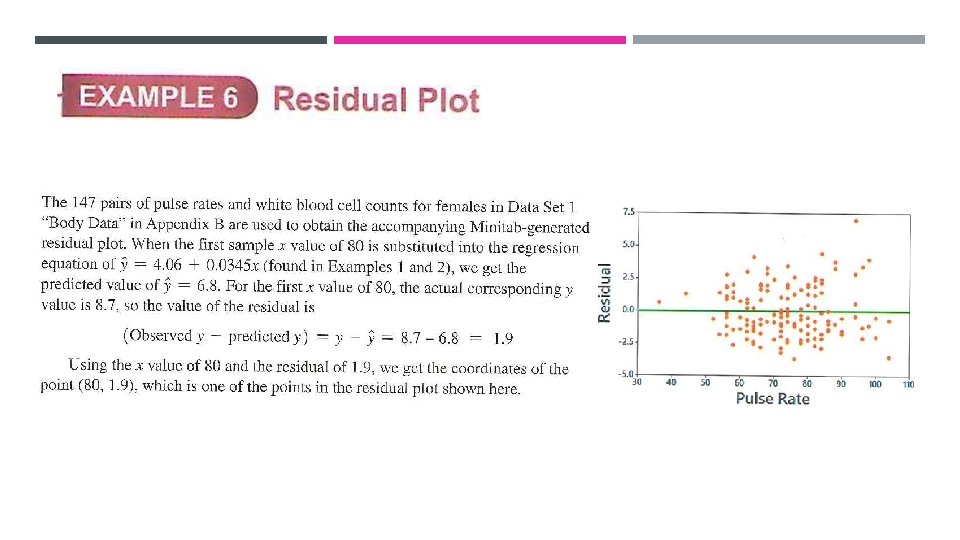

RESIDUAL PLOT
 shows the body weight and plasma volume of eight healthy")
EXAMPLE SPSS Table (4) shows the body weight and plasma volume of eight healthy men. A scatter diagram of these data (Figure (2)) shows that high plasma volume tends to be associated with high weight and vice versa. Table (4): Plasma volume and body weight in eight healthy men Subject Body weight (kg) Plasma volume (l) 1 58. 0 2. 75 2 70. 0 2. 86 3 74. 0 3. 37 4 63. 5 2. 76 5 62. 0 2. 62 6 70. 5 3. 49 7 71. 0 3. 05 8 66. 0 3. 12

USE OF SPSS program can be used in order to avoid the tedious calculation described above. Analyze Regression Linear And then this box appears in which we should move the dependent variable and independent variable and then ok.

SPSS EXAMPLE Then we receive three tables, the first table represent correlation coefficient, determination coefficient and standard error of estimate. Model Summary Model 1 R. 749 a a. R Square. 560 Adjusted R Std. Error of the Square Estimate. 487 . 22290 Predictors: (Constant), body The second table represent the values of the regression coefficients and the significant tests for both coefficients. In addition, confident intervals for both coefficients. The last table represent the significant test for the whole regression equation.

SIGNIFICANCE TEST A test is used to test whether differs significantly from a specified value, denoted by Testing procedure is as follow: Step 2: From previous SPSS output t= 2. 765 And p-value=0. 033 < α=0. 05 Step 3: we conclude that there is a linear relationship between body weight and plasma volume. Plasma volume does increase significantly with (P < 0. 05) body weight.

EXERCISE A marketing research company wishes to study whethere is a relationship between advertising budget and sales volume in the trading of Shemaghs therefore, they have collected data on advertising budget and sales volume of 10 companies operating in this sector and the following table shows the advertising budget (in millions of Riyals ) and sales volume (in millions Riyals ): What is required : 1. What is the shape of the relationship between the two variables of the form of spreading Scatter plot? 2. Is there a relationship between the two variables, and is the relationship real in the population, interpret the result? 3. How well is the regression equation explain the variation in Sales volume? 4. If there is a company intend to spend 13 (Millions of Riyals) what is the expected sale volume?
- Slides: 47