
LINEAR CONTROL SYSTEMS Ali Karimpour Associate Professor Ferdowsi
- Slides: 26
LINEAR CONTROL SYSTEMS Ali Karimpour Associate Professor Ferdowsi University of Mashhad
Lecture 20 Frequency domain charts Topics to be covered include: v v Relative stability measures for minimum phase systems. u Gain margin. u Phase margin. Nichols chart or gain phase plot. u Stability analysis with gain phase plot. Bode plot. u Stability analysis with Bode plot. Step by step Bode plot construction. 2 Dr. Ali Karimpour Feb 2013
Lecture 20 Stability margins Stability Is Not A Yes/No Proposition It's not enough to know that a system is stable or unstable. If a system is just barely stable, then a small gain in a system parameter could push the system over the edge, and you will often want to design systems with some margin of error. If you're going to do that, you'll need some measure of how stable a system is. To get such measures - and there at least two that are widely used. 3 Dr. Ali Karimpour Feb 2013
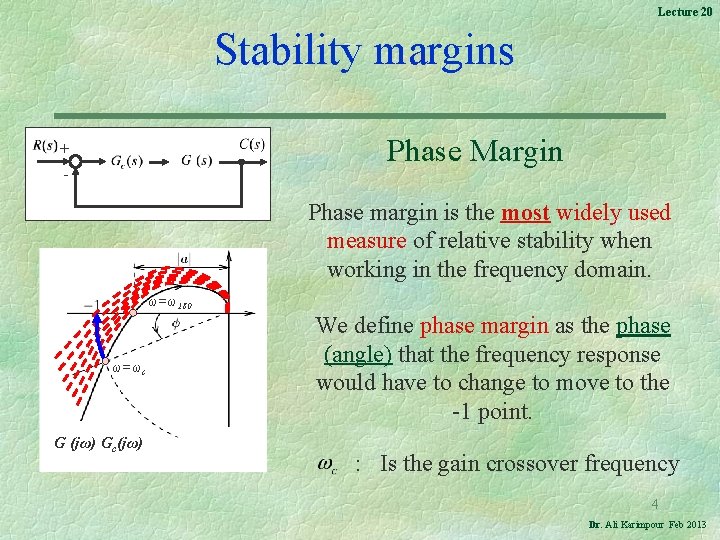
Lecture 20 Stability margins Phase Margin + - Phase margin is the most widely used measure of relative stability when working in the frequency domain. ω=ω180 ω=ωc G (jω) Gc(jω) We define phase margin as the phase (angle) that the frequency response would have to change to move to the -1 point. : Is the gain crossover frequency 4 Dr. Ali Karimpour Feb 2013
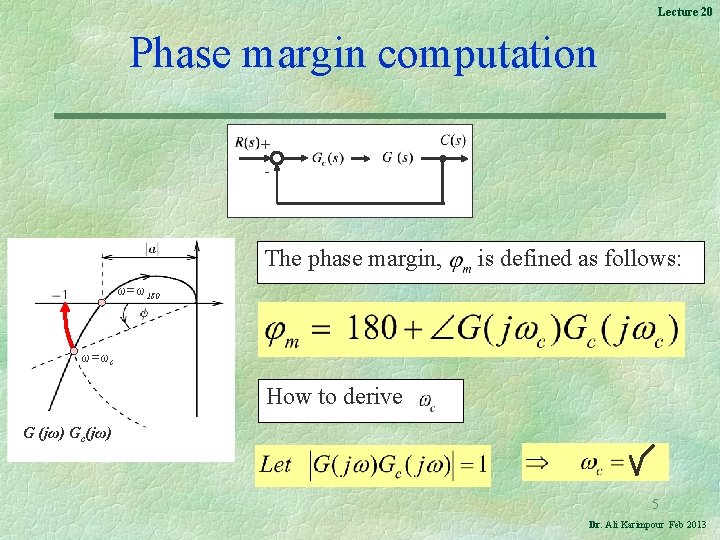
Lecture 20 Phase margin computation + - The phase margin, is defined as follows: ω=ω180 ω=ωc How to derive G (jω) Gc(jω) 5 Dr. Ali Karimpour Feb 2013
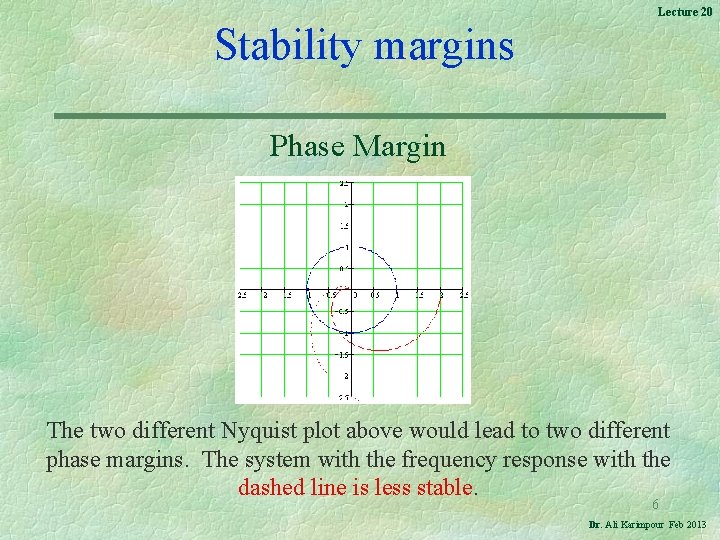
Lecture 20 Stability margins Phase Margin The two different Nyquist plot above would lead to two different phase margins. The system with the frequency response with the dashed line is less stable. 6 Dr. Ali Karimpour Feb 2013
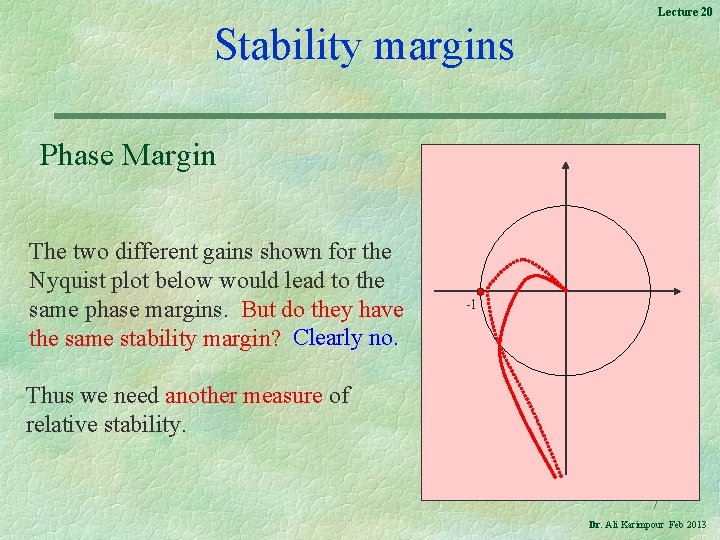
Lecture 20 Stability margins Phase Margin The two different gains shown for the Nyquist plot below would lead to the same phase margins. But do they have the same stability margin? Clearly no. -1 Thus we need another measure of relative stability. 7 Dr. Ali Karimpour Feb 2013
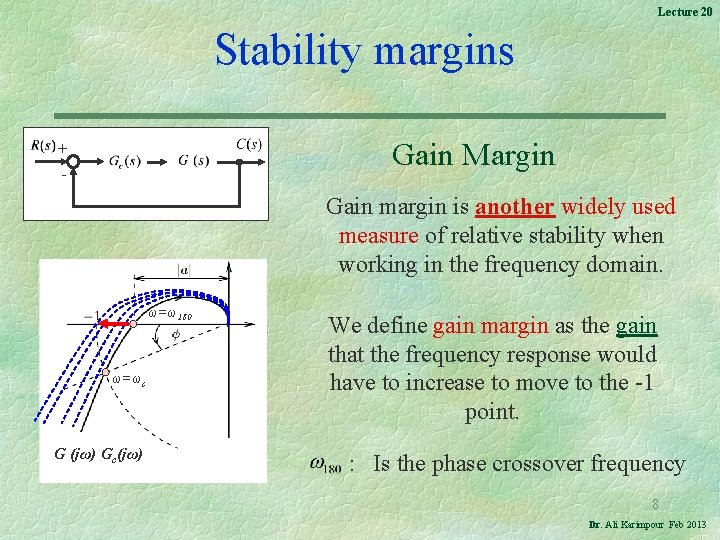
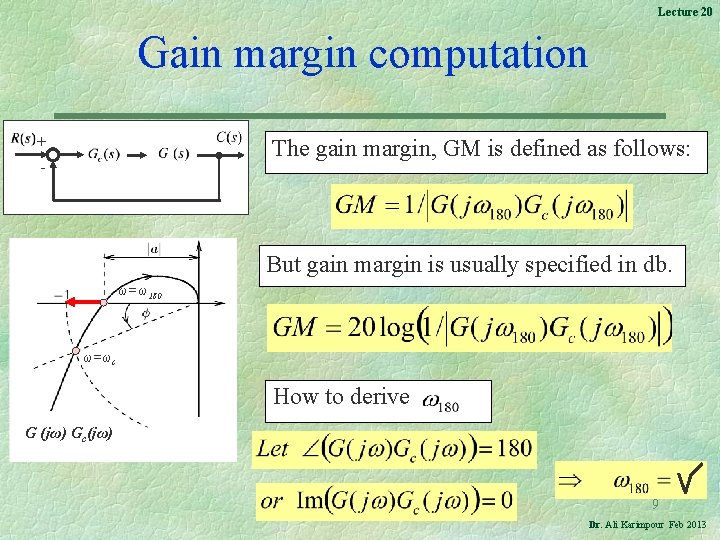
Lecture 20 Stability margins Gain Margin + - Gain margin is another widely used measure of relative stability when working in the frequency domain. ω=ω180 ω=ωc G (jω) Gc(jω) We define gain margin as the gain that the frequency response would have to increase to move to the -1 point. : Is the phase crossover frequency 8 Dr. Ali Karimpour Feb 2013
Lecture 20 Gain margin computation + The gain margin, GM is defined as follows: - But gain margin is usually specified in db. ω=ω180 ω=ωc How to derive G (jω) Gc(jω) 9 Dr. Ali Karimpour Feb 2013
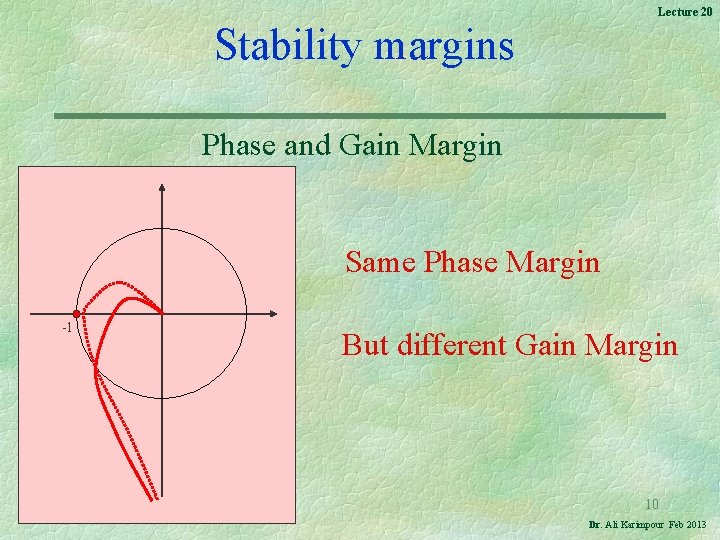
Lecture 20 Stability margins Phase and Gain Margin Same Phase Margin -1 But different Gain Margin 10 Dr. Ali Karimpour Feb 2013
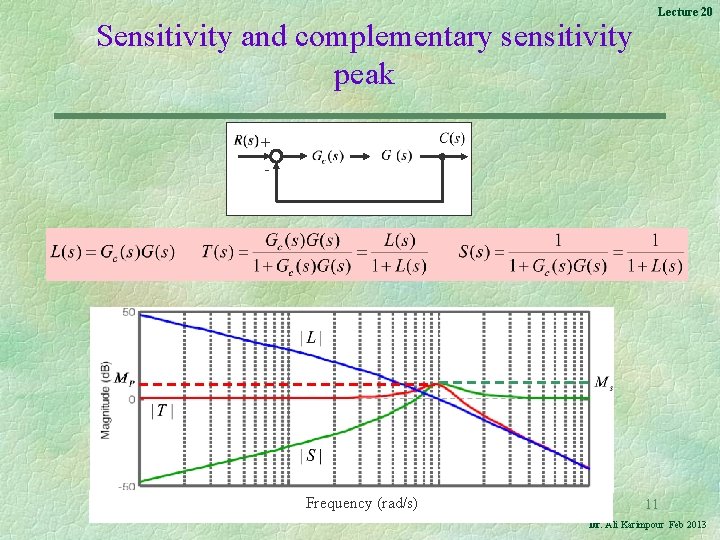
Sensitivity and complementary sensitivity peak Lecture 20 + - Frequency (rad/s) 11 Dr. Ali Karimpour Feb 2013
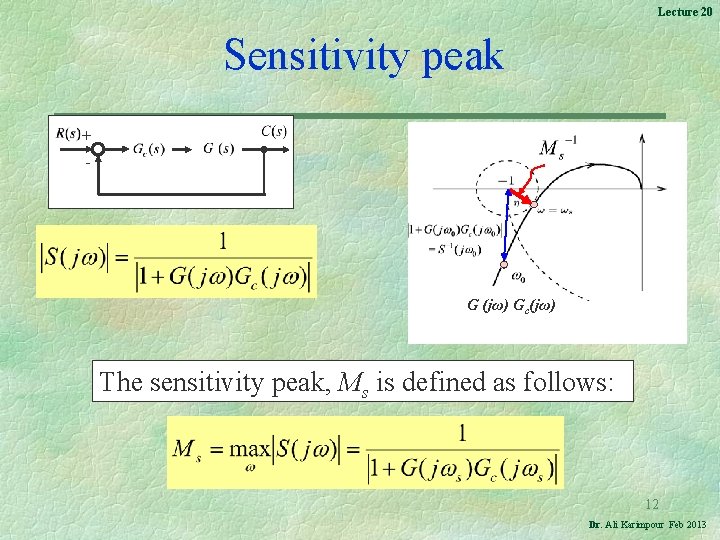
Lecture 20 Sensitivity peak + - G (jω) Gc(jω) The sensitivity peak, Ms is defined as follows: 12 Dr. Ali Karimpour Feb 2013
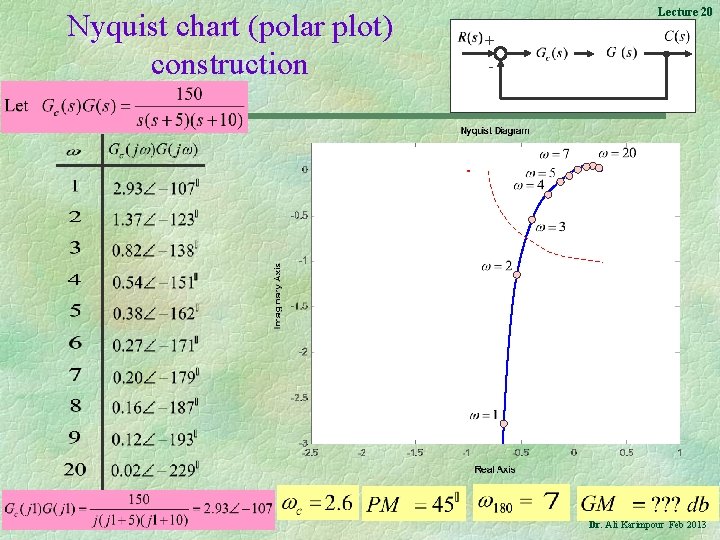
Nyquist chart (polar plot) construction Lecture 20 + - 13 Dr. Ali Karimpour Feb 2013
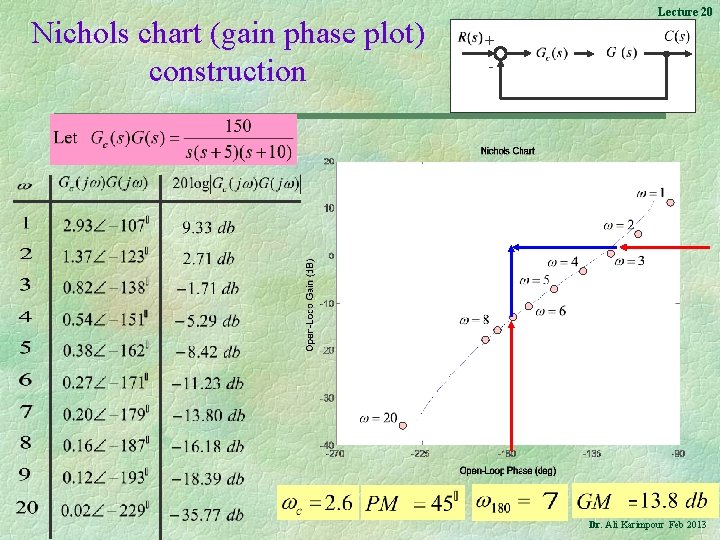
Nichols chart (gain phase plot) construction Lecture 20 + - 14 Dr. Ali Karimpour Feb 2013
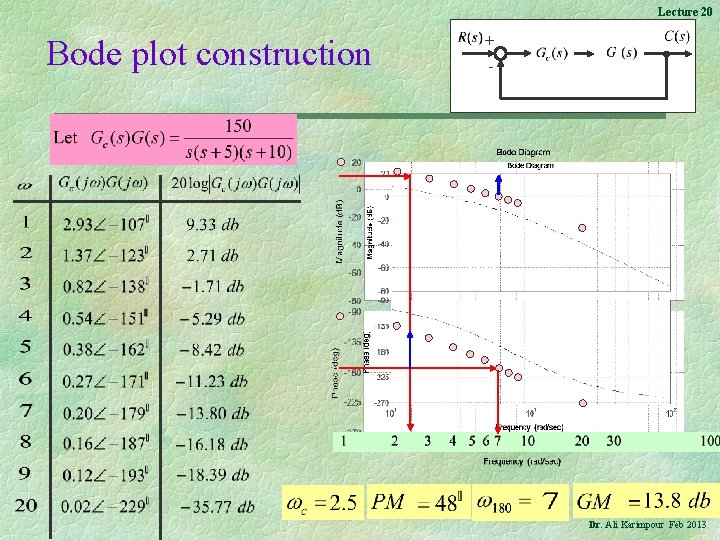
Lecture 20 Bode plot construction + - 15 Dr. Ali Karimpour Feb 2013
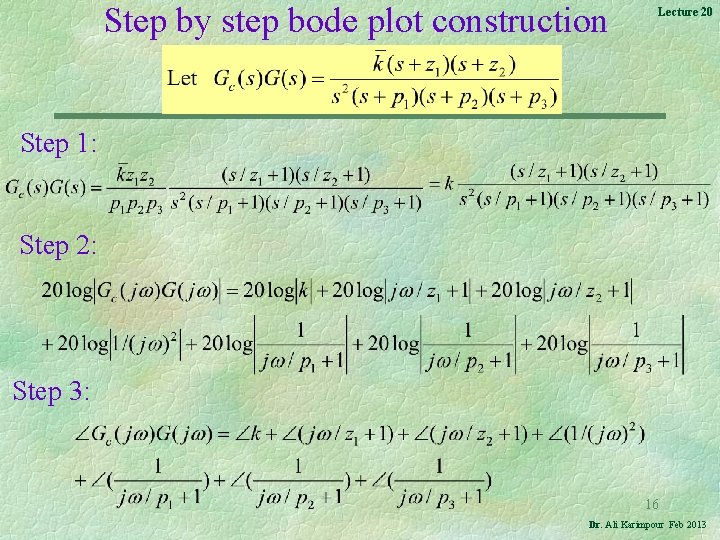
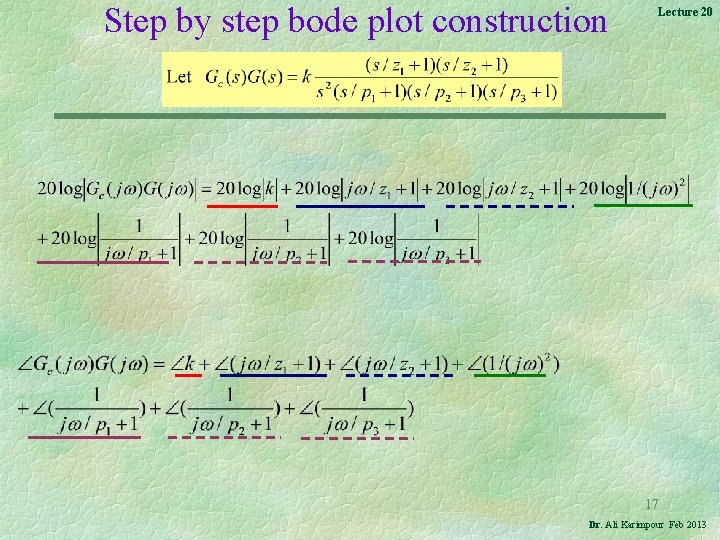
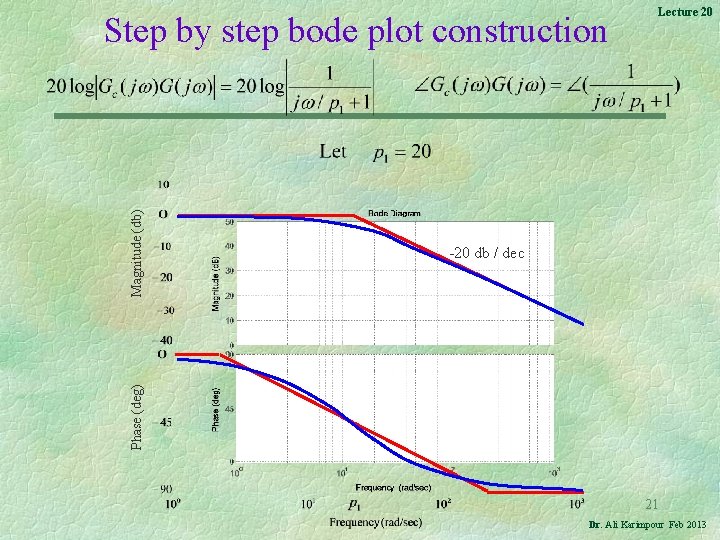
Step by step bode plot construction Lecture 20 Step 1: Step 2: Step 3: 16 Dr. Ali Karimpour Feb 2013
Step by step bode plot construction Lecture 20 17 Dr. Ali Karimpour Feb 2013
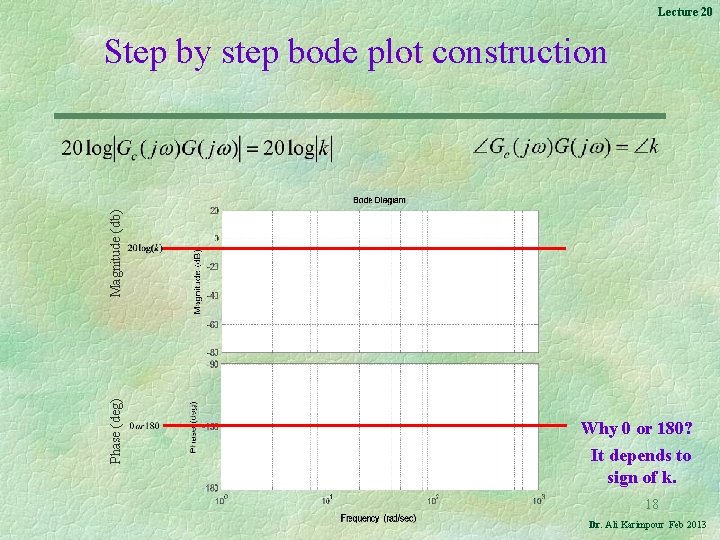
Lecture 20 Phase (deg) Magnitude (db) Step by step bode plot construction Why 0 or 180? It depends to sign of k. 18 Dr. Ali Karimpour Feb 2013
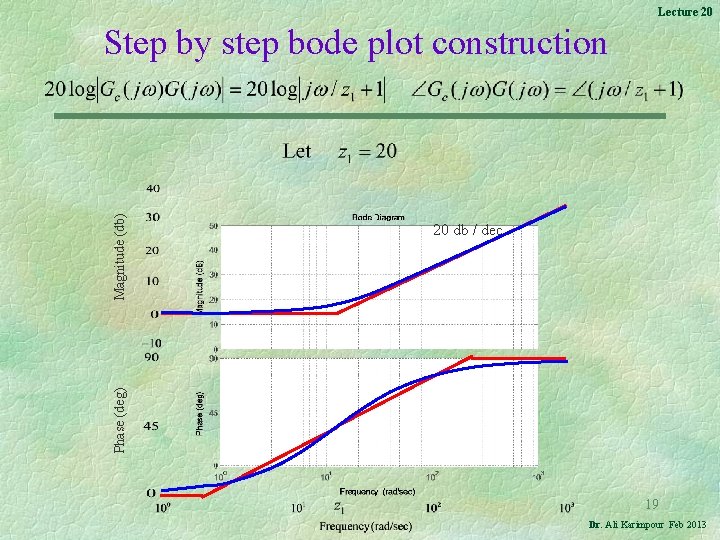
Lecture 20 Phase (deg) Magnitude (db) Step by step bode plot construction 20 db / dec 19 Dr. Ali Karimpour Feb 2013
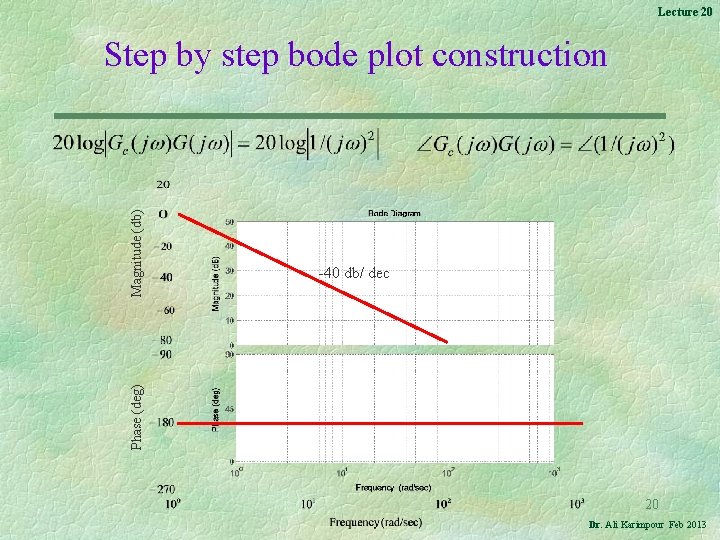
Lecture 20 Phase (deg) Magnitude (db) Step by step bode plot construction -40 db/ dec 20 Dr. Ali Karimpour Feb 2013
Phase (deg) Magnitude (db) Step by step bode plot construction Lecture 20 -20 db / dec 21 Dr. Ali Karimpour Feb 2013
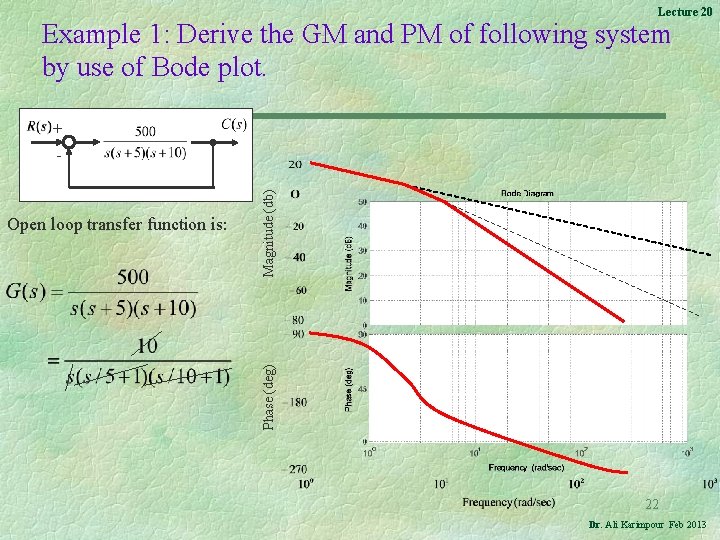
Lecture 20 Example 1: Derive the GM and PM of following system by use of Bode plot. + Open loop transfer function is: Phase (deg) Magnitude (db) - 22 Dr. Ali Karimpour Feb 2013
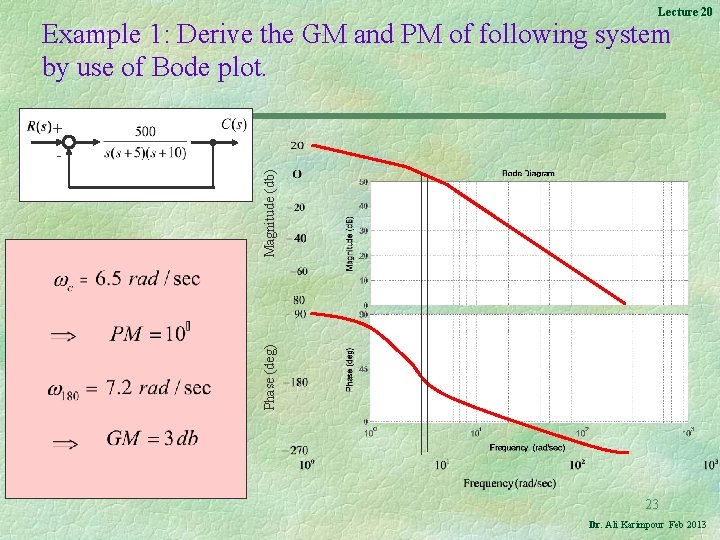
Lecture 20 Example 1: Derive the GM and PM of following system by use of Bode plot. + Phase (deg) Magnitude (db) - 23 Dr. Ali Karimpour Feb 2013
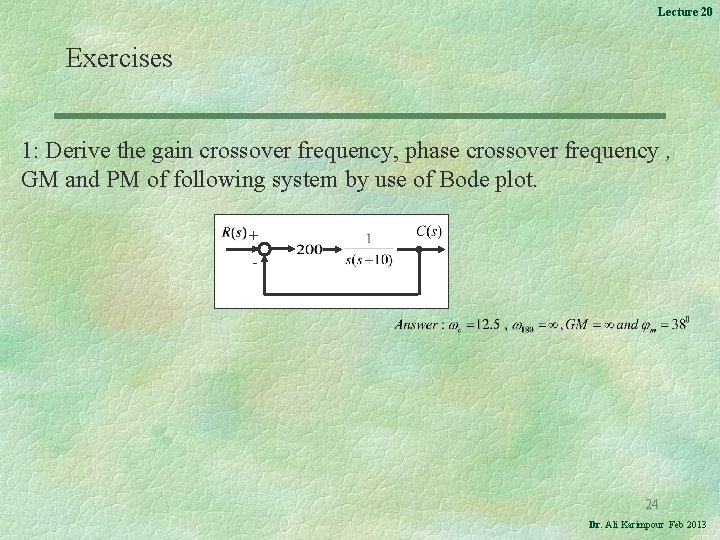
Lecture 20 Exercises 1: Derive the gain crossover frequency, phase crossover frequency , GM and PM of following system by use of Bode plot. + - 24 Dr. Ali Karimpour Feb 2013
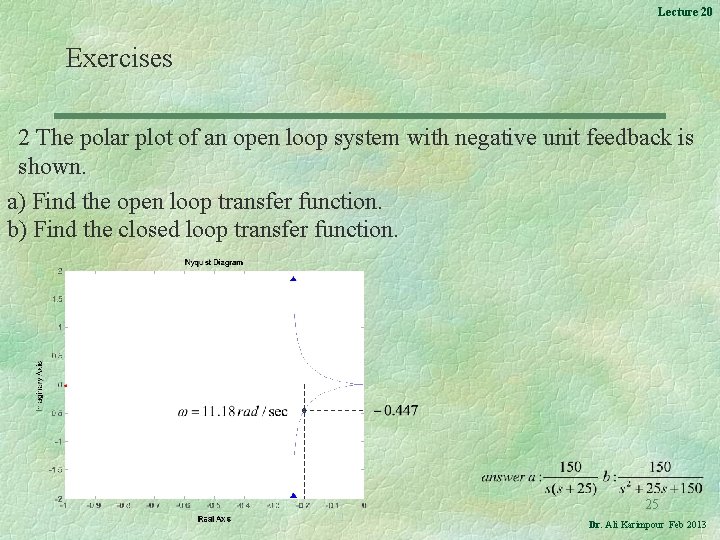
Lecture 20 Exercises 2 The polar plot of an open loop system with negative unit feedback is shown. a) Find the open loop transfer function. b) Find the closed loop transfer function. 25 Dr. Ali Karimpour Feb 2013
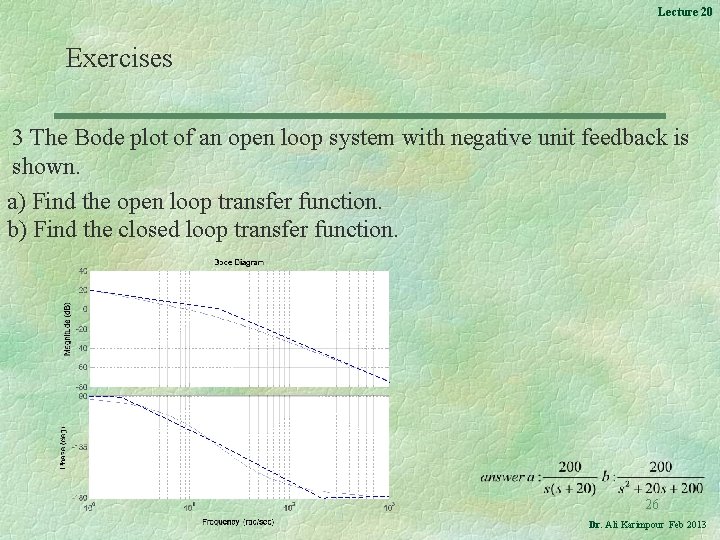
Lecture 20 Exercises 3 The Bode plot of an open loop system with negative unit feedback is shown. a) Find the open loop transfer function. b) Find the closed loop transfer function. 26 Dr. Ali Karimpour Feb 2013