Line Graphs Card Complete Match In this activity


 2013 Estimate 2008 2010 2012 2014 2016 2018")
 2015 Estimate 2008 2010 2012 2014 2016 2018")
 2009 Estimate 2008 2010 2012 2014 2016 2018")
 2013 Estimate 2008 2010 2012 2014 2016 2018")
 2015 Estimate 2008 2010 2012 2014 2016 2018")
 2017 Estimate 2008 2010 2012 2014 2016 2018")
 2015 Estimate 2008 2010 2012 2014 2016 2018")
 2011 Estimate 2008 2010 2012 2014 2016 2018")

- Slides: 18
Line Graphs – Card Complete & Match In this activity students work individually or in groups to match questions and answers. ‘Quick Cut’ – Choose the questions/slides you wish to use and delete others. Sets of questions can then be easily guillotined to save time.
Printing To print handouts from slides Select the slide from the left. Then click: File > Print > ‘Print Current Slide’ To print multiple slides Click on a section title to highlight all those slides, or press ‘Ctrl’ at the same time as selecting slides to highlight more than one. Then click: File > Print > ‘Print Selection’ To print double-sided handouts Highlight both slides before using ‘Print Selection’. Choose ‘Print on Both Sides’ and ‘Flip on Short Edge’.
Half Answers
Answers
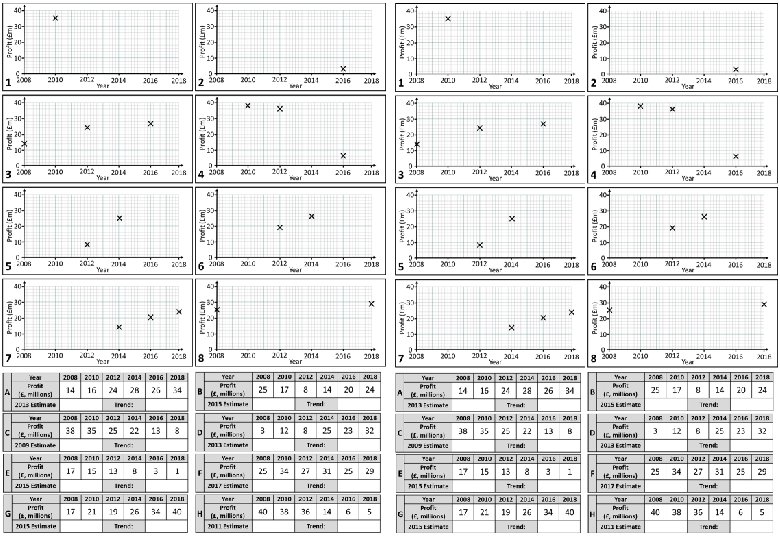
Data Graph Estimate Trend A 3 £ 26 million increasing E 2 £ 6 million declining B 7 £ 17 million steady F 8 £ 28 million steady C 1 £ 36 million declining G 6 £ 30 million increasing D 5 £ 16 million increasing H 4 £ 37 million declining Answers
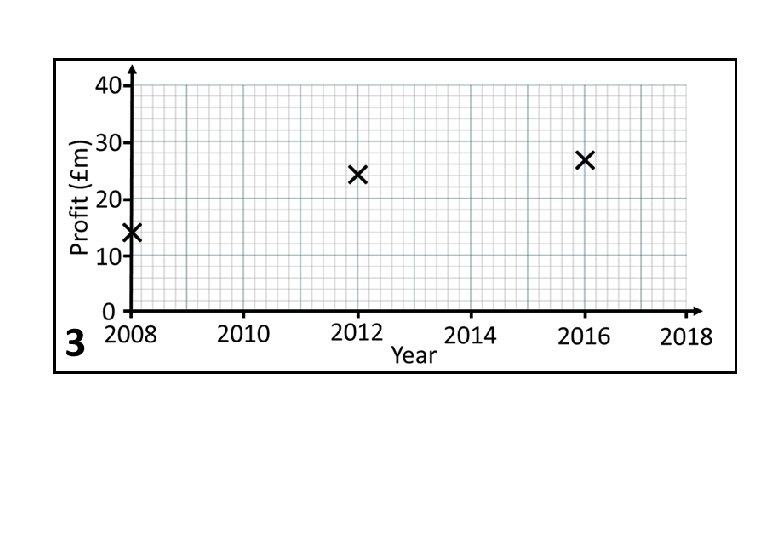
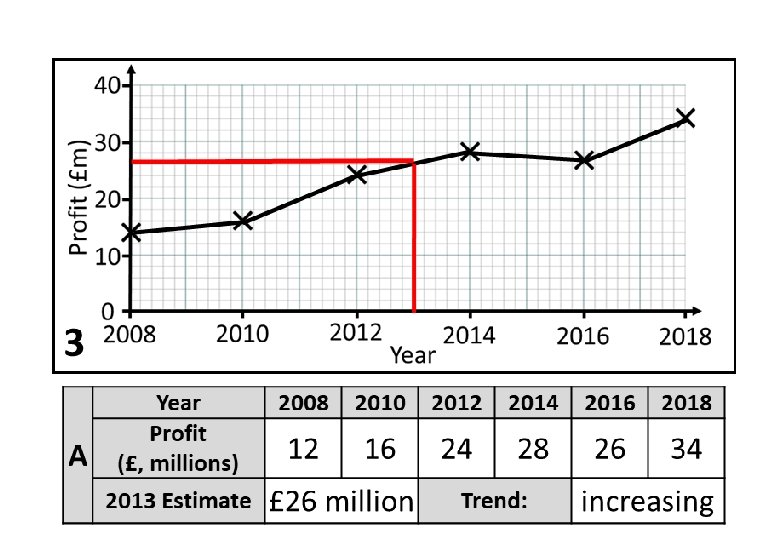
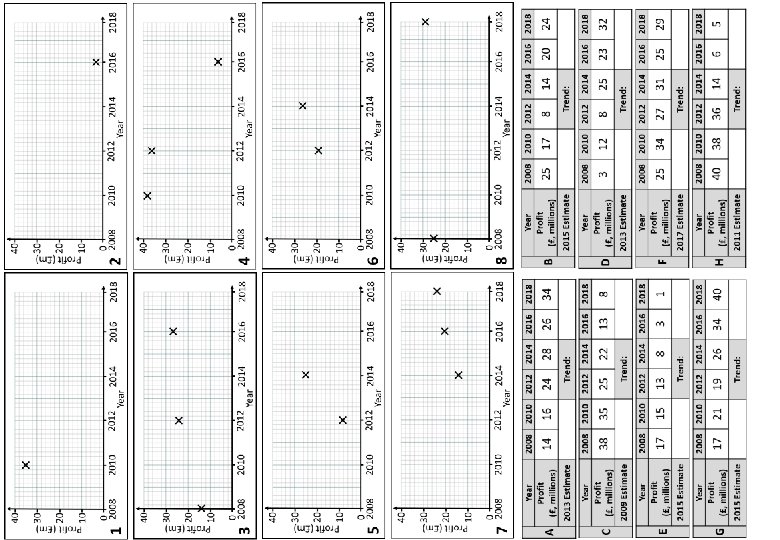
3 A Year Profit (£, millions) 2013 Estimate 2008 2010 2012 2014 2016 2018 14 16 24 28 26 34 Trend:
7 B Year Profit (£, millions) 2015 Estimate 2008 2010 2012 2014 2016 2018 25 17 8 14 20 24 Trend:
1 C Year Profit (£, millions) 2009 Estimate 2008 2010 2012 2014 2016 2018 38 35 25 22 13 8 Trend:
5 D Year Profit (£, millions) 2013 Estimate 2008 2010 2012 2014 2016 2018 3 12 8 25 23 32 Trend:
2 E Year Profit (£, millions) 2015 Estimate 2008 2010 2012 2014 2016 2018 17 15 13 8 3 1 Trend:
8 F Year Profit (£, millions) 2017 Estimate 2008 2010 2012 2014 2016 2018 25 34 27 31 25 29 Trend:
6 G Year Profit (£, millions) 2015 Estimate 2008 2010 2012 2014 2016 2018 17 21 19 26 34 40 Trend:
4 H Year Profit (£, millions) 2011 Estimate 2008 2010 2012 2014 2016 2018 40 38 36 14 6 5 Trend:
Questions? Comments? Suggestions? …or have you found a mistake!? Any feedback would be appreciated . Please feel free to email: tom@goteachmaths. co. uk