Line Graph Lesson 1 Year 5 Click on


- Slides: 23
Line Graph Lesson 1 Year 5
Click on the link to watch the video on remind you how to read a line graph: https: //www. youtube. com/watch? v=x 9 dfsti 25 HY
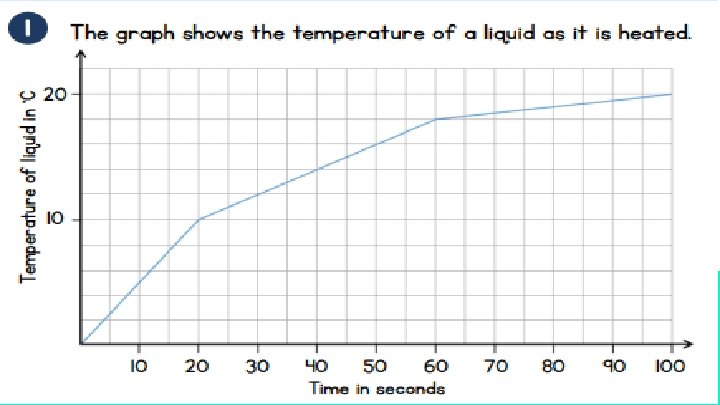
Line Graph Look at the line graph. Using the line graph, answer the questions in the box provided.
1. How long does it take the liquid to reach 10℃? Answer: 2. What is the temperature of the liquid after it is heated for 50 seconds? Answer: 3. How many degrees has the temperature increased by between 40 seconds and 80 seconds? Answer:
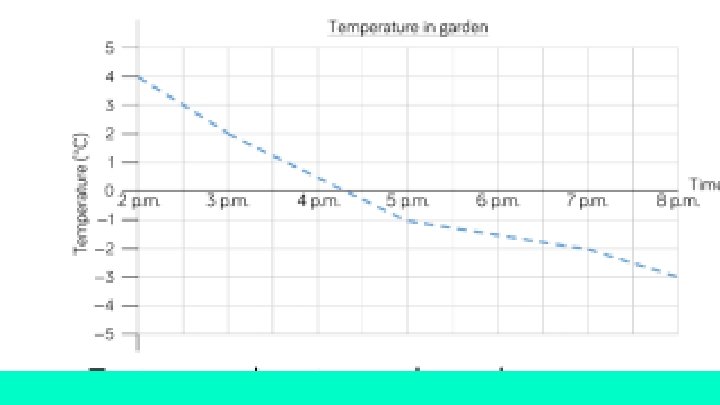
1. What was the temperature at 5 pm? Answer: 2. What was the difference in temperature between 3 pm and 7 pm? Answer: 3. When was the temperature 4℃? Answer:
4. Estimate the time when temperature was O℃? Answer: 5. Estimate the temperature at 6 pm? Answer:
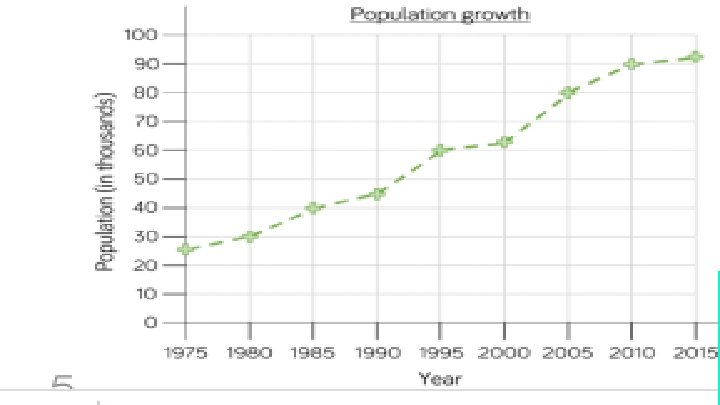
1. What was the population in 1985? Answer: 2. How much did the population grow between 1990 and 2000? Answer: 3. When was the population double that of 1985? Answer:
Graph 1 = Graph 2 = Graph 3 =
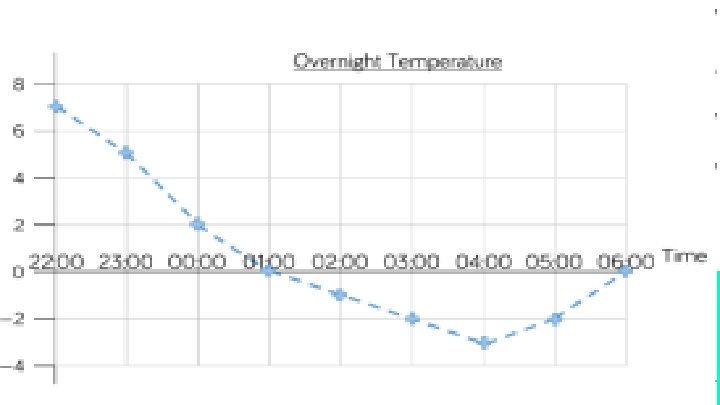
1. What was the highest and lowest temperature? Answer: 2. What is the difference between the highest and lowest temperature? Answer: 3. How long did the temperature stay at freezing? Answer:
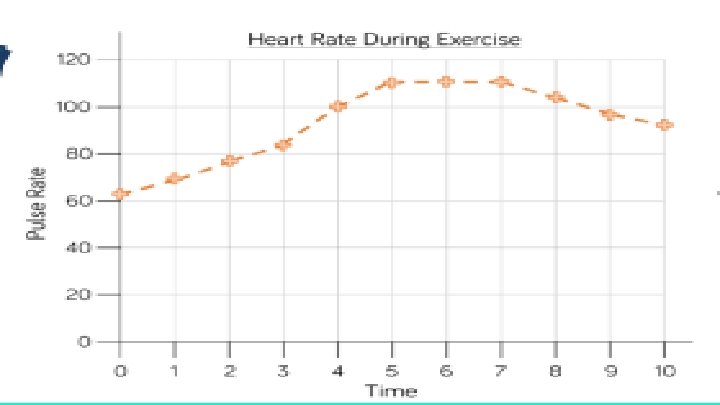
1. How long did it take for the pulse rate to reach the highest level? Explain your answer, using the graph to help you. Answer: 2. What could have happened at 5 minutes? Answer: 3. Estimate what the pulse rate was after two and a half minutes? Answer:
Answer:
Answer:
Answer:
Answer:
Answer:
Answer:
Answer:
Answer: