
Line Graph a graph that uses a line

- Slides: 11
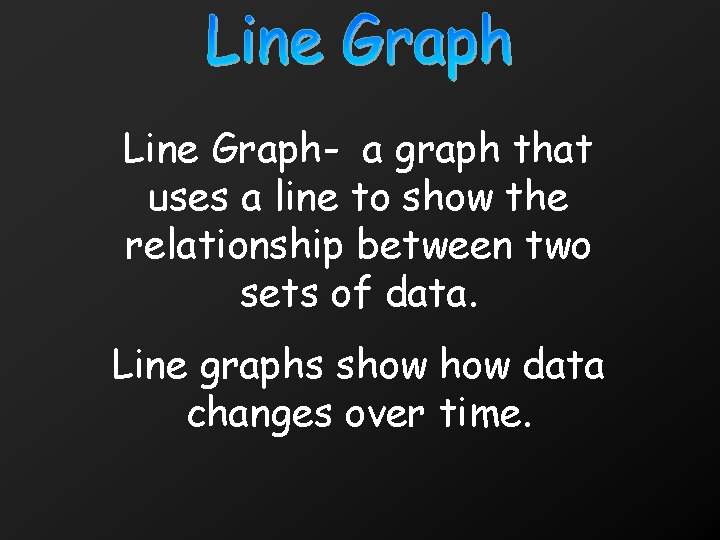
Line Graph- a graph that uses a line to show the relationship between two sets of data. Line graphs show data changes over time.
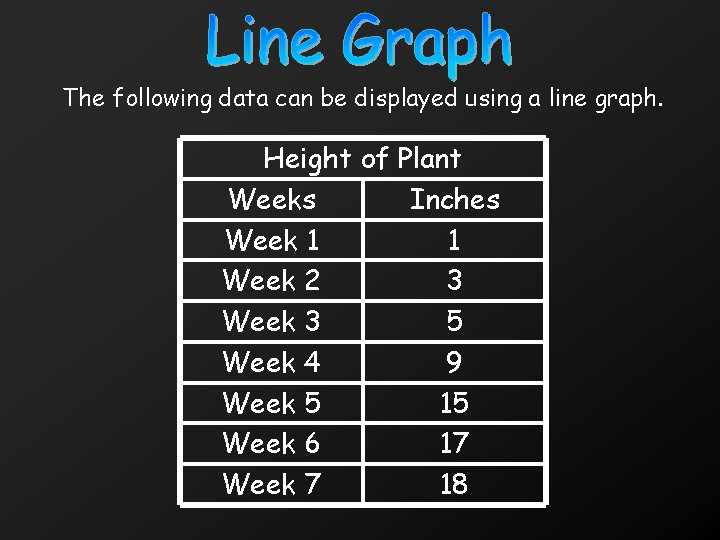
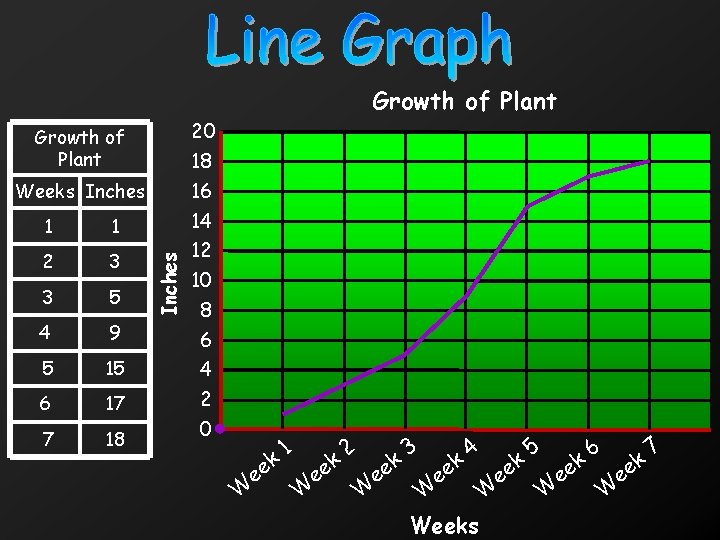
The following data can be displayed using a line graph. Height of Plant Weeks Inches Week 1 1 Week 2 3 Week 3 5 Week 4 9 Week 5 15 Week 6 17 Week 7 18
Growth of Plant 1 1 2 3 3 5 4 9 5 15 6 17 7 18 Inches Weeks Inches 20 18 16 14 12 10 8 6 4 2 0 W e ek 1 W e ek 2 W e ek 3 W e ek 4 Weeks W e ek 5 e W ek 6 e W ek 7
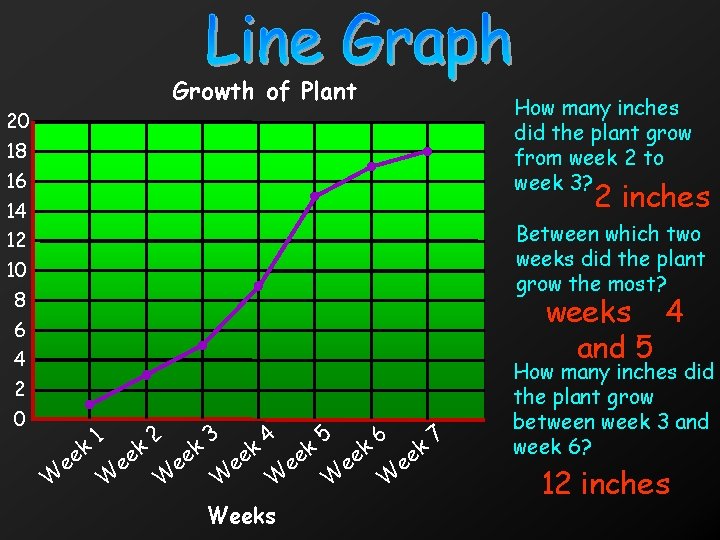
Growth of Plant 20 18 16 14 12 10 8 6 4 2 0 How many inches did the plant grow from week 2 to week 3? 2 inches Between which two weeks did the plant grow the most? weeks 4 and 5 W k e e 1 W k e e 2 W k e e 3 W e ek 4 W e Weeks ek 5 W e ek 6 W e ek 7 How many inches did the plant grow between week 3 and week 6? 12 inches
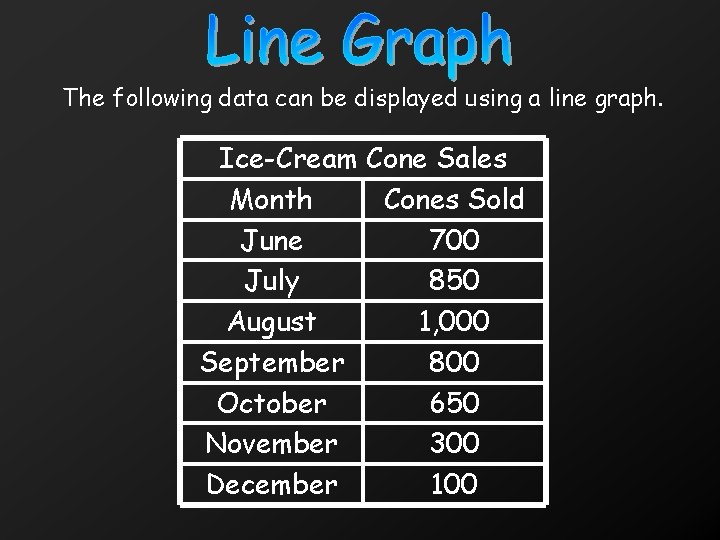
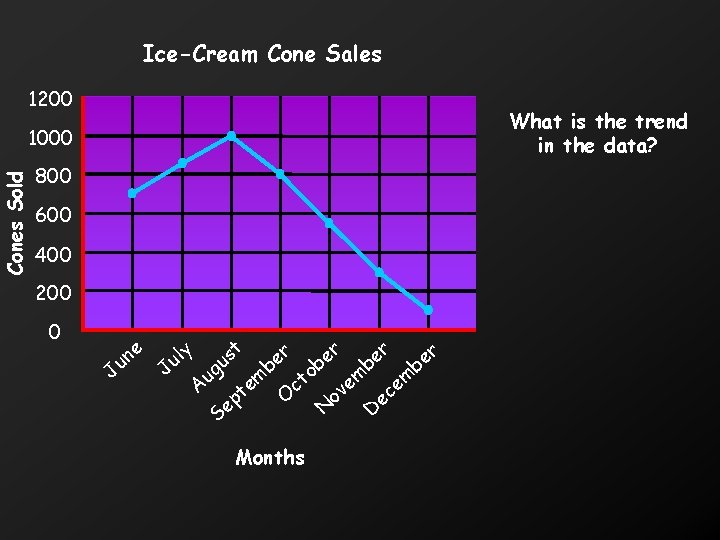
The following data can be displayed using a line graph. Ice-Cream Cone Sales Month Cones Sold June 700 July 850 August 1, 000 September 800 October 650 November 300 December 100
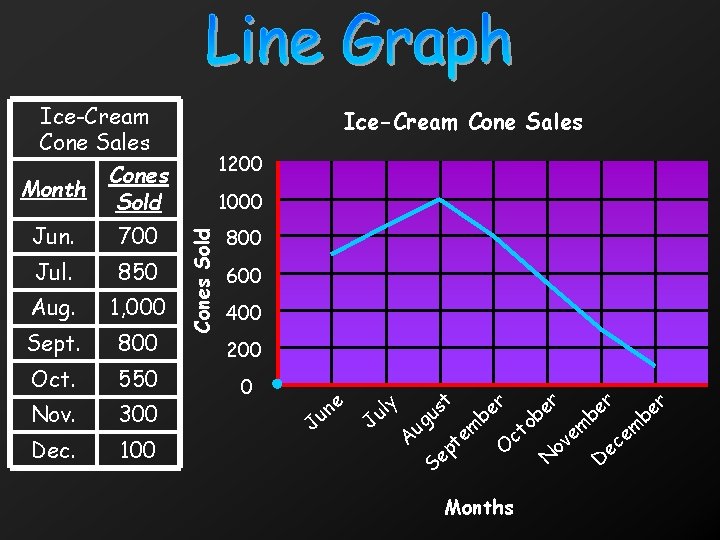
Ice-Cream Cone Sales Month Cones Sold 1200 Jun. 700 800 Jul. 850 Aug. 1, 000 Sept. 800 Oct. 550 Nov. 300 Dec. 100 Cones Sold 1000 600 400 200 0 J e un J y ul r t r r s e er u b b o m m m ug t e e e c A v c O o pt e e N D S Months
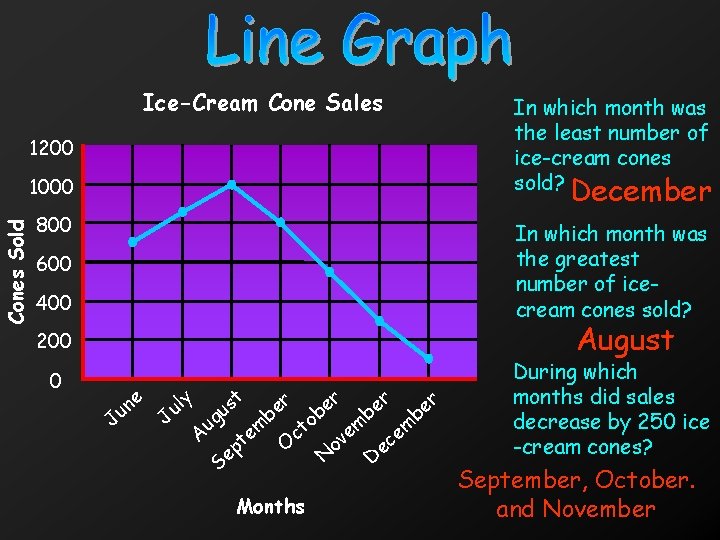
Ice-Cream Cone Sales In which month was the least number of ice-cream cones sold? 1200 December Cones Sold 1000 800 In which month was the greatest number of icecream cones sold? 600 400 August 200 0 J e un J y ul t s u A ug S t p e em r e b o t c O Months r e b N o m e v r e b D e ec m r e b During which months did sales decrease by 250 ice -cream cones? September, October. and November
Line Graph- a graph that uses a line to show the relationship between two sets of data. Line graphs show data changes over time.
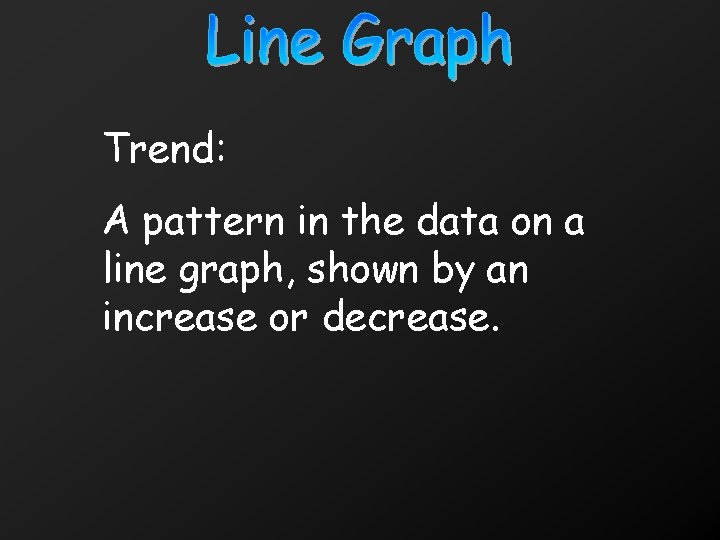
Trend: A pattern in the data on a line graph, shown by an increase or decrease.
Ice-Cream Cone Sales 1200 What is the trend in the data? Cones Sold 1000 800 600 400 200 0 J e n u y l u J ug t s u r e b o m em m t e e c A v t c O o p e N D Se r e b Months