Limits of Postural Stability in Myotonic Dystrophy Compared

Limits of Postural Stability in Myotonic Dystrophy Compared to Normative Values Mary Pautler, MPH University of Utah, Salt Lake City UT
 -Prevalence estimated at 1/8, 000 -Dominantly inherited, multisystem")
Myotonic Dystrophy Type 1 (DM 1) -Prevalence estimated at 1/8, 000 -Dominantly inherited, multisystem disorder Characterization: -Progressive muscle weakness -Myotonia -Early onset cataracts -Increased risk for falls -Limitations with mobility and gait impact quality of life
 scores for")
Study Design Aim 1: Compare Limits of Stability via maximum excursion (MXE) scores for DM 1 versus normative values. Aim 2: Compare MXE scores at baseline and 3 -months. Study Visits Baseline and 3 -months Inclusion Criteria • Age 18 -60 • Genetically confirmed DM 1 • Onset of symptoms after age 12 Exclusion Criteria • Mexiletine, Coumadin or other anticoagulants • Other neuromuscular disorder • Significant trauma within one month

Limits of Stability Voluntary maximum displacement of center of gravity while maintaining a fixed base of support. Maximum Excursion (MXE): Measure of maximum movement potential Illustrates limits of stability Reduced MXE values indicate: Reduced limits of stability Decreased stability during weight shifting Increased fall risk Balance and Posture, Andrew L. Mc. Donough

Computerized Posturography Neuro. Com Balance Manager System Anterior Posterior Neur. Com Clinical Interpretation Guide, Computerized Dynamic Posturography

Limit of Stability Tracing DM 1 participant Anterior Posterior

Participant Demographics Total enrollment N=22 Withdrawal = 1 Data analysis based on N=21 Age, yrs [mean (range)] 40 (28 -57) Gender [N(%)] 9 (43%) Female 12 (57%) Male Symptom Duration, yrs [mean (range)] 19 (2 -31) CTG Repeat Length [mean (range)] 433 (179 -893)
: Comparison of DM 1 to Normative 20 -39")
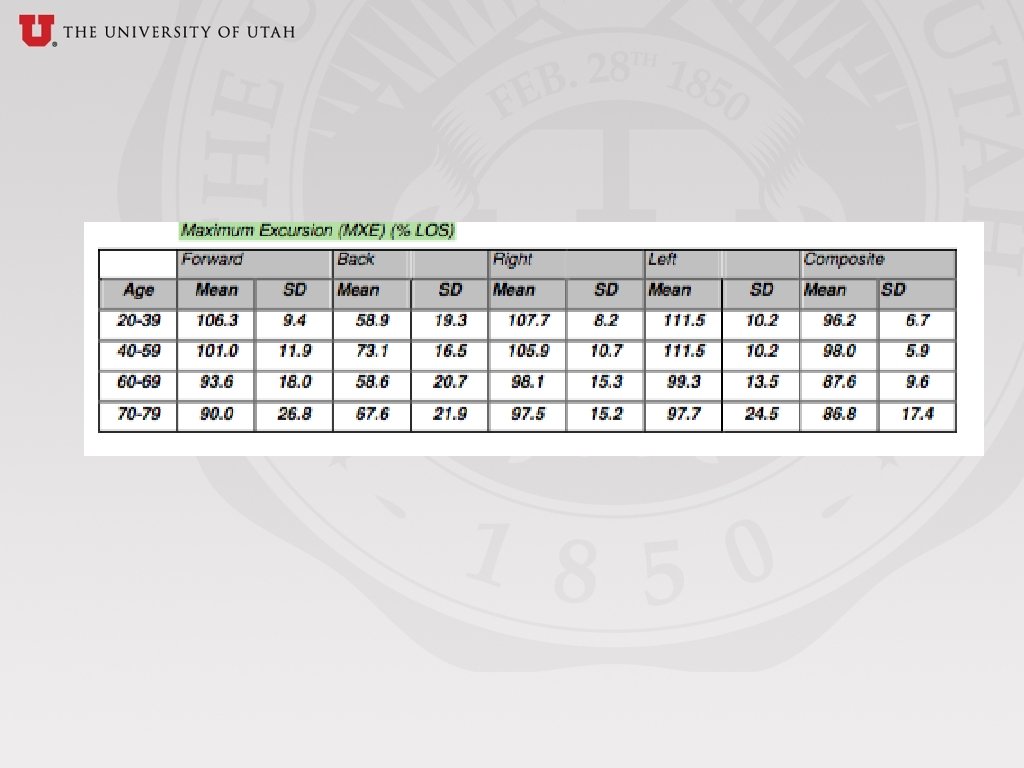
Results: Aim 1 Maximum Excursion (MXE): Comparison of DM 1 to Normative 20 -39 40 -59 Values Age Cohort (yrs) Mean MXE Normal Value (% (SD)) Mean MXE DM 1 (% (SD)) p-value (n=11, gender 6 M/5 F) (n=10, gender 6 M/4 F) 96. 2 (6. 7) 98. 0 (5. 9) 66. 33 (12. 63) 48. 67 (12. 83) p<0. 001
: Comparison of Baseline to 3 -Month Visit Age")
Results: Aim 2 Maximum Excursion (MXE): Comparison of Baseline to 3 -Month Visit Age Cohort (yrs) Mean MXE Baseline Visit (%) Mean MXE 3 -Month Visit (%) p-value 20 -39 66. 33 65. 78 0. 55 40 -59 48. 67 51. 1 0. 73
 MXE vs DF Strength")
Results MXE vs Age (r = -0. 64, p=0. 004) MXE vs DF Strength (r = 0. 65, p=0. 004) MXE vs m. DGI (r = 0. 60, p=0. 008)

Summary • Limits of stability are significantly reduced in DM 1 as compared to normal values. • No change in stability limits over 3 -months. • Age, dorsiflexion strength and dynamic balance correlate with stability limits. • Evaluate additional contributing factors. • Consider limits of stability for measuring disease progression.

CONTRIBUTORS / SUPPORT Heather Hayes, PT, DPT, NCS, Ph. D Man Hung, Ph. D Jerry Bounsanga Yushan Gu Deanna Di. Bella, PT, MPT Evan Pucillo, PT, DPT Caren Trujillo, RN, MSN Missy Dixon, Ph. D, MS Russell Butterfield, MD, Ph. D Nicholas Johnson, MD
. Postural orientation and equilibrium: what do we need to know")
Horak, F. B. (2006). Postural orientation and equilibrium: what do we need to know about neural control of balance to prevent falls? Ageing, 35 Suppl 2, ii 7 -ii 11
- Slides: 14