
Limits of Intuition Sometimes our intuitions lead us
- Slides: 74
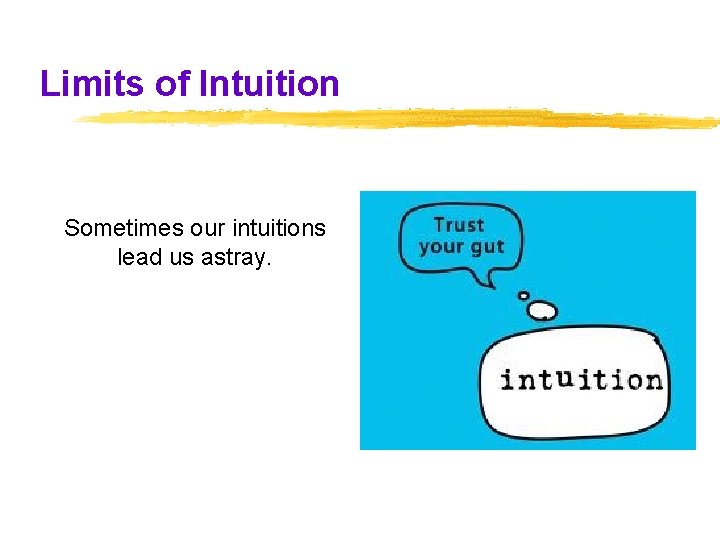
Limits of Intuition Sometimes our intuitions lead us astray.
Hindsight Bias is the “I-knew-it-all-along” phenomenon. After learning the outcome of an event, many people believe they could have predicted that very outcome.
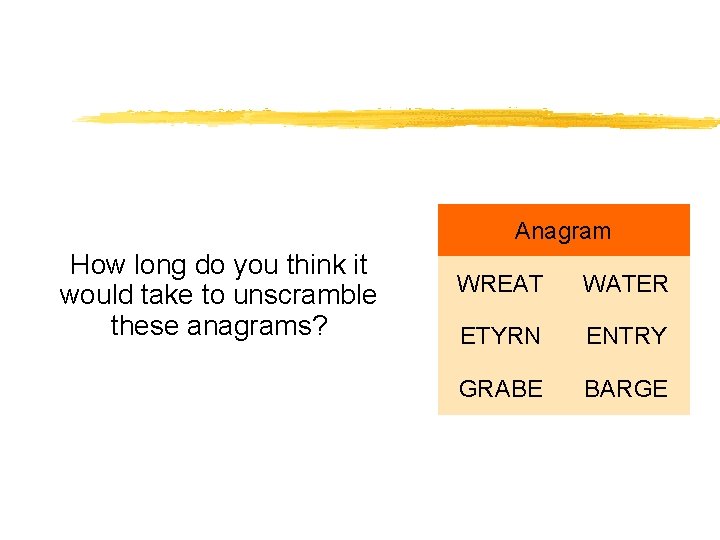
Anagram How long do you think it would take to unscramble these anagrams? WREAT WATER ETYRN ENTRY GRABE BARGE
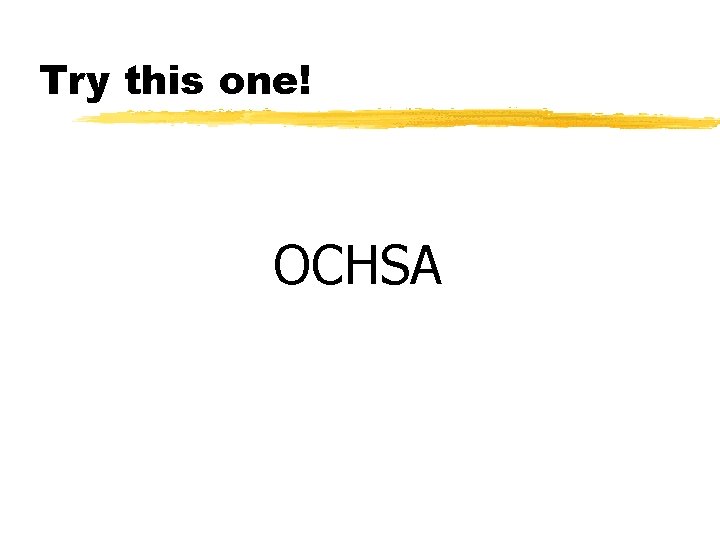
Try this one! OCHSA
Overconfidence z. People said it would take about 10 seconds, yet on average they took about 3 minutes (Goranson, 1978).
Psychological Science 1. How can we differentiate between uniformed opinions and examined conclusions? 2. The science of psychology helps make these examined conclusions, which leads to our understanding of how people feel, think, and act as they do!
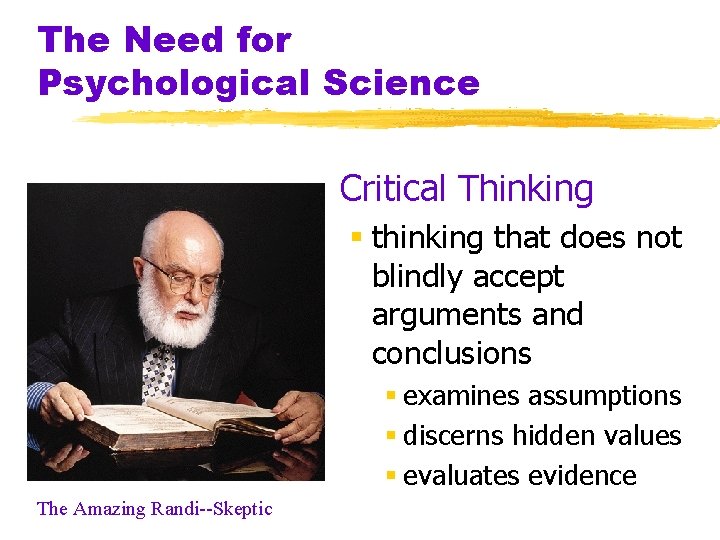
The Need for Psychological Science § Critical Thinking § thinking that does not blindly accept arguments and conclusions § examines assumptions § discerns hidden values § evaluates evidence The Amazing Randi--Skeptic
Goals of Psychology Describe n Explain n Predict n Control n behavior and mental processes
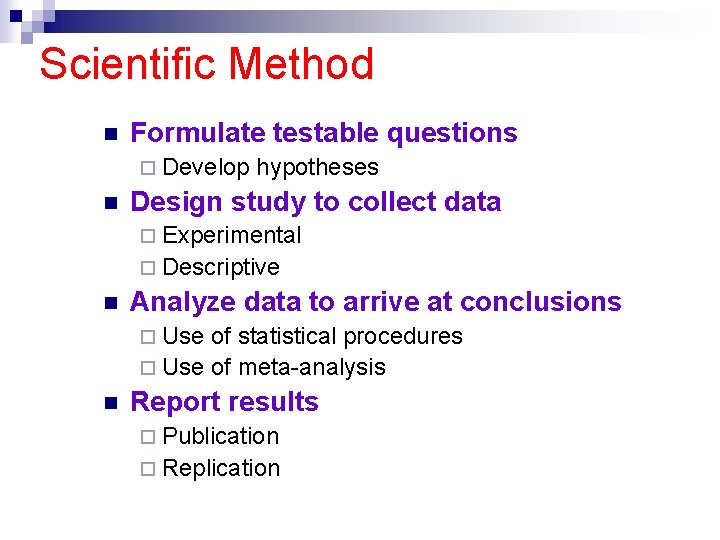
Scientific Method n Formulate testable questions ¨ Develop n hypotheses Design study to collect data ¨ Experimental ¨ Descriptive n Analyze data to arrive at conclusions ¨ Use of statistical procedures ¨ Use of meta-analysis n Report results ¨ Publication ¨ Replication
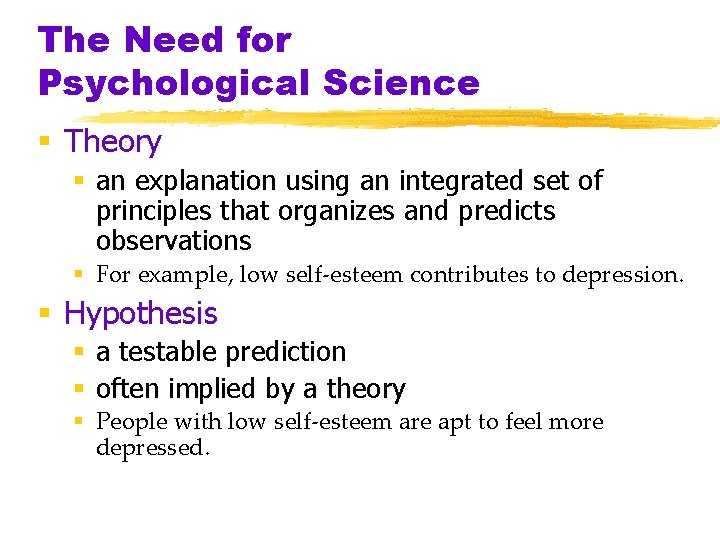
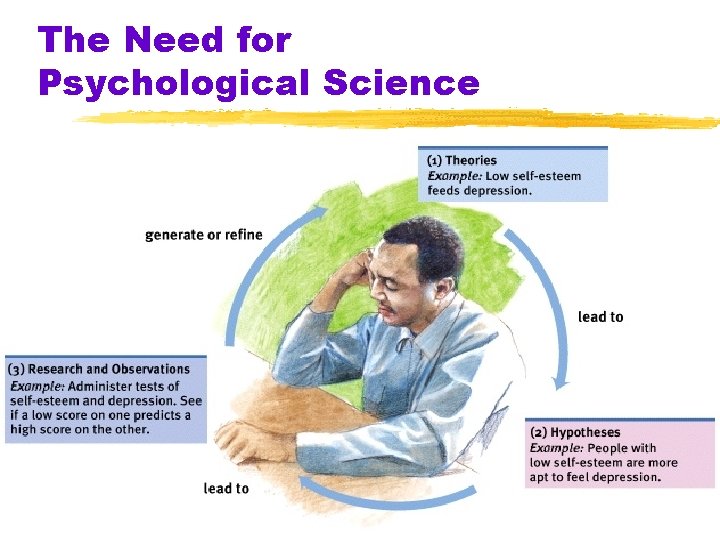
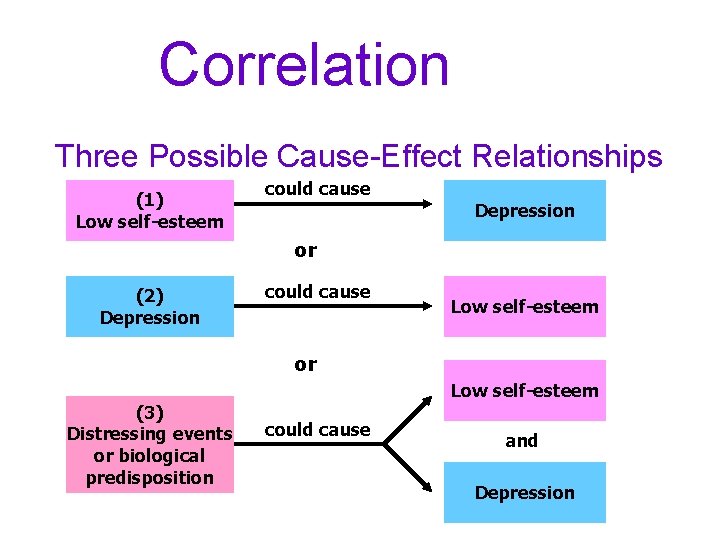
The Need for Psychological Science § Theory § an explanation using an integrated set of principles that organizes and predicts observations § For example, low self-esteem contributes to depression. § Hypothesis § a testable prediction § often implied by a theory § People with low self-esteem are apt to feel more depressed.
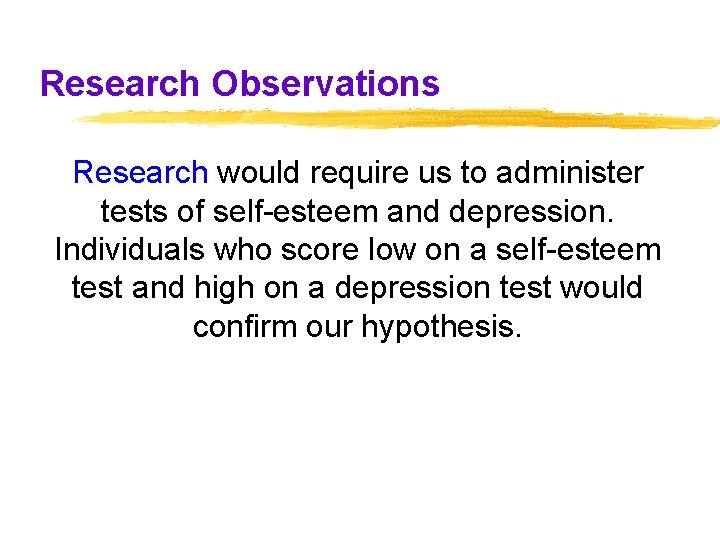
Research Observations Research would require us to administer tests of self-esteem and depression. Individuals who score low on a self-esteem test and high on a depression test would confirm our hypothesis.
The Need for Psychological Science
The Need for Psychological Science § Operational Definition § a statement of procedures (operations) used to define research variables § Example§ intelligence may be operationally defined as what an intelligence test measures § Testing the effects of vitamin C on the health of students could be measured by the number of colds experienced during the month.
The Need for Psychological Science § Replication § repeating the essence of a research study to see whether the basic finding generalizes to other participants and circumstances § usually with different participants in different situations
Description Psychologists describe behavior using case studies, surveys, and naturalistic observation
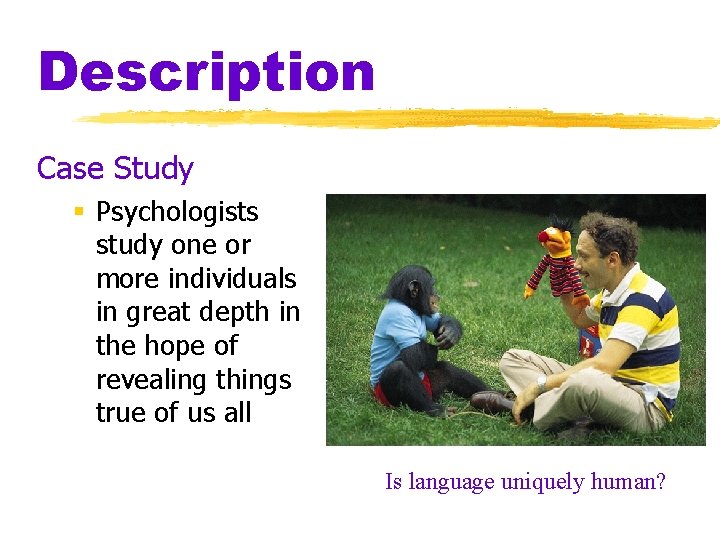
Description Case Study § Psychologists study one or more individuals in great depth in the hope of revealing things true of us all Is language uniquely human?
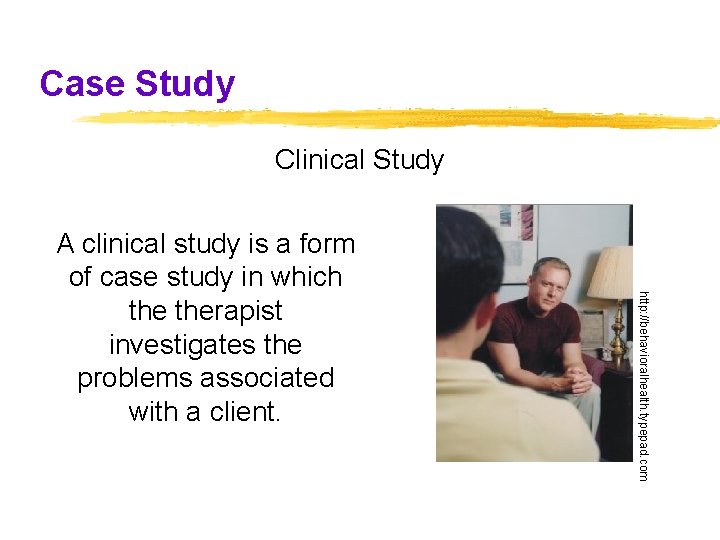
Case Study Clinical Study http: //behavioralhealth. typepad. com A clinical study is a form of case study in which therapist investigates the problems associated with a client.
The Case Study Method Defined as a thorough, exhaustive study of a person. It includes personal, educational, family and work histories. Advantage: A wealth of background information about one person Disadvantages: Information cannot be generalized to others; also, researcher’s biases can influence subject’s behavior.
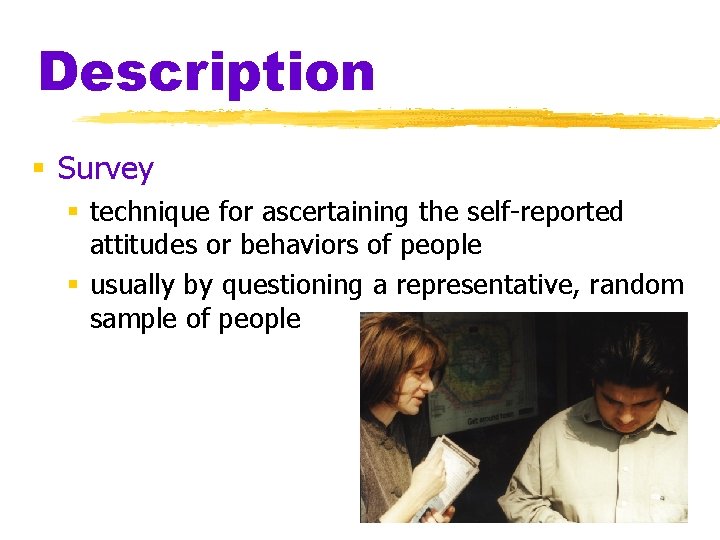
Description § Survey § technique for ascertaining the self-reported attitudes or behaviors of people § usually by questioning a representative, random sample of people
Survey Wording Effect Wording can change the results of a survey. § Even subtle changes in the order or wording of questions can have major effects. Q: Should cigarette ads be allowed on television? (not allowed vs. forbid)
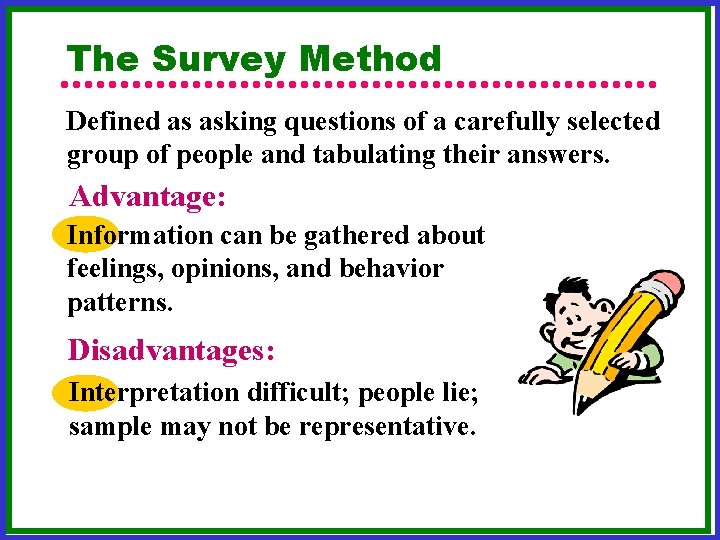
The Survey Method Defined as asking questions of a carefully selected group of people and tabulating their answers. Advantage: Information can be gathered about feelings, opinions, and behavior patterns. Disadvantages: Interpretation difficult; people lie; sample may not be representative.
Description § False Consensus Effect § tendency to overestimate the extent to which others share our beliefs and behaviors § Population § all the cases in a group, from which samples may be drawn for a study
Samples and Sampling z. Sample selected segment of the population z. Representative sample closely parallels the population on relevant characteristics z. Random selection every member of larger group has equal change of being selected for the study sample
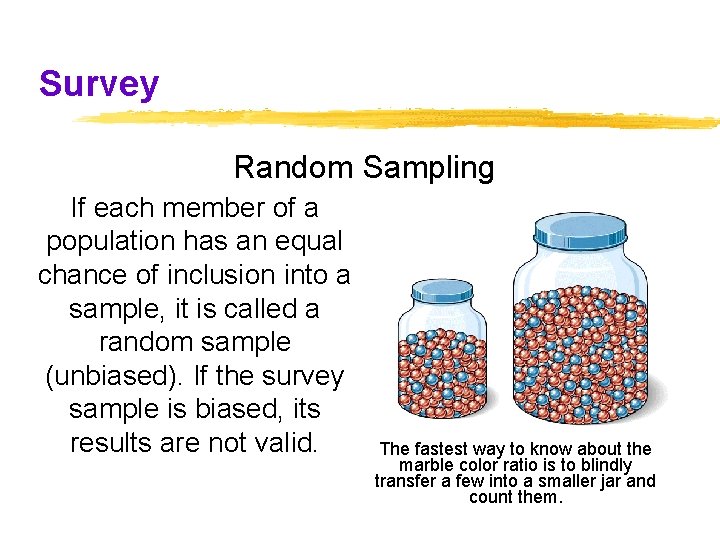
Survey Random Sampling If each member of a population has an equal chance of inclusion into a sample, it is called a random sample (unbiased). If the survey sample is biased, its results are not valid. The fastest way to know about the marble color ratio is to blindly transfer a few into a smaller jar and count them.
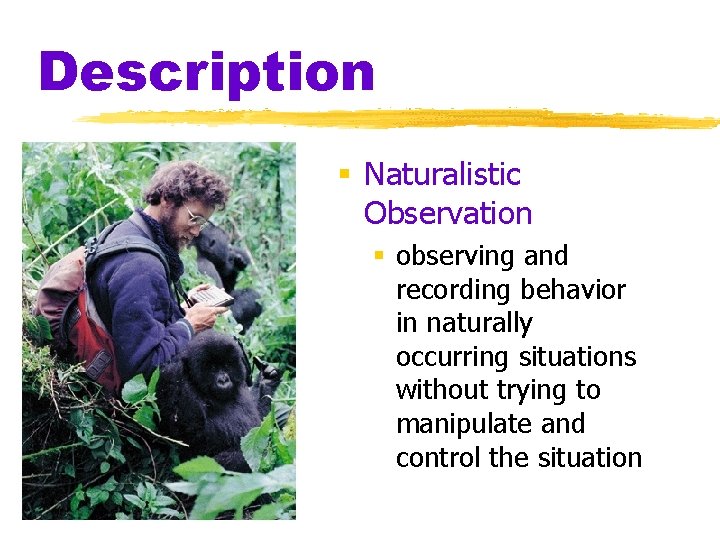
Description § Naturalistic Observation § observing and recording behavior in naturally occurring situations without trying to manipulate and control the situation
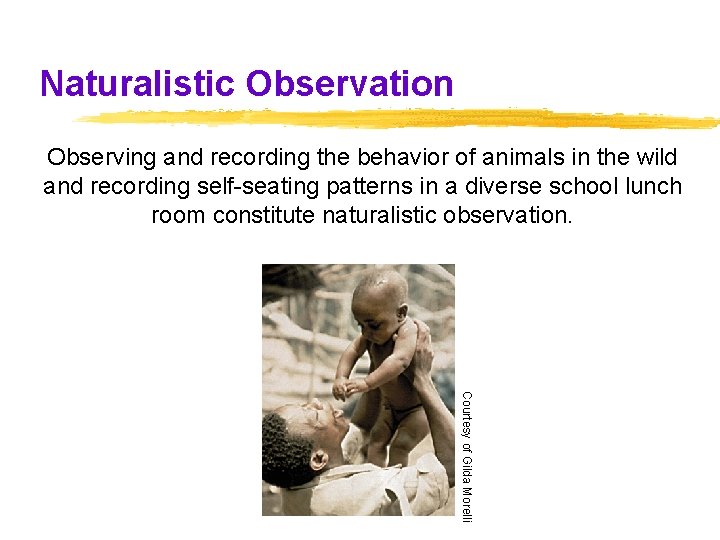
Naturalistic Observation Observing and recording the behavior of animals in the wild and recording self-seating patterns in a diverse school lunch room constitute naturalistic observation. Courtesy of Gilda Morelli
The Naturalistic Observation Method Defined as observing behaviors in their natural settings. Disadvantages: Researcher cannot interact with the subject. Researcher may interpret subject’s responses incorrectly.
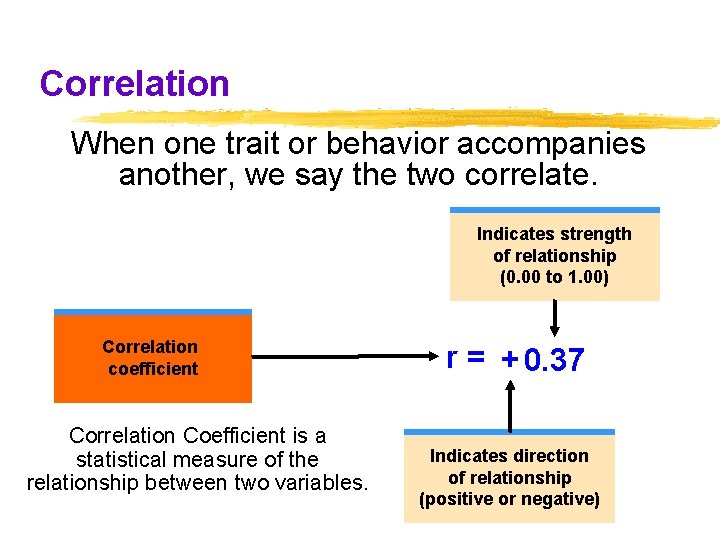
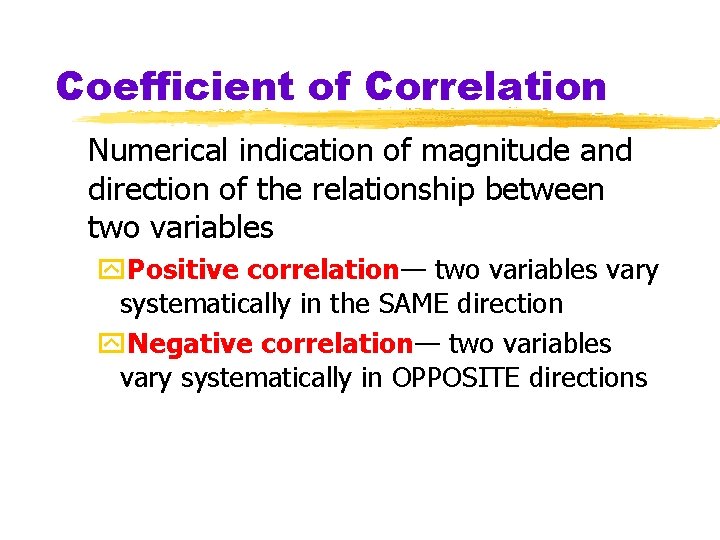
Correlation When one trait or behavior accompanies another, we say the two correlate. Indicates strength of relationship (0. 00 to 1. 00) Correlation coefficient Correlation Coefficient is a statistical measure of the relationship between two variables. r = + 0. 37 Indicates direction of relationship (positive or negative)
Coefficient of Correlation Numerical indication of magnitude and direction of the relationship between two variables y. Positive correlation— two variables vary systematically in the SAME direction y. Negative correlation— two variables vary systematically in OPPOSITE directions
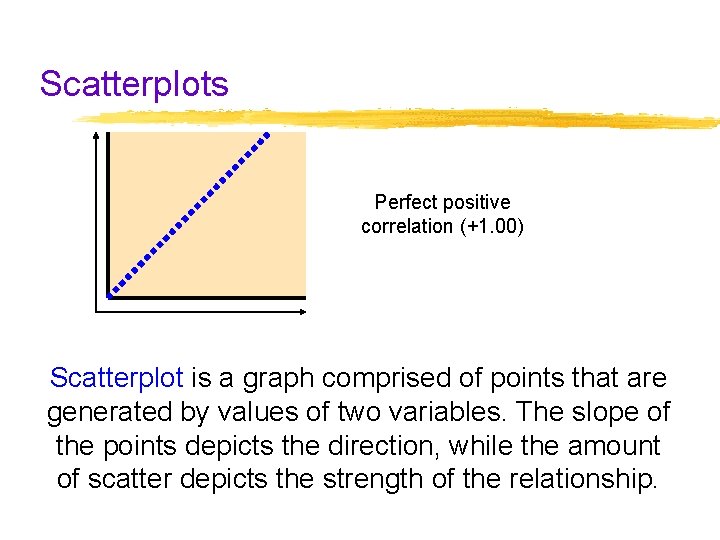
Scatterplots Perfect positive correlation (+1. 00) Scatterplot is a graph comprised of points that are generated by values of two variables. The slope of the points depicts the direction, while the amount of scatter depicts the strength of the relationship.
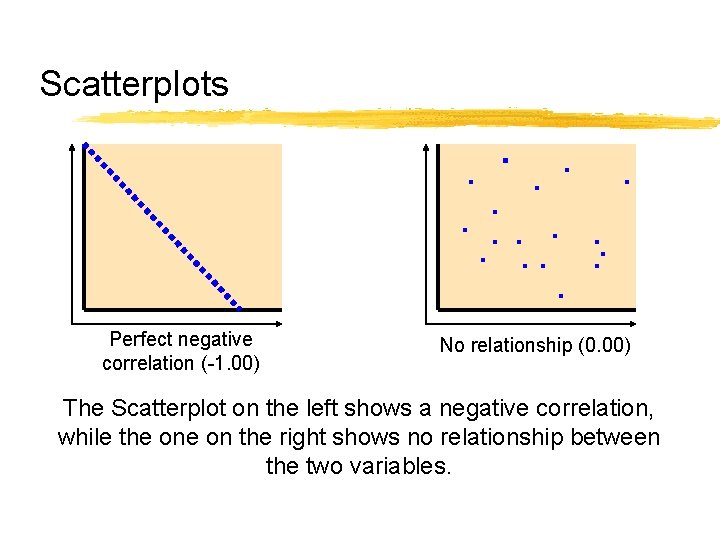
Scatterplots Perfect negative correlation (-1. 00) No relationship (0. 00) The Scatterplot on the left shows a negative correlation, while the on the right shows no relationship between the two variables.
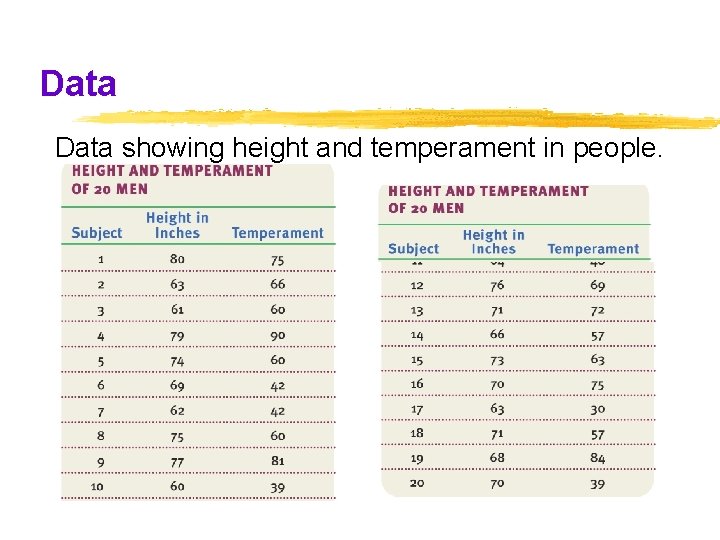
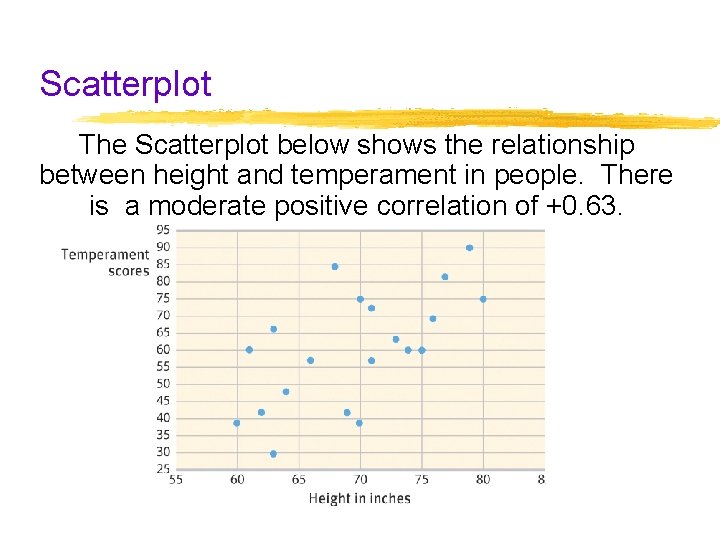
Data showing height and temperament in people.
Scatterplot The Scatterplot below shows the relationship between height and temperament in people. There is a moderate positive correlation of +0. 63.
Correlation Three Possible Cause-Effect Relationships (1) Low self-esteem could cause Depression or (2) Depression could cause Low self-esteem or (3) Distressing events or biological predisposition Low self-esteem could cause and Depression
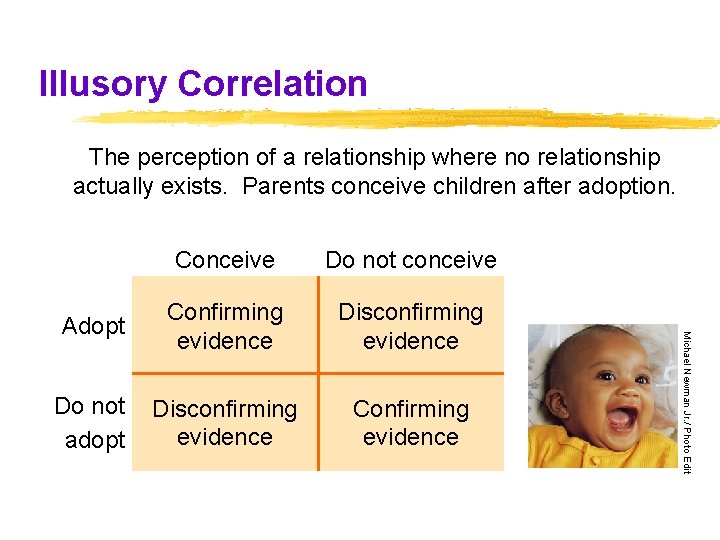
Illusory Correlation The perception of a relationship where no relationship actually exists. Parents conceive children after adoption. Do not conceive Adopt Confirming evidence Disconfirming evidence Do not adopt Disconfirming evidence Confirming evidence Michael Newman Jr. / Photo Edit Conceive
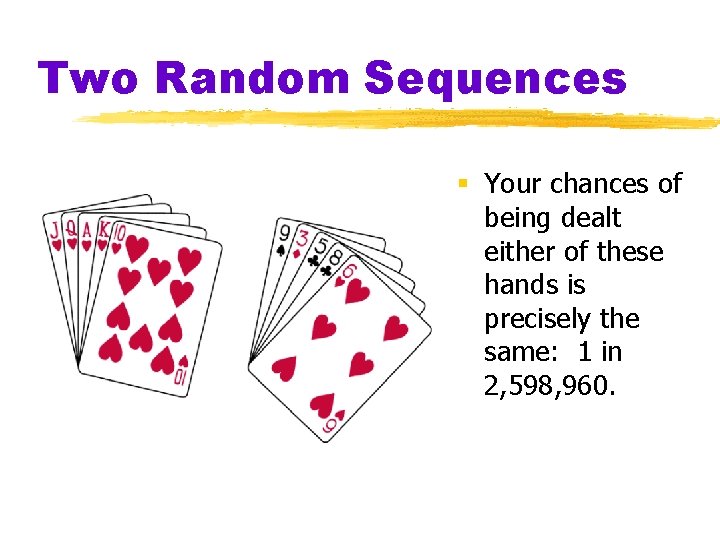
Two Random Sequences § Your chances of being dealt either of these hands is precisely the same: 1 in 2, 598, 960.
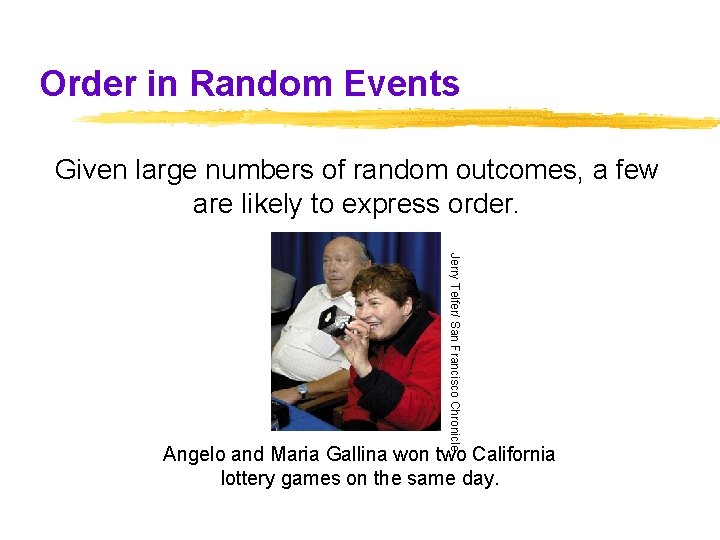
Order in Random Events Given large numbers of random outcomes, a few are likely to express order. Jerry Telfer/ San Francisco Chronicle Angelo and Maria Gallina won two California lottery games on the same day.
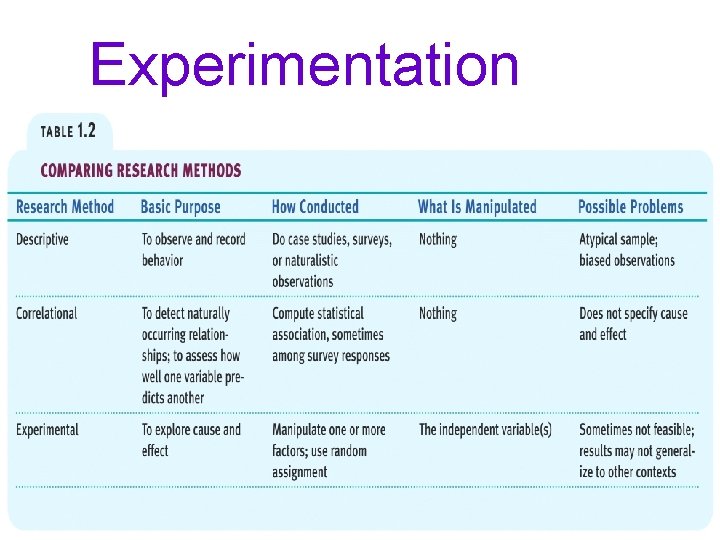
Experimentation Exploring Cause and Effect Like other sciences, experimentation is the backbone of psychology research. Experiments isolate causes and their effects.
Exploring Cause & Effect Many factors influence our behavior. Experiments (1) manipulate factors that interest us, while other factors are kept under (2) control. Effects generated by manipulated factors isolate cause and effect relationships.
Experimentation § Experiment § an investigator manipulates one or more factors (independent variables) to observe their effect on some behavior or mental process (the dependent variable) § by random assignment of participants the experiment controls other relevant factors
Experimentation § Placebo § an inert substance or condition that may be administered instead of a presumed active agent, such as a drug, to see if it triggers the effects believed to characterize the active agent § Double-blind Procedure § both the research participants and the research staff are ignorant (blind) about whether the research participants have received the treatment or a placebo § commonly used in drug-evaluation studies
Experimentation § Experimental Condition § the condition of an experiment that exposes participants to the treatment, that is, to one version of the independent variable § Control Condition § the condition of an experiment that contrasts with the experimental treatment § serves as a comparison for evaluating the effect of the treatment
Experimental Design z. Random sample— every member of the population being studied should have an equal chance of being selected for the study z. Random assignment— assigning subjects to experimental and control conditions by chance. z. Randomization helps avoid false results
Experimentation § Independent Variable § the experimental factor that is manipulated § the variable whose effect is being studied § Dependent Variable § the experimental factor that may change in response to manipulations of the independent variable § in psychology it is usually a behavior or mental process
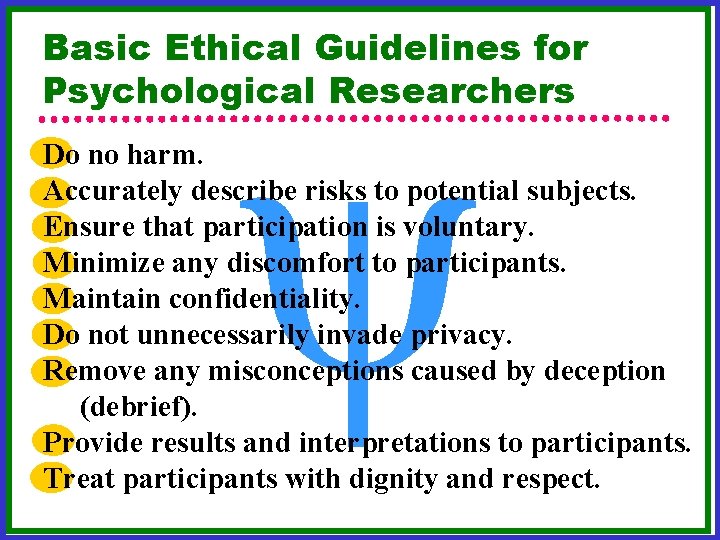
y Basic Ethical Guidelines for Psychological Researchers Do no harm. Accurately describe risks to potential subjects. Ensure that participation is voluntary. Minimize any discomfort to participants. Maintain confidentiality. Do not unnecessarily invade privacy. Remove any misconceptions caused by deception (debrief). Provide results and interpretations to participants. Treat participants with dignity and respect.
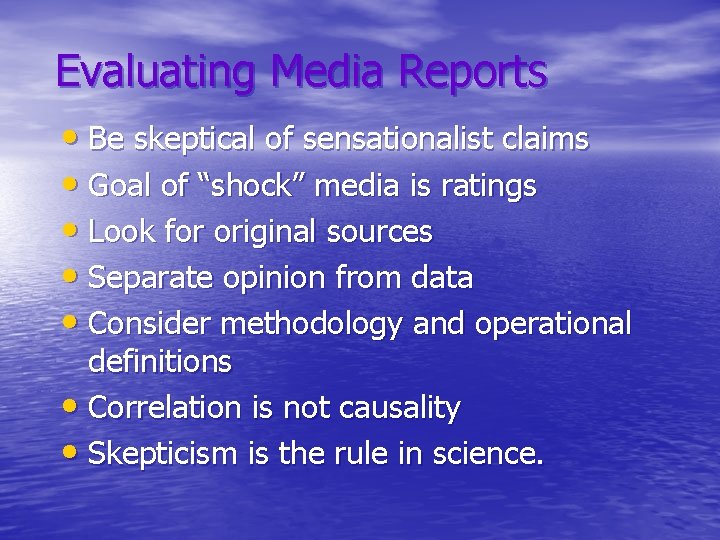
Evaluating Media Reports • Be skeptical of sensationalist claims • Goal of “shock” media is ratings • Look for original sources • Separate opinion from data • Consider methodology and operational definitions • Correlation is not causality • Skepticism is the rule in science.
Experimentation
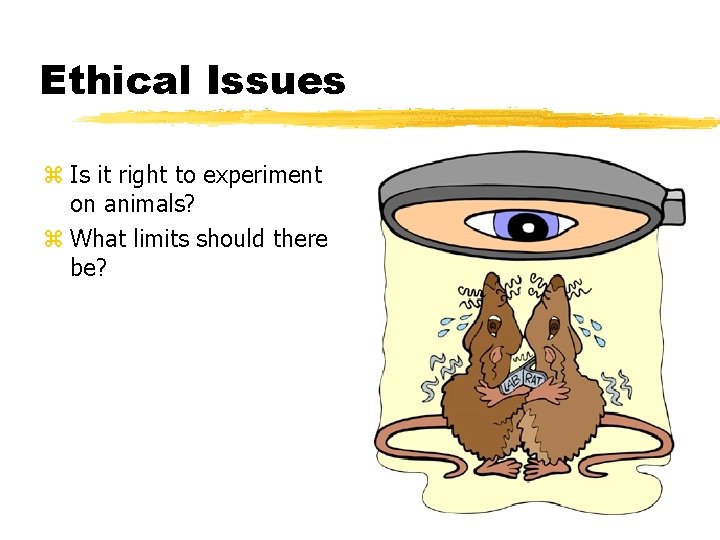
Ethical Issues z Is it right to experiment on animals? z What limits should there be?
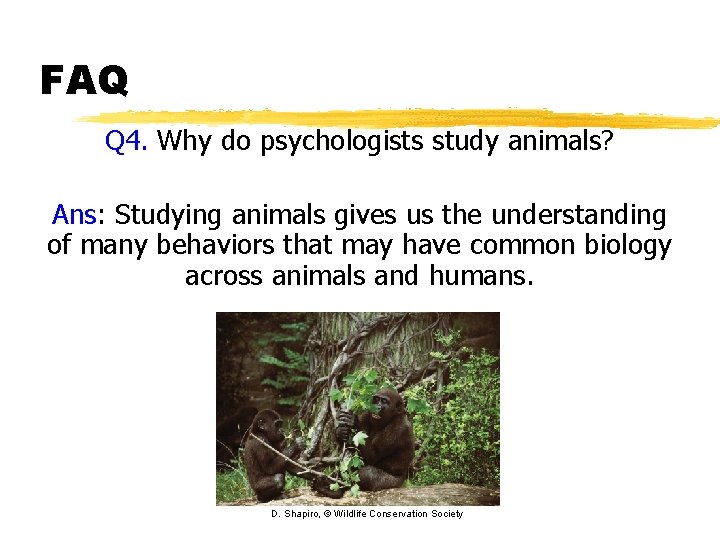
FAQ Q 4. Why do psychologists study animals? Ans: Studying animals gives us the understanding of many behaviors that may have common biology across animals and humans. D. Shapiro, © Wildlife Conservation Society
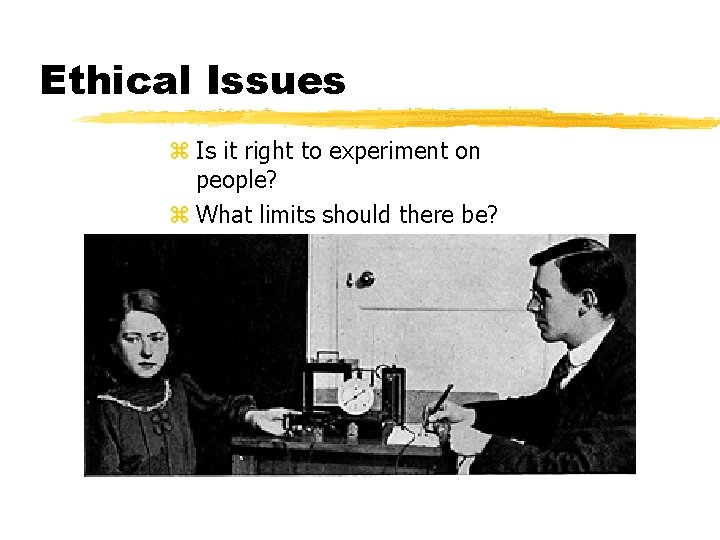
Ethical Issues z Is it right to experiment on people? z What limits should there be?
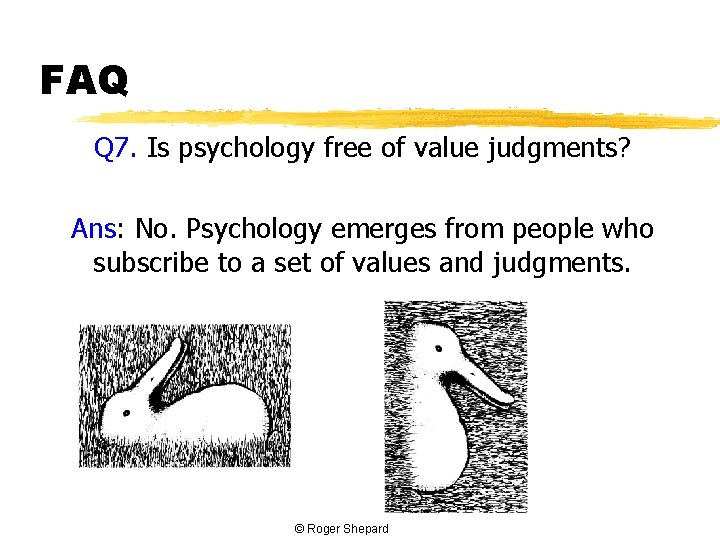
FAQ Q 7. Is psychology free of value judgments? Ans: No. Psychology emerges from people who subscribe to a set of values and judgments. © Roger Shepard
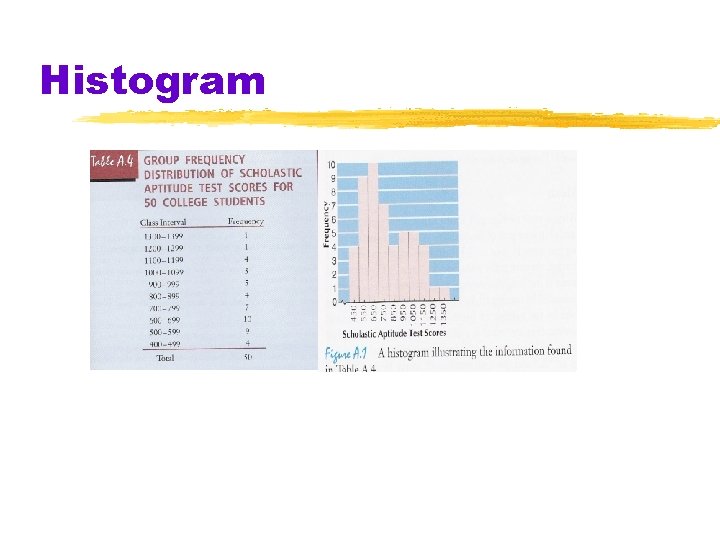
Distributions Percentile Rank--the percentage of scores that fall below a particular score. You can never have a percentile rank of 100 because you are part of that 100. (You can’t exceed yourself!) Bar Graphs (histograms)-- Percentile ranks and distributions can be represented in bar graphs or histograms.
Histogram
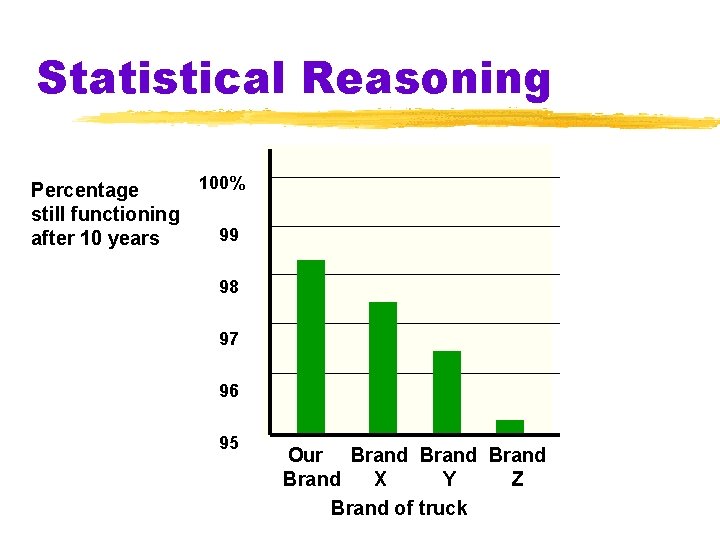
Statistical Reasoning 100% Percentage still functioning 99 after 10 years 98 97 96 95 Our Brand X Y Z Brand of truck
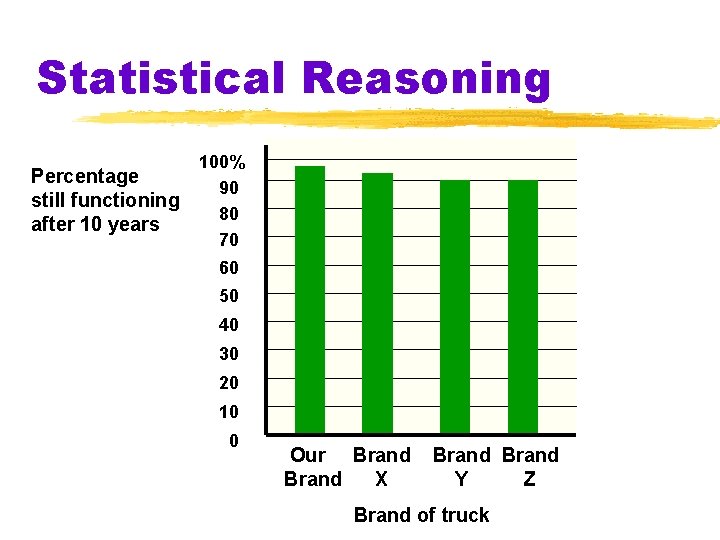
Statistical Reasoning Percentage still functioning after 10 years 100% 90 80 70 60 50 40 30 20 10 0 Our Brand X Brand Y Z Brand of truck
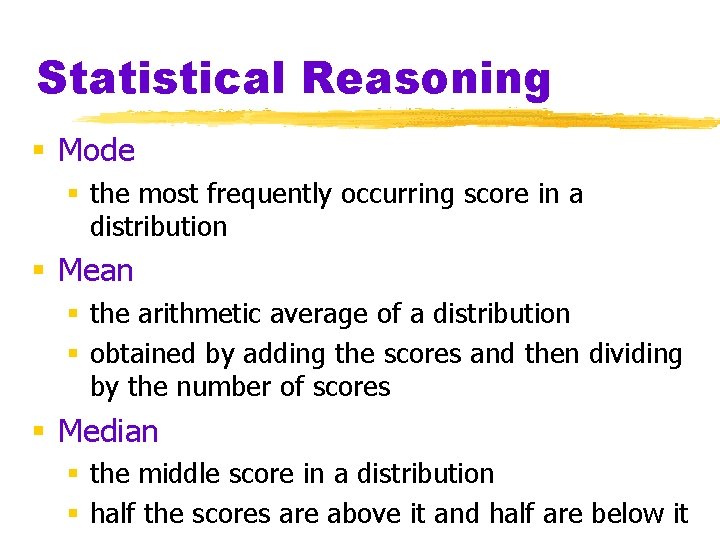
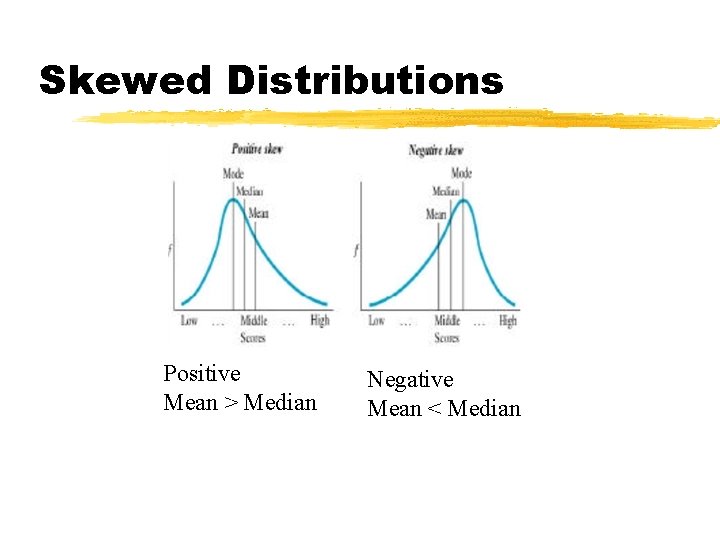
Statistical Reasoning § Mode § the most frequently occurring score in a distribution § Mean § the arithmetic average of a distribution § obtained by adding the scores and then dividing by the number of scores § Median § the middle score in a distribution § half the scores are above it and half are below it
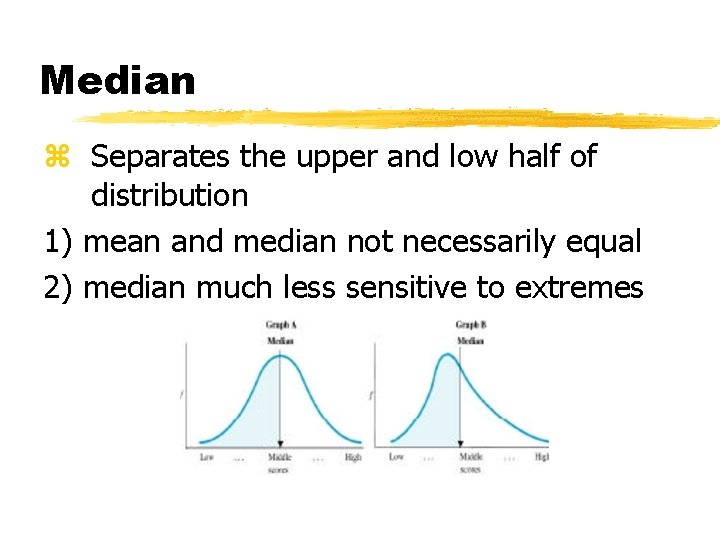
Median z Separates the upper and low half of distribution 1) mean and median not necessarily equal 2) median much less sensitive to extremes
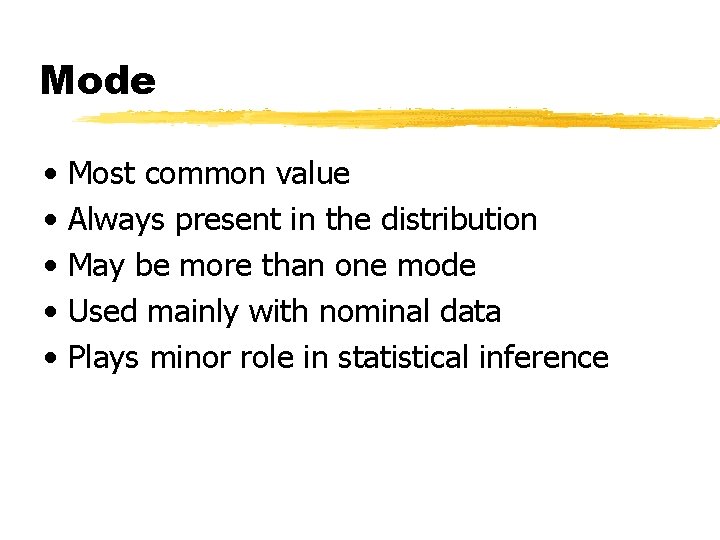
Mode • • • Most common value Always present in the distribution May be more than one mode Used mainly with nominal data Plays minor role in statistical inference
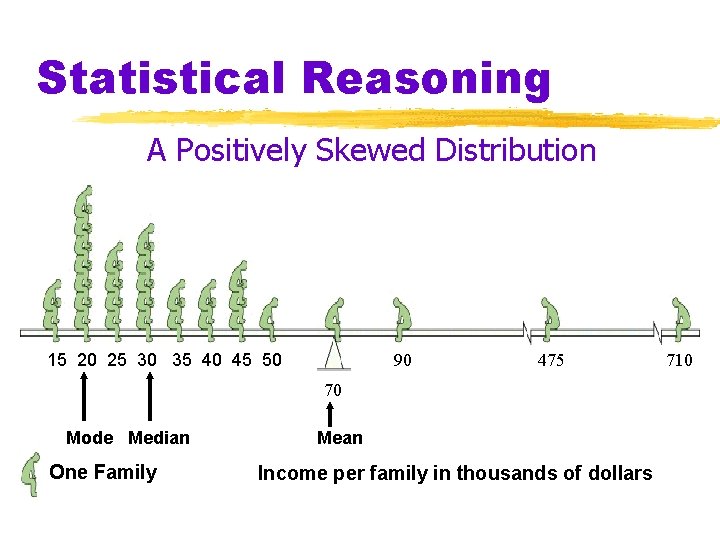
Statistical Reasoning A Positively Skewed Distribution 15 20 25 30 35 40 45 50 90 475 70 Mode Median One Family Mean Income per family in thousands of dollars 710
Skewed Distributions Positive Mean > Median Negative Mean < Median
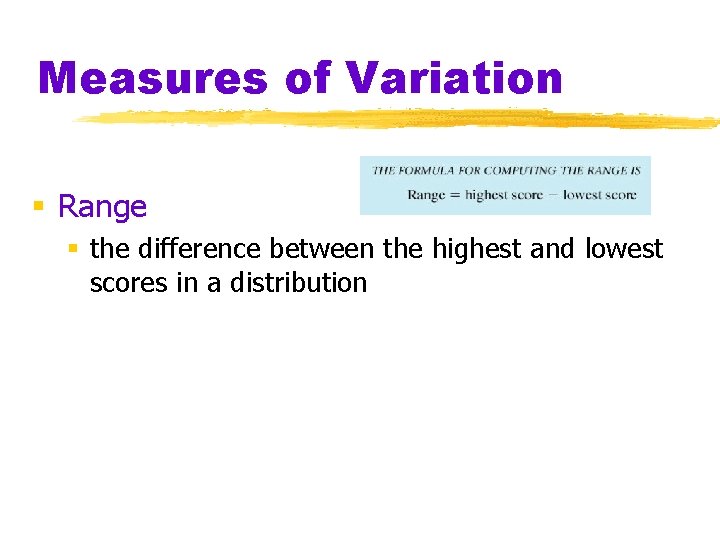
Measures of Variation § Range § the difference between the highest and lowest scores in a distribution
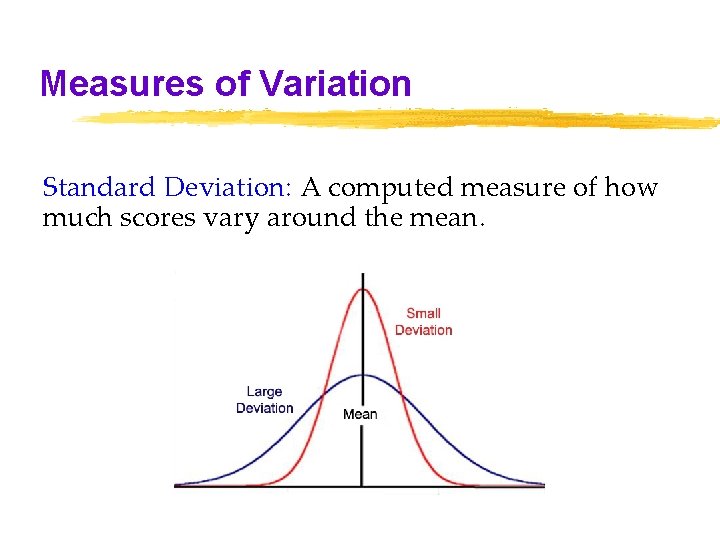
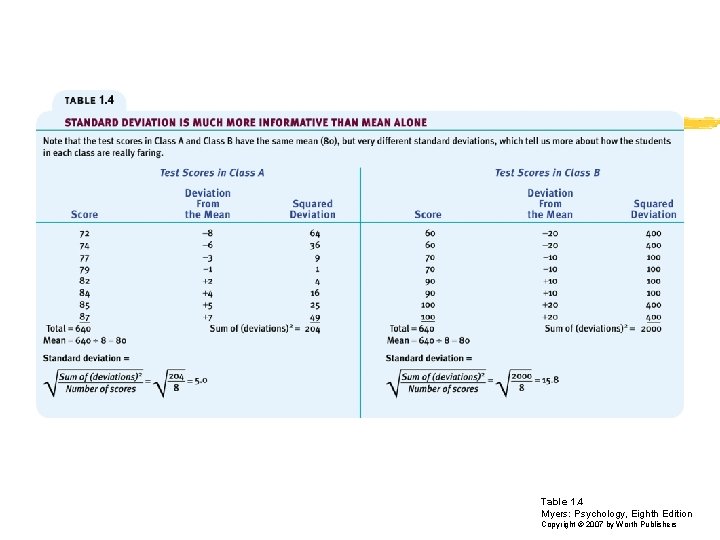
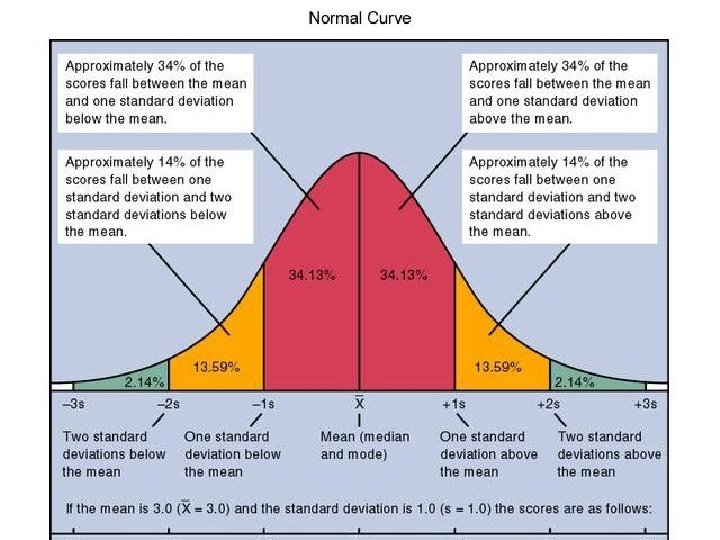
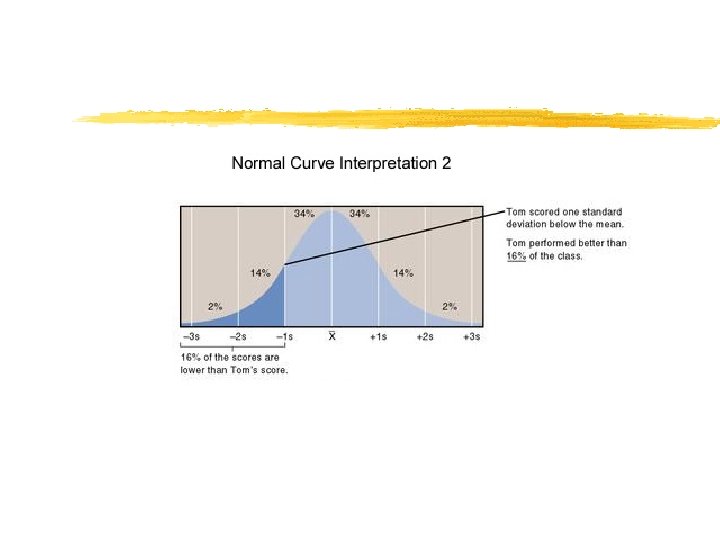
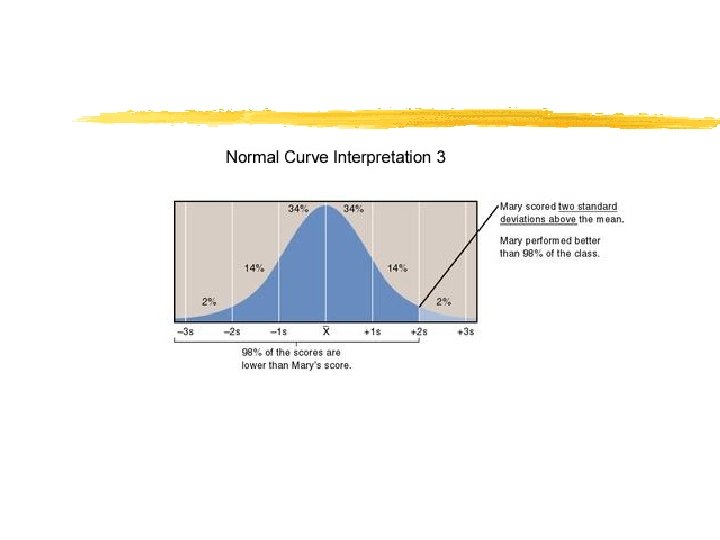
Measures of Variation Standard Deviation: A computed measure of how much scores vary around the mean.
Table 1. 4 Myers: Psychology, Eighth Edition Copyright © 2007 by Worth Publishers
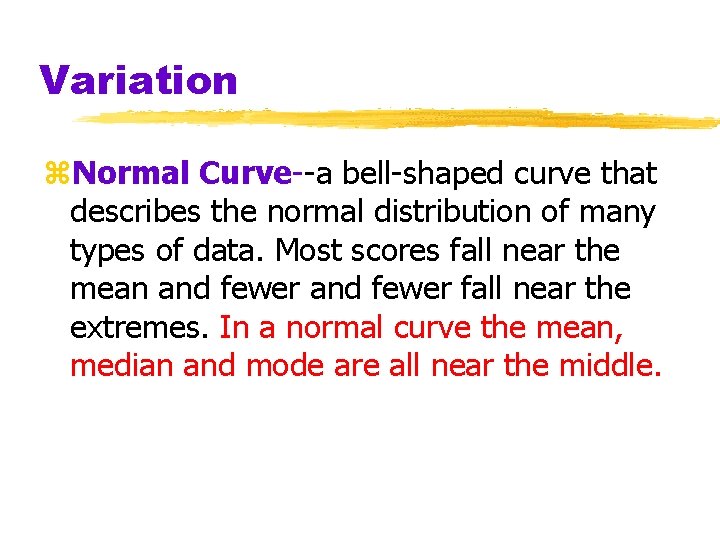
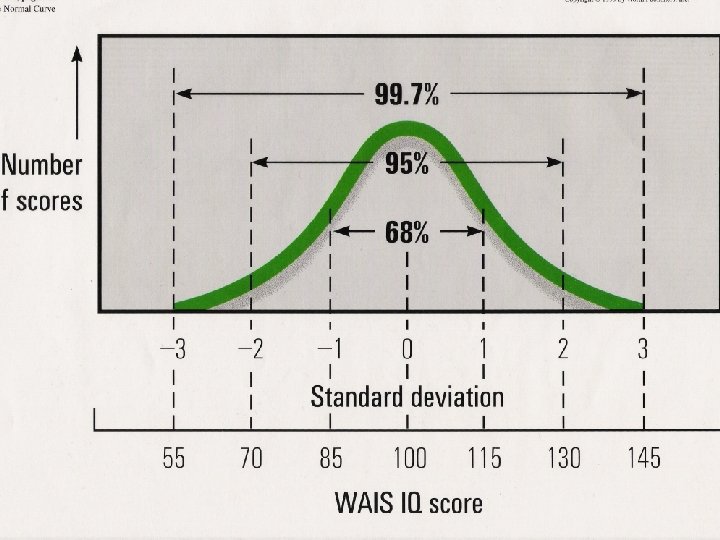
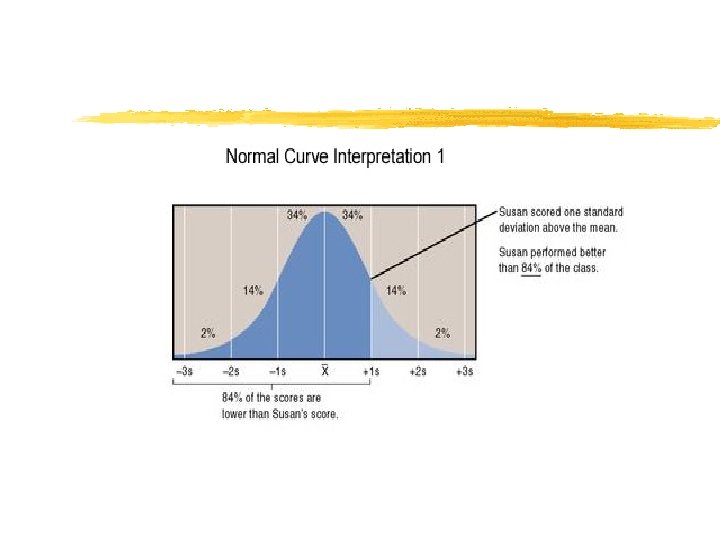
Variation z. Normal Curve--a bell-shaped curve that describes the normal distribution of many types of data. Most scores fall near the mean and fewer fall near the extremes. In a normal curve the mean, median and mode are all near the middle.
Making Inferences A statistical statement of how frequently an obtained result occurred by experimental manipulation or by chance.
Correlation Regression toward the mean— falling back to the norm. It can fuel the illusion that uncontrollable events correlate with out actions.
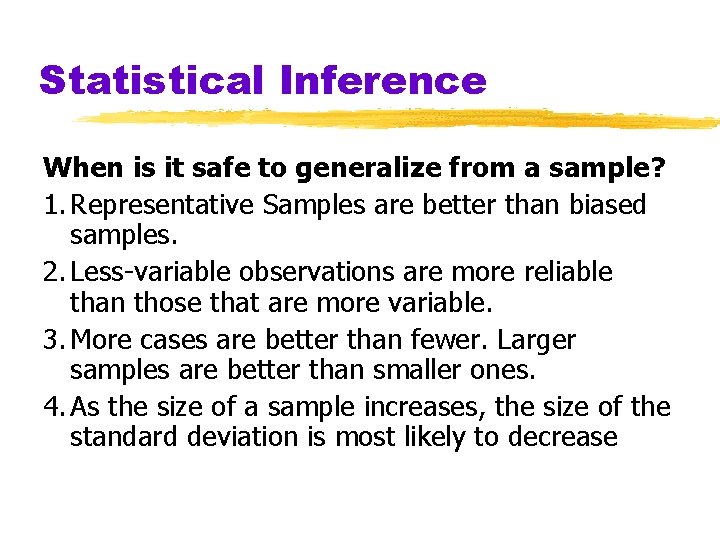
Statistical Inference When is it safe to generalize from a sample? 1. Representative Samples are better than biased samples. 2. Less-variable observations are more reliable than those that are more variable. 3. More cases are better than fewer. Larger samples are better than smaller ones. 4. As the size of a sample increases, the size of the standard deviation is most likely to decrease
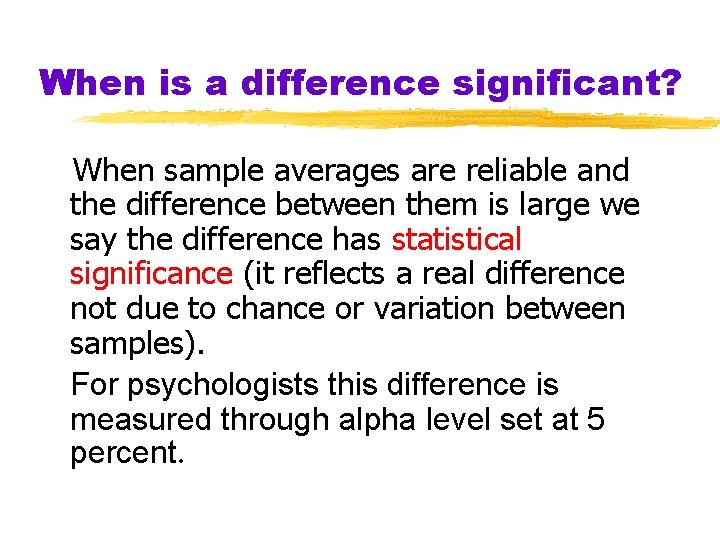
When is a difference significant? When sample averages are reliable and the difference between them is large we say the difference has statistical significance (it reflects a real difference not due to chance or variation between samples). For psychologists this difference is measured through alpha level set at 5 percent.