Limits and Continuity Limits at Infinity End Behavior

“Limits and Continuity”: Limits at Infinity; End Behavior of a Function

� Calculus, 10/E by Howard Anton, Irl Bivens, and Stephen Davis Copyright © 2009 by John Wiley & Sons, Inc. All rights reserved.

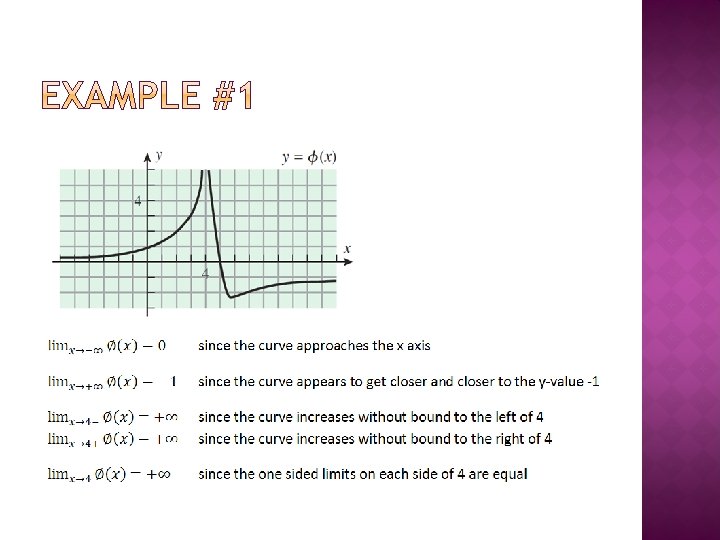
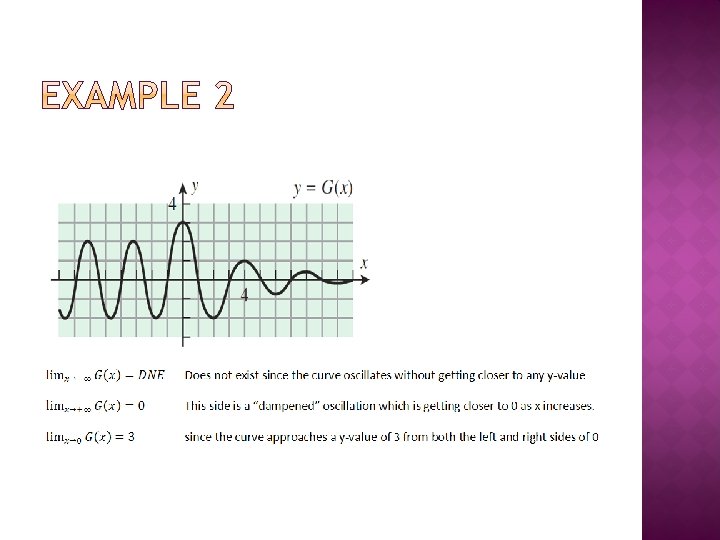
� � We discussed infinite limits briefly on slides 12 & 13 in section 1. 3. We will now expand our look at situations when the value of x increases or decreases without bound (“end behavior”) and as a function approaches a horizontal asymptote. Below is a picture of a function with a horizontal asymptote and a related limit. The further you follow the graph to the right, the closer y values get to the asymptote. That is why the limit is L.

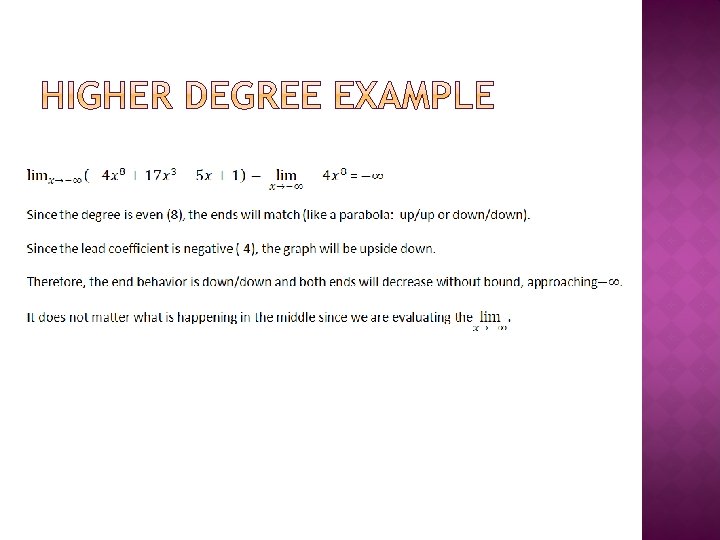
� The end behavior of a polynomial matches the end behavior of its highest degree term. � From the Lead Coefficient Test (+1) and the degree (odd), we know that the end behavior of y= x 3 is down up, therefore, the same must be true for y = x 312 x 2+48 x-63 which is g(x)=(x-4)3+1 in graphing form. � The graph of g(x) on the right does fall to the left and rise to the right, just as end behavior predicts.

� One technique for determining the end behavior of a rational function is to divide each term in the numerator and denominator by the highest power of x that occurs in the denominator, then follow methods we already know. � Example:

� Please read examples 9 -11 in your book on pages 94 -95 and add your favorite one or the one which you least understand to your notes. � We will discuss them next class

� So 1. 2. 3. 4. 5. 6. 7. far: Graph Substitution Simplify, then substitute Multiply numerator and denominator by conjugate of the denominator, then follow with step 3. Analyze end behavior - *NEW* Divide each term in the numerator and denominator by the highest power of x that occurs in the denominator, then follow with other steps. - *NEW* More to come
- Slides: 10