Limiting Forms of Reflection and Scatter from a


 for objects receding")


 Wavelength Maximum (m) Altitude (km) Antenna Size (m) Target")


")


")


- Slides: 27
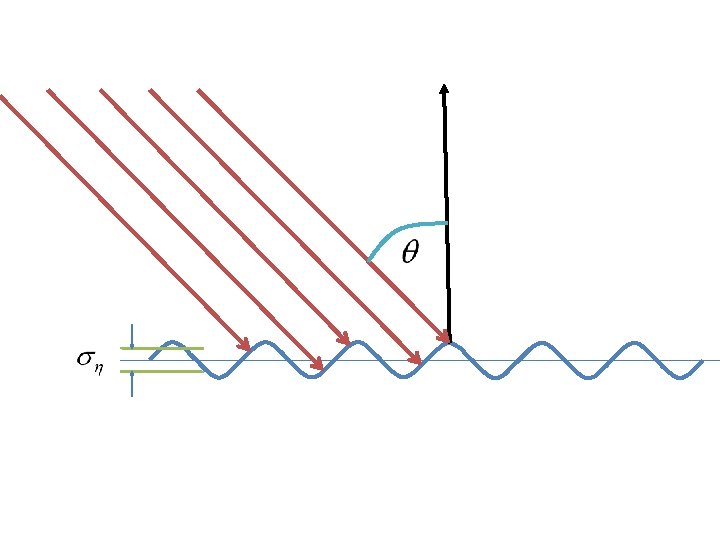
Limiting Forms of Reflection and Scatter from a Surface specular reflector quasi-Lambert reflector quasi-specular reflector Lambert reflector
Doppler Radar From Josh Wurman NCAR S-POL DOPPLER RADAR
Doppler Shift: A frequency shift that occurs in electromagnetic waves due to the motion of scatterers toward or away from the observer. Analogy: The Doppler shift for sound waves is the frequency shift that occurs as race cars approach and then recede from a stationary observer Doppler radar: A radar that can determine the frequency shift through measurement of the phase change that occurs in electromagnetic waves during a series of pulses.
The electric field of a transmitted wave The returned electric field at some later time back at the radar The time it took to travel Substituting: The received frequency can be determined by taking the time derivative if the quantity in parentheses and dividing by 2 p
Sign conventions The Doppler frequency is negative (lower frequency, red shift) for objects receding from the radar The Doppler frequency is positive (higher frequency, blue shift) for objects approaching the radar These “color” shift conventions are typically also used on radar displays of Doppler velocity Red: Receding from radar Blue: Toward radar
Note that Doppler radars are only sensitive to the radial motion of objects Air motion is a three dimensional vector: A Doppler radar can only measure one of these three components – the motion along the beam toward or away from the radar
Magnitude of the Doppler Shift Transmitted Frequency X band Radial velocity 9. 37 GHz C band S band 5. 62 GHz 3. 0 GHz 1 m/s 62. 5 Hz 37. 5 Hz 20. 0 Hz 10 m/s 625 Hz 375 Hz 200 Hz 50 m/s 3125 Hz 1876 Hz 1000 Hz These frequency shifts are very small: for this reason, Doppler radars must employ very stable transmitters and receivers
Clear-Air Radar
10 cm UHF VHF
10 cm UHF VHF
Clear-Air Turbulence
Clear-Air Wind Profilers
Wind Profiler Specifications Frequency (MHz) Wavelength Maximum (m) Altitude (km) Antenna Size (m) Target Band Designation 50 6 20 100 x 100 Clear Air VHF 449 0. 75 15 15 x 15 Clear Air and Heavy Precipitation UHF 915 ~0. 3 5 -6 5 x 5 Clear Air and Precipitation UHF 1036 ~0. 3 5. 5 -6 5 x 5 Clear Air and Precipitation UHF
50 MHz 915 MHz
Positive Toward Surface Radial Velocity
Signal Power
Bragg Diffraction (Scattering)
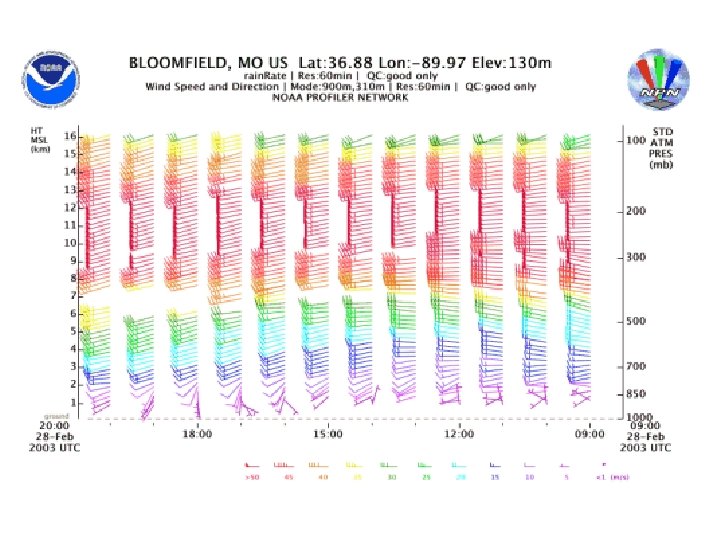
NWS-NOAA Profiler Network
SODAR
SODAR Parameter Performance Horizontal wind speed components Range 0 -20 m/s, accuracy 0. 2 m/s Horizontal wind speed vectors Range 0 - 25 m/s Vertical wind speed components Range 0 - 10 m/sec, accuracy 0. 1 m/s Horizontal wind Direction 0 - 359 degrees Resolution of reading 0. 1 m/s Sampling Height 50 m - 900 m AGL Environmental Conditions -10 C to + 40 C, 0 - 100% humidity Acoustic Frequency 1525 - 2225 Hz (selectable)
Radio-Acoustic Sounding (RASS)
Beam Geometry
Pulsed Radar
Unambiguous Range
Coherent Integration