Limitations of TRACEEIT Temperature Analysis for Coronal Loops

 • TRACE (Lenz")


 – TRACE")


 example loop")

 • Markov-Chain Monte Carlo based DEM algorithm (Kashyap")


- Slides: 35
Limitations of TRACE/EIT Temperature Analysis for Coronal Loops Joan T. Schmelz University of Memphis Monterey, Feb 2006 Uof. M Student Workforce: K. Nasraoui J. Roames L. Lippner J. Garst A. Gibson
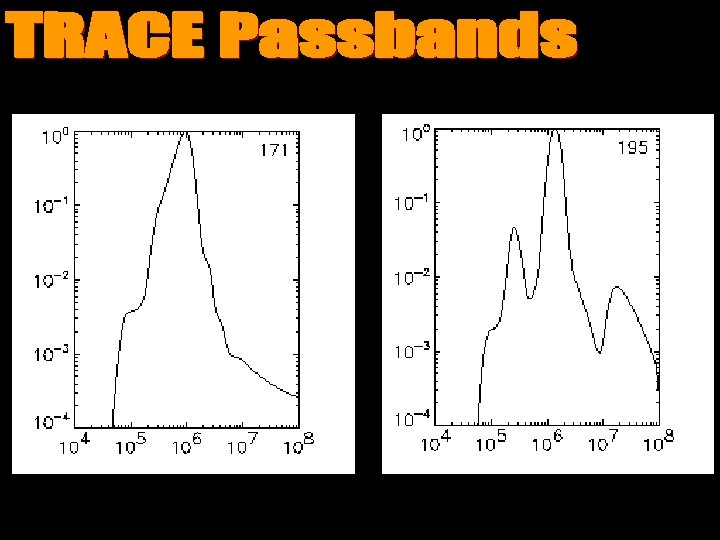
1 st-Generation Loop Temperature Analysis • EIT (Neupert et al. 1998) • TRACE (Lenz et al. 1999) • Isothermal approximation • Ratio of 171 and 195 A images
Observed Ratio Plasma Temperature
TRACE: 171 Loop Pixels
TRACE: 195 Loop Pixels
Reminiscent of results from pioneering papers: flat distribution with T = 1. 2 MK
1 st-Generation Loop Temperature Results • Loops had T~1. 2 MK • Surprise: not RTV • No significant temperature variation along loop length • Could loops be preferentially heated at the footpoints?
2 nd-Generation Loop Temperature Analysis • Aschwanden et al. (2000 etc. ) – TRACE and EIT – 195/171 loops and 284/195 loops – Added background subtraction – Stressed co-alignment • Schmelz et al. (2003, 2006) – Looked at a few loops in great detail
TRACE: Background Pixel
TRACE: Background Pixels
TRACE: Background Pixels
-BG subtraction or not -Simple BG subtraction or complex -Loop pixels or BG pixels
Data Instrument
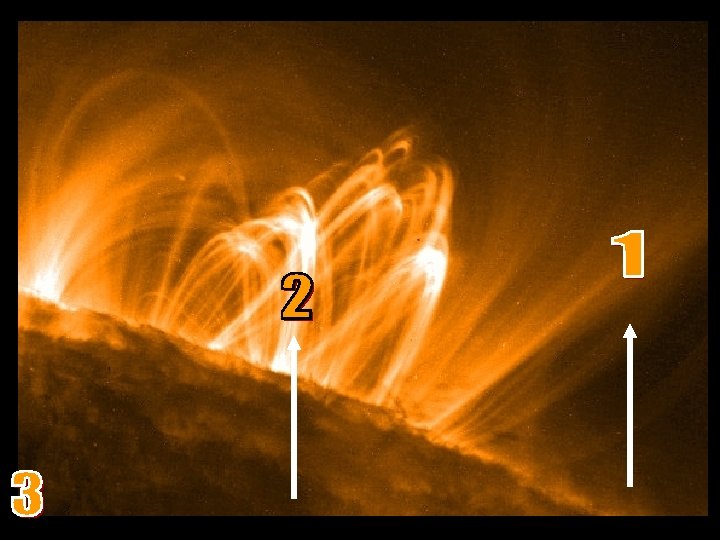
Question for Mark Weber • Why do we see so many 1. 2 MK TRACE Loops? (171/195; AR loops) – Selection effect? – Instrumental effect? – Operator error?
23 22 Log DEM 21 20 19 18 17 5. 0 5. 5 6. 0 Log Temperature 6. 5 7. 0
23 22 Log DEM 21 20 19 18 17 5. 0 5. 5 6. 0 Log Temperature 6. 5 7. 0
23 22 Log DEM 21 20 19 18 17 5. 0 5. 5 6. 0 Log Temperature 6. 5 7. 0
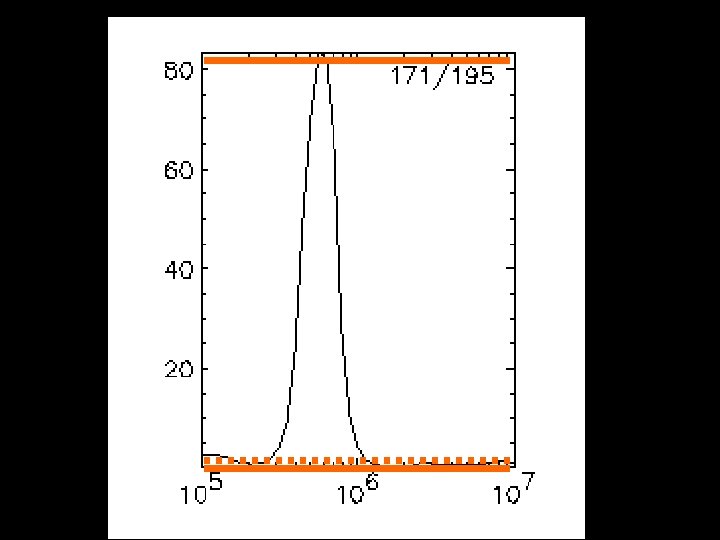
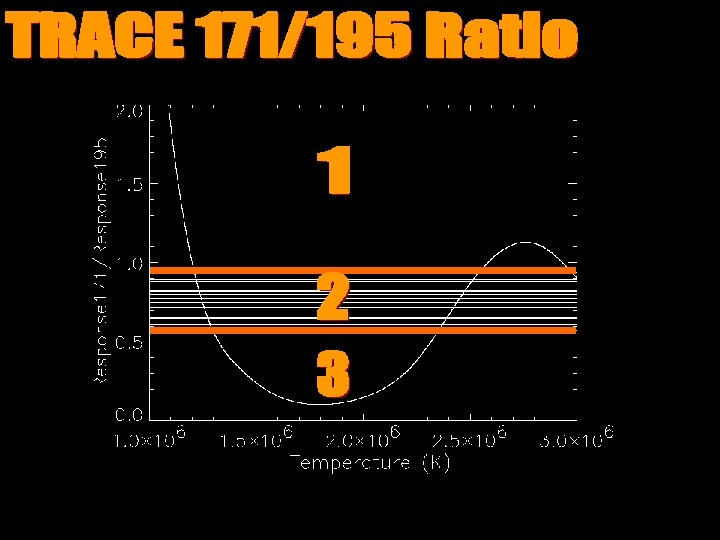
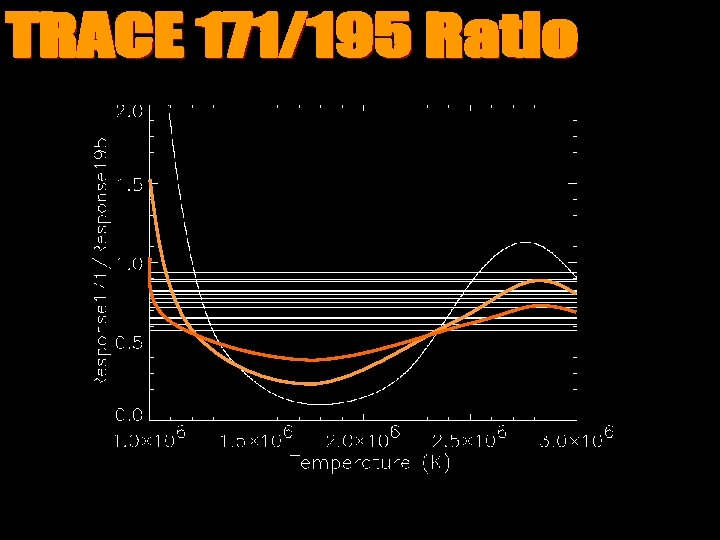
The TRACE 171/195 response ratio collapses toward Mark’s ‘region 2’ if the plasma along the line of sight has a broad temperature distribution
Important Result: Observed 171/195 TRACE ratio was the ratio of the areas under the response curves (~1) which corresponds to T = 1. 2 MK
There is a Second Class of Solutions to Explain Flat TRACE 171/195 Ratios for AR loops: 1. All the AR plasma is at 1. 2 MK 2. There is a broad T-distribution along the line of sight -- Weber et al. (2005)
3 rd-Generation Loop Temperature Analysis • Zhang, White & Kundu 1999 • Chae et al. 2002 • Aschwanden & Nightingale 2005 • Use three coronal fliters 171/195/284
Aschwanden & Nightingale (2005) example loop
Isothermal Approximation T=1. 2 MK
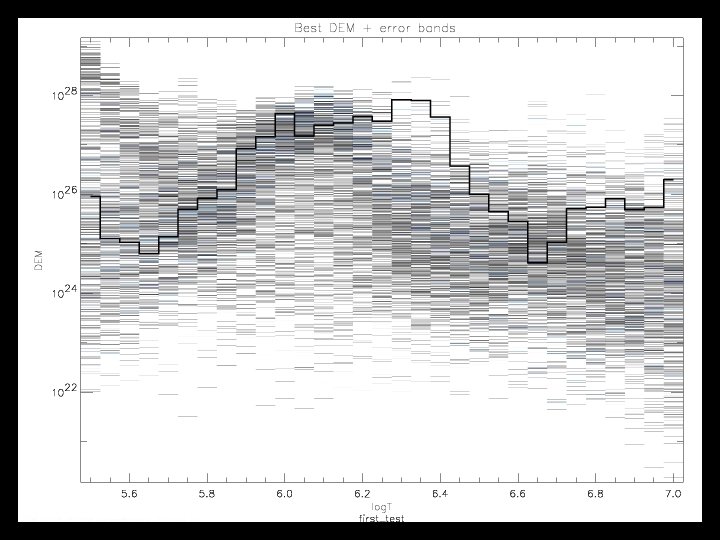
DEM from Vinay Kashyap (Cf. A) • Markov-Chain Monte Carlo based DEM algorithm (Kashyap & Drake 1998) • PINTof. ALE (Kashyap & Drake 2000) • Iterative forward fit of DEM(T) • DEM modification done randomly to obtain new models to compare with data
• Problem: plasma could be isothermal, the 3 filters cannot constrain the DEM • Solution: need more filters with higher & lower temperature responses -- AIA
AIA Sequence • AIA provides – high-T and low-T constraints on the DEM – Sufficient T coverage to determine isothermal vs. multi-thermal structure • Along the line of sight • Along the length of the loop • Image the AR loops in all AIA filters (even if the loops aren’t visible in all filters)
The absence of photons is NOT an absence of information -- Leon Golub