
Limitations and opportunities of insulin therapy Luigi Meneghini
- Slides: 36
Limitations and opportunities of insulin therapy Luigi Meneghini June 8 th, 2012
Outline • Insulin need versus implementation • Options for initiating insulin in T 2 DM • Limitations & opportunities for more stable basal insulins • Degludec pharmacodynamics and clinical studies • Adding an incretin to basal insulin replacement
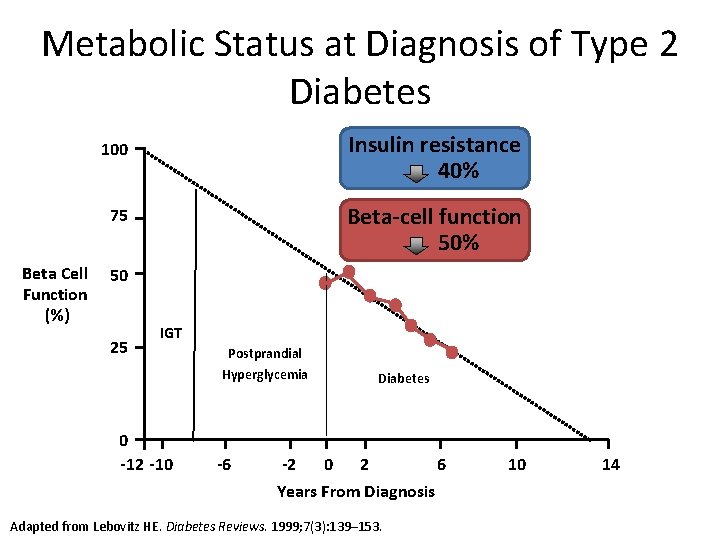
Metabolic Status at Diagnosis of Type 2 Diabetes Insulin resistance 40% 100 Beta-cell function 50% 75 Beta Cell Function (%) 50 25 IGT 0 -12 -10 Postprandial Hyperglycemia -6 -2 Diabetes 0 2 Years From Diagnosis Adapted from Lebovitz HE. Diabetes Reviews. 1999; 7(3): 139– 153. 6 10 14
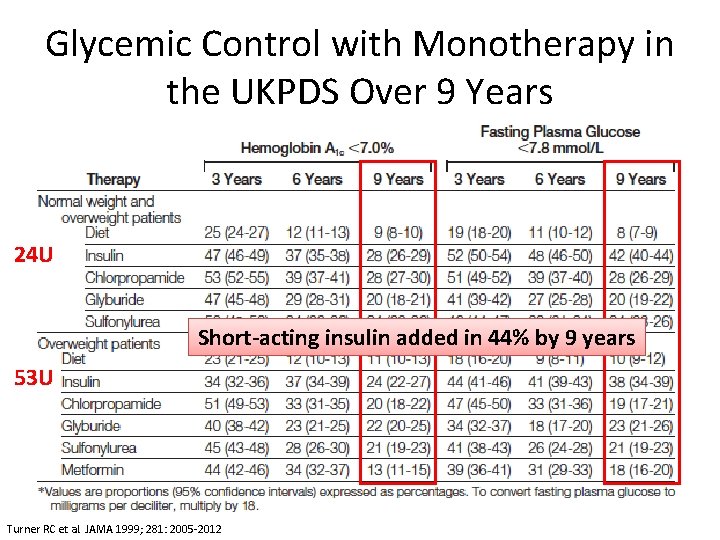
Glycemic Control with Monotherapy in the UKPDS Over 9 Years 24 U Short-acting insulin added in 44% by 9 years 53 U Turner RC et al. JAMA 1999; 281: 2005 -2012
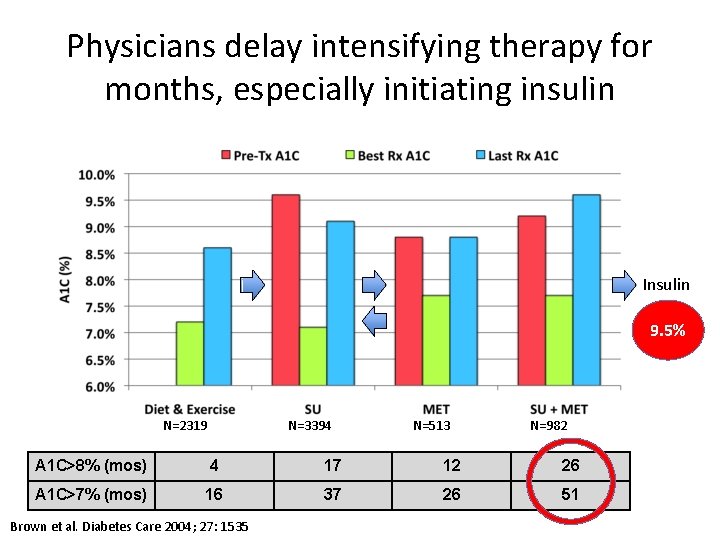
Physicians delay intensifying therapy for months, especially initiating insulin Insulin 9. 5% N=2319 N=3394 N=513 N=982 A 1 C>8% (mos) 4 17 12 26 A 1 C>7% (mos) 16 37 26 51 Brown et al. Diabetes Care 2004; 27: 1535
Options for Initiating & Intensifying Insulin Therapy in Type 2 Diabetes
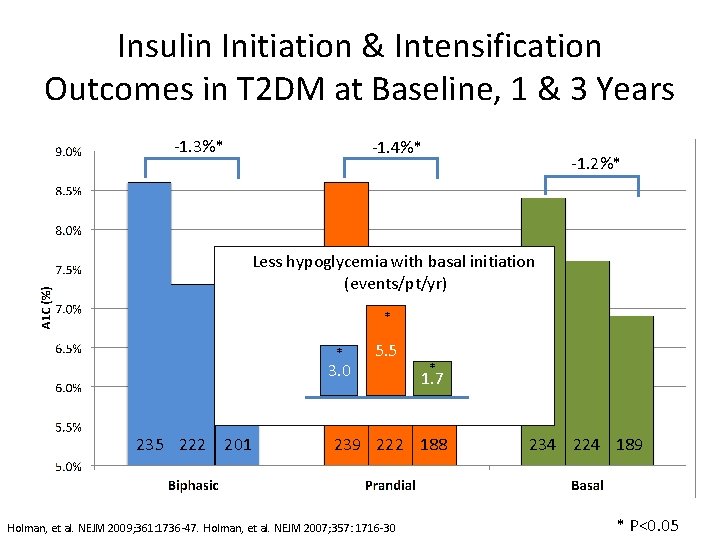
Insulin Initiation & Intensification Outcomes in T 2 DM at Baseline, 1 & 3 Years -1. 3%* -1. 4%* -1. 2%* Less hypoglycemia with basal initiation (events/pt/yr) * * 3. 0 235 222 201 5. 5 * 1. 7 239 222 188 Holman, et al. NEJM 2009; 361: 1736 -47. Holman, et al. NEJM 2007; 357: 1716 -30 234 224 189 * P<0. 05
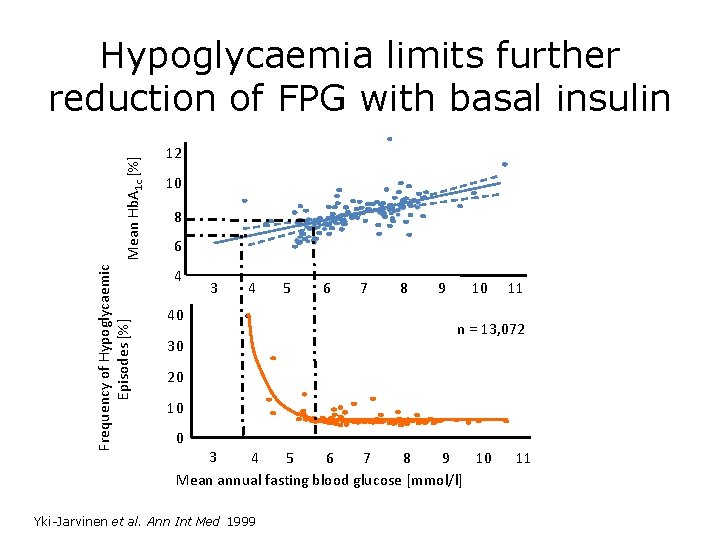
Frequency of Hypoglycaemic Episodes [%] Mean Hb. A 1 c [%] Hypoglycaemia limits further reduction of FPG with basal insulin 12 10 8 6 4 3 4 40 30 5 6 7 8 9 10 11 n = 13, 072 20 10 0 3 4 5 6 7 8 9 10 Mean annual fasting blood glucose [mmol/l] Yki-Jarvinen et al. Ann Int Med 1999 11
How do Pharmacodynamics of Basal Insulin Preparations Affect Outcomes
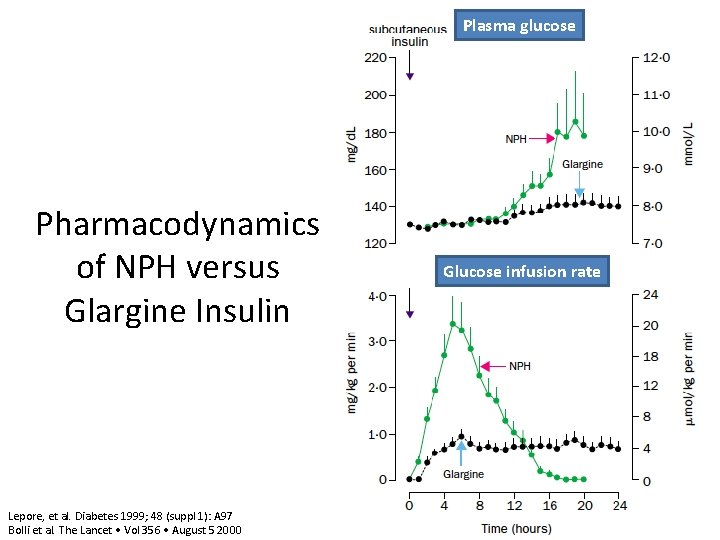
Plasma glucose Pharmacodynamics of NPH versus Glargine Insulin Lepore, et al. Diabetes 1999; 48 (suppl 1): A 97 Bolli et al. The Lancet • Vol 356 • August 5 2000 Glucose infusion rate
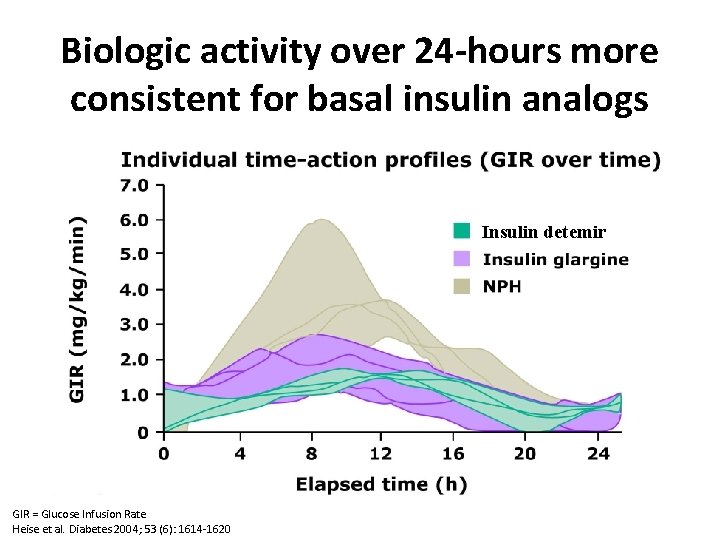
Biologic activity over 24 -hours more consistent for basal insulin analogs Insulin detemir GIR = Glucose Infusion Rate Heise et al. Diabetes 2004; 53 (6): 1614 -1620
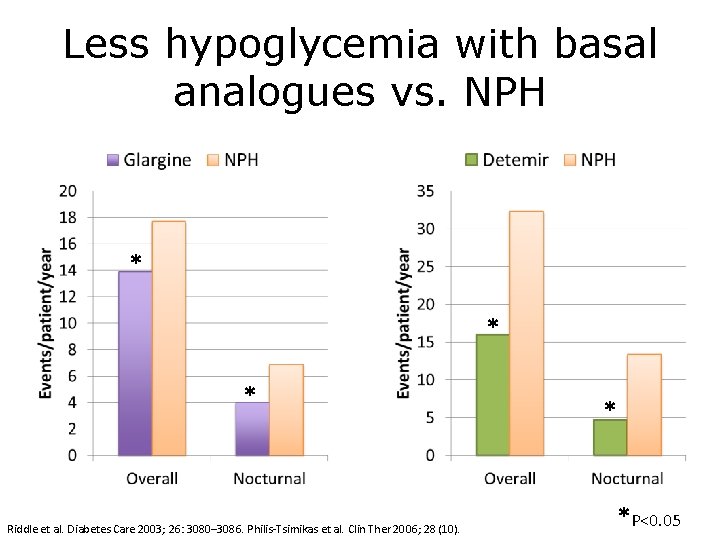
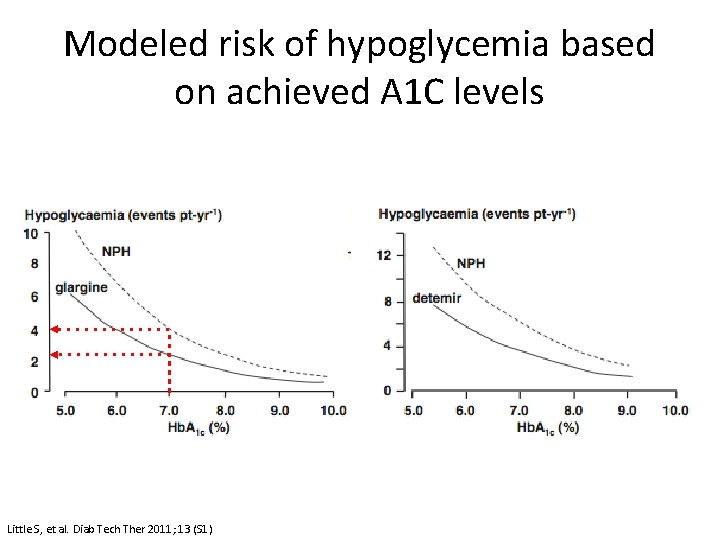
Less hypoglycemia with basal analogues vs. NPH * * * Riddle et al. Diabetes Care 2003; 26: 3080– 3086. Philis-Tsimikas et al. Clin Ther 2006; 28 (10). * *P<0. 05
Modeled risk of hypoglycemia based on achieved A 1 C levels Little S, et al. Diab Tech Ther 2011; 13 (S 1)
Improving on current basal insulin analogs • Extend duration of action • Flat pharmacodynamic profile • Reduced day-to-day variability
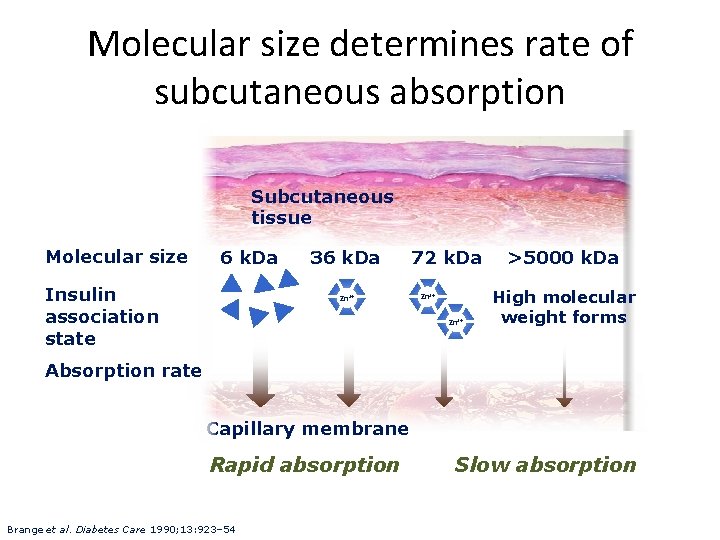
Molecular size determines rate of subcutaneous absorption Subcutaneous tissue Molecular size 6 k. Da Insulin association state 36 k. Da Zn 2+ 72 k. Da Zn 2+ >5000 k. Da High molecular weight forms Absorption rate Capillary membrane Rapid absorption Brange et al. Diabetes Care 1990; 13: 923– 54 Slow absorption
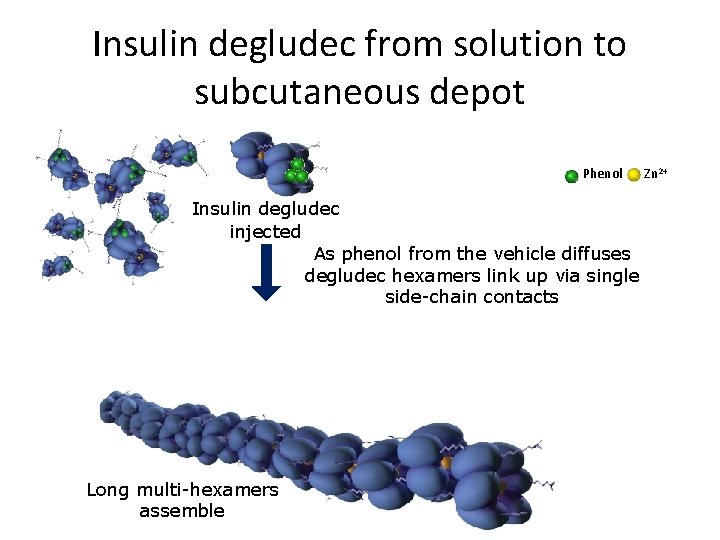
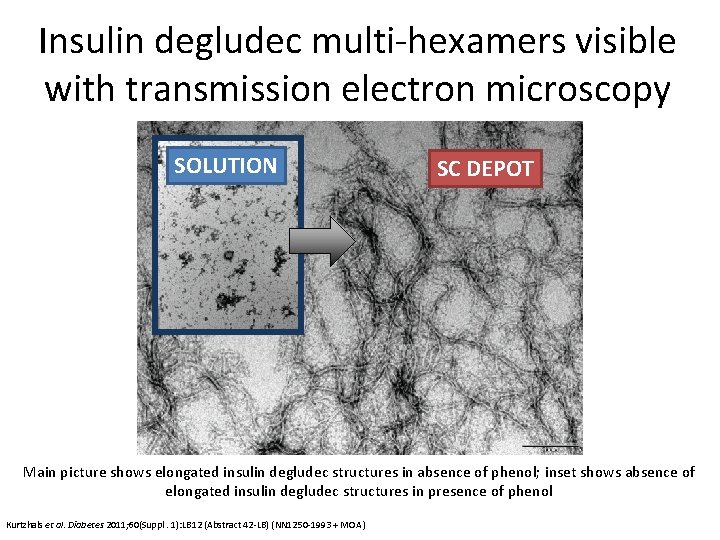
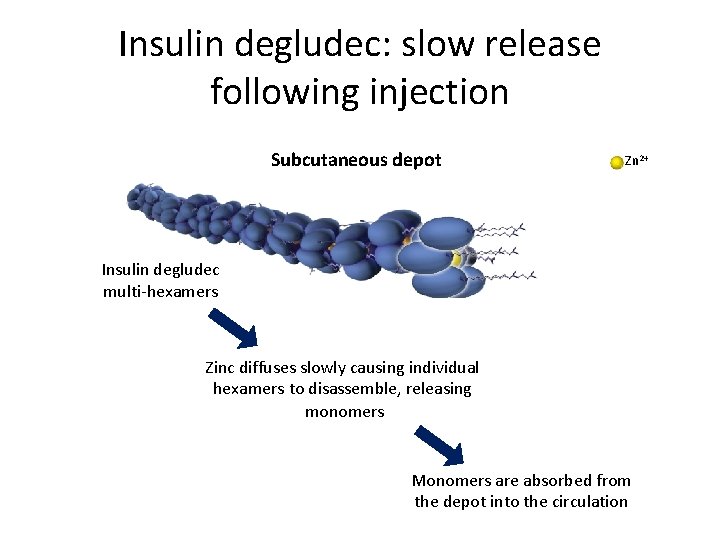
Insulin degludec from solution to subcutaneous depot Phenol Insulin degludec injected As phenol from the vehicle diffuses degludec hexamers link up via single side-chain contacts Long multi-hexamers assemble Zn 2+
Insulin degludec multi-hexamers visible with transmission electron microscopy SOLUTION SC DEPOT Main picture shows elongated insulin degludec structures in absence of phenol; inset shows absence of elongated insulin degludec structures in presence of phenol Kurtzhals et al. Diabetes 2011; 60(Suppl. 1): LB 12 (Abstract 42 -LB) (NN 1250 -1993 + MOA )
Insulin degludec: slow release following injection Subcutaneous depot Zn 2+ Insulin degludec multi-hexamers Zinc diffuses slowly causing individual hexamers to disassemble, releasing monomers Monomers are absorbed from the depot into the circulation
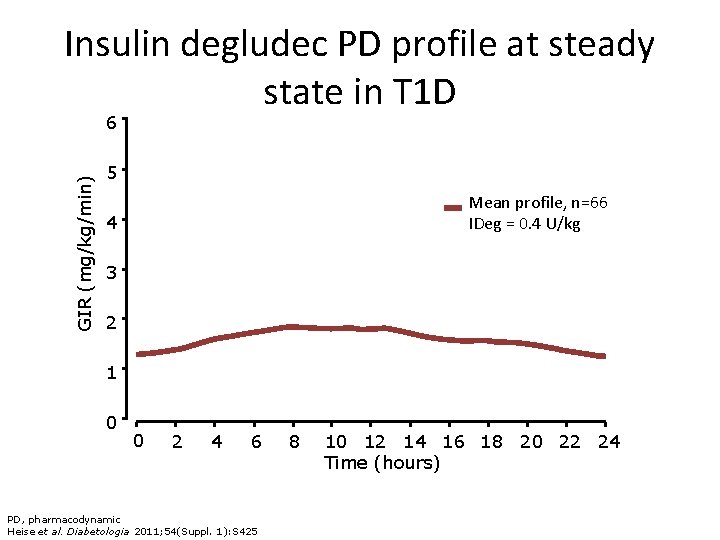
Insulin degludec PD profile at steady state in T 1 D GIR (mg/kg/min) 6 5 Mean profile, n=66 IDeg = 0. 4 U/kg 4 3 2 1 0 0 2 4 6 PD, pharmacodynamic Heise et al. Diabetologia 2011; 54(Suppl. 1): S 425 8 10 12 14 16 18 20 22 24 Time (hours)
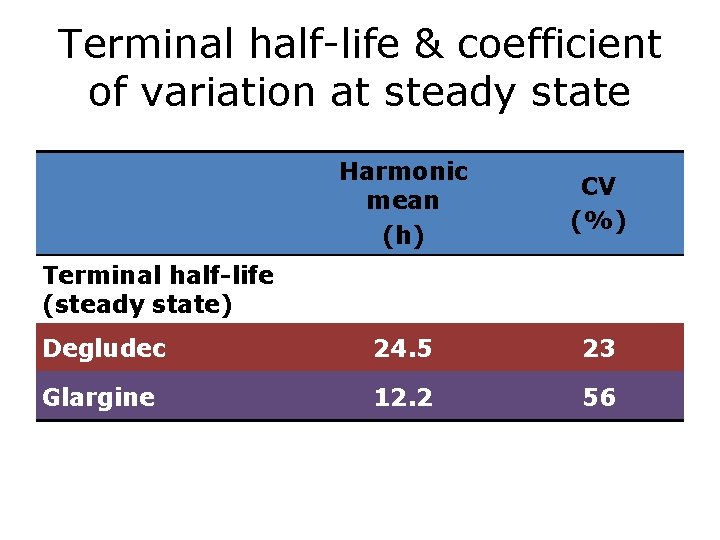
Terminal half-life & coefficient of variation at steady state Harmonic mean (h) CV (%) Degludec 24. 5 23 Glargine 12. 2 56 Terminal half-life (steady state)
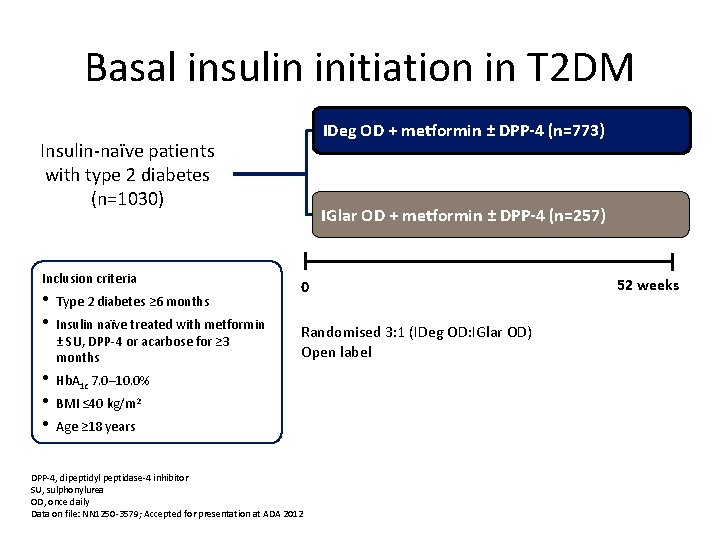
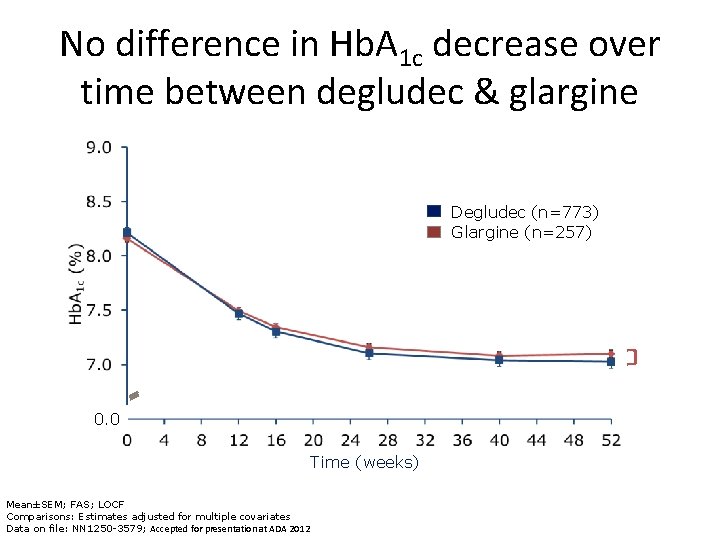
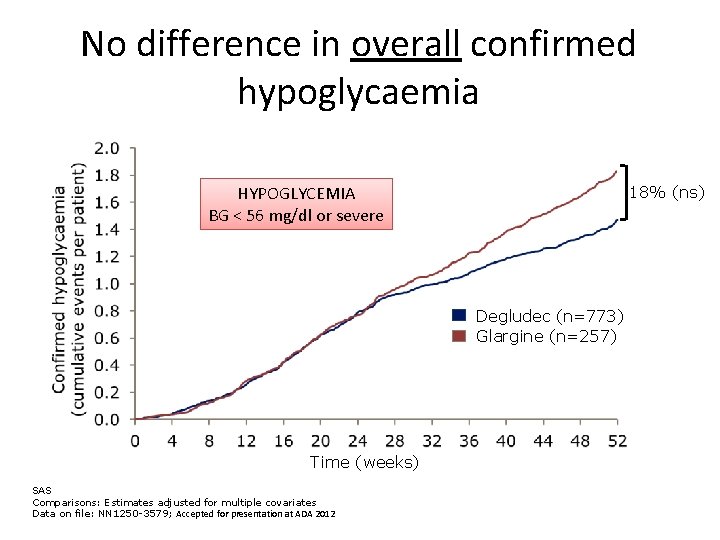
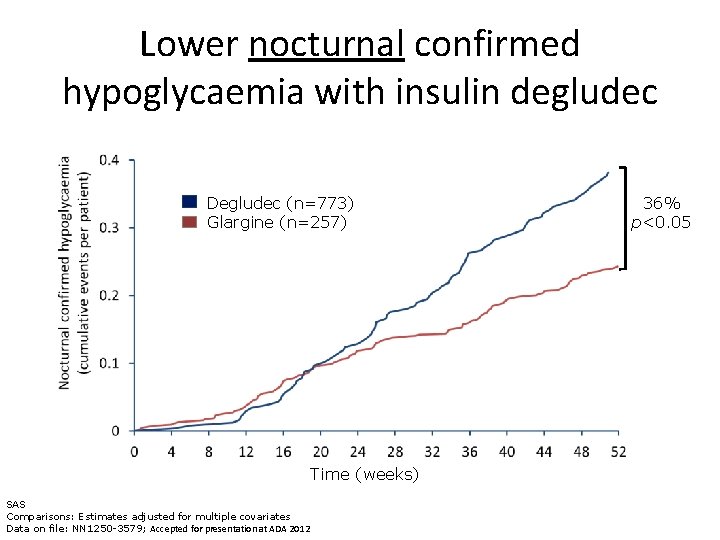
Basal insulin initiation in T 2 DM IDeg OD + metformin ± DPP-4 (n=773) Insulin-naïve patients with type 2 diabetes (n=1030) Inclusion criteria • Type 2 diabetes ≥ 6 months • Insulin naïve treated with metformin ± SU, DPP-4 or acarbose for ≥ 3 months IGlar OD + metformin ± DPP-4 (n=257) 0 Randomised 3: 1 (IDeg OD: IGlar OD) Open label • Hb. A 1 c 7. 0– 10. 0% • BMI ≤ 40 kg/m 2 • Age ≥ 18 years DPP-4, dipeptidyl peptidase-4 inhibitor SU, sulphonylurea OD, once daily Data on file: NN 1250 -3579; Accepted for presentation at ADA 2012 52 weeks
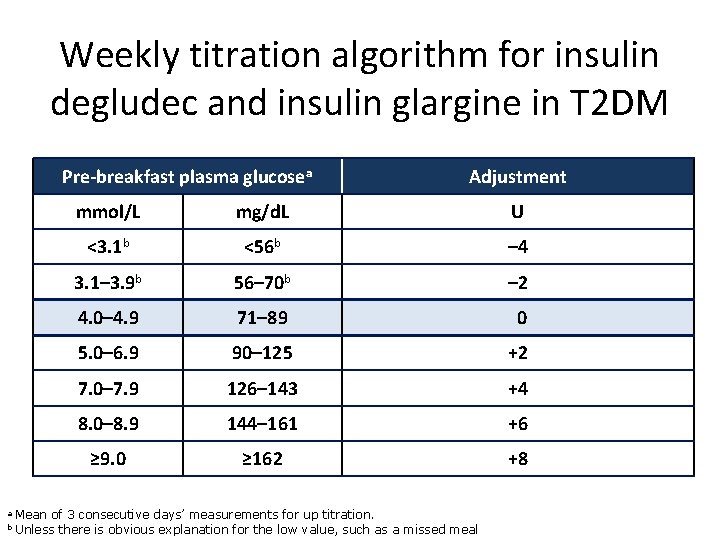
Weekly titration algorithm for insulin degludec and insulin glargine in T 2 DM Pre-breakfast plasma glucosea a b Adjustment mmol/L mg/d. L U <3. 1 b <56 b – 4 3. 1– 3. 9 b 56– 70 b – 2 4. 0– 4. 9 71– 89 0 5. 0– 6. 9 90– 125 +2 7. 0– 7. 9 126– 143 +4 8. 0– 8. 9 144– 161 +6 ≥ 9. 0 ≥ 162 +8 Mean of 3 consecutive days’ measurements for up titration. Unless there is obvious explanation for the low value, such as a missed meal
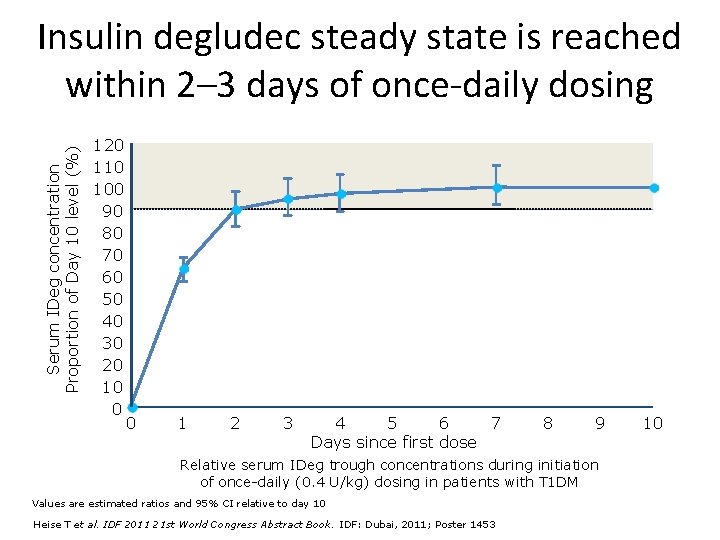
Serum IDeg concentration Proportion of Day 10 level (%) Insulin degludec steady state is reached within 2– 3 days of once-daily dosing 120 110 100 90 80 70 60 50 40 30 20 10 0 0 1 2 3 4 5 6 7 Days since first dose 8 9 Relative serum IDeg trough concentrations during initiation of once-daily (0. 4 U/kg) dosing in patients with T 1 DM Values are estimated ratios and 95% CI relative to day 10 Heise T et al. IDF 2011 21 st World Congress Abstract Book. IDF: Dubai, 2011; Poster 1453 10
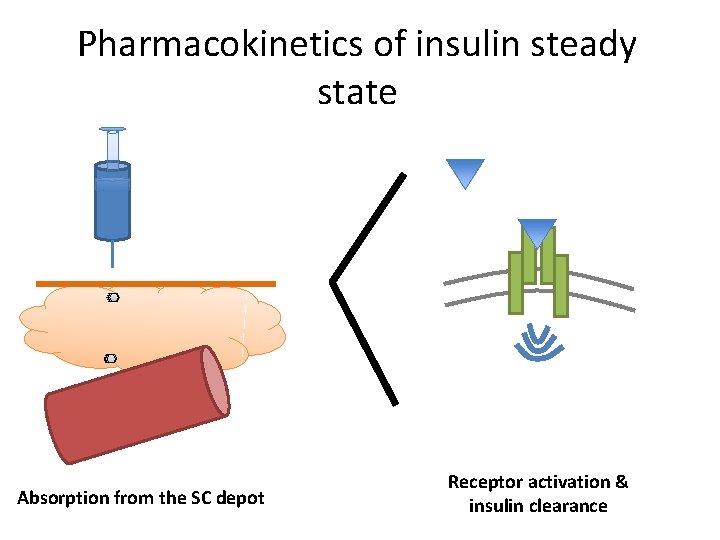
Pharmacokinetics of insulin steady state Absorption from the SC depot Receptor activation & insulin clearance
No difference in Hb. A 1 c decrease over time between degludec & glargine Degludec (n=773) Glargine (n=257) 0. 0 Time (weeks) Mean±SEM; FAS; LOCF Comparisons: Estimates adjusted for multiple covariates Data on file: NN 1250 -3579; Accepted for presentation at ADA 2012
No difference in overall confirmed hypoglycaemia HYPOGLYCEMIA BG < 56 mg/dl or severe 18% (ns) Degludec (n=773) Glargine (n=257) Time (weeks) SAS Comparisons: Estimates adjusted for multiple covariates Data on file: NN 1250 -3579; Accepted for presentation at ADA 2012
Lower nocturnal confirmed hypoglycaemia with insulin degludec Degludec (n=773) Glargine (n=257) Time (weeks) SAS Comparisons: Estimates adjusted for multiple covariates Data on file: NN 1250 -3579; Accepted for presentation at ADA 2012 36% p<0. 05
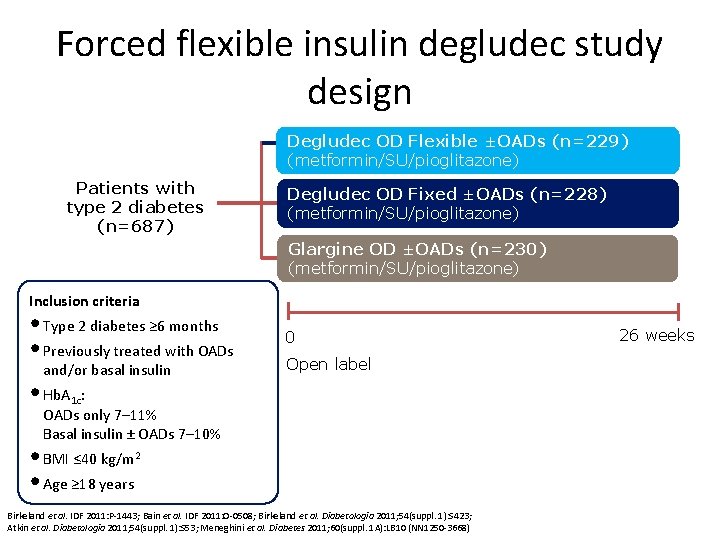
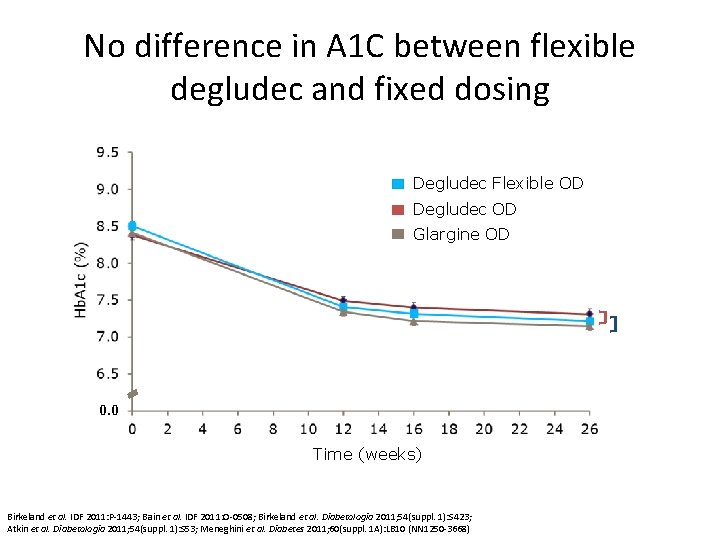
Forced flexible insulin degludec study design Degludec OD Flexible ±OADs (n=229) (metformin/SU/pioglitazone) Patients with type 2 diabetes (n=687) Degludec OD Fixed ±OADs (n=228) (metformin/SU/pioglitazone) Glargine OD ±OADs (n=230) (metformin/SU/pioglitazone) Inclusion criteria • Type 2 diabetes ≥ 6 months • Previously treated with OADs and/or basal insulin 0 Open label • Hb. A 1 c: OADs only 7– 11% Basal insulin ± OADs 7– 10% • BMI ≤ 40 kg/m 2 • Age ≥ 18 years Birkeland et al. IDF 2011: P-1443; Bain et al. IDF 2011: O-0508; Birkeland et al. Diabetologia 2011; 54(suppl. 1): S 423; Atkin et al. Diabetologia 2011; 54(suppl. 1): S 53; Meneghini et al. Diabetes 2011; 60(suppl. 1 A): LB 10 (NN 1250 -3668) 26 weeks
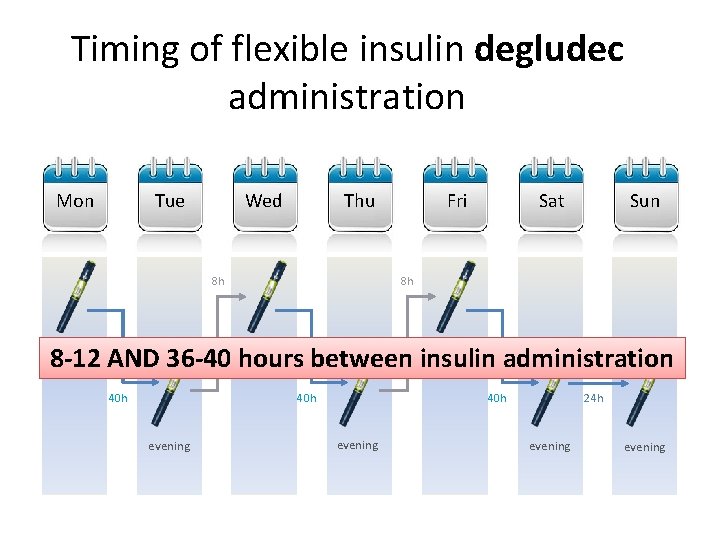
Timing of flexible insulin degludec administration Mon Tue Wed Thu 8 h morning Fri Sat Sun 8 h morning 8 -12 AND 36 -40 hours between insulin administration 40 h evening 24 h evening
No difference in A 1 C between flexible degludec and fixed dosing Degludec Flexible OD Degludec OD Glargine OD 0. 0 Time (weeks) Birkeland et al. IDF 2011: P-1443; Bain et al. IDF 2011: O-0508; Birkeland et al. Diabetologia 2011; 54(suppl. 1): S 423; Atkin et al. Diabetologia 2011; 54(suppl. 1): S 53; Meneghini et al. Diabetes 2011; 60(suppl. 1 A): LB 10 (NN 1250 -3668)
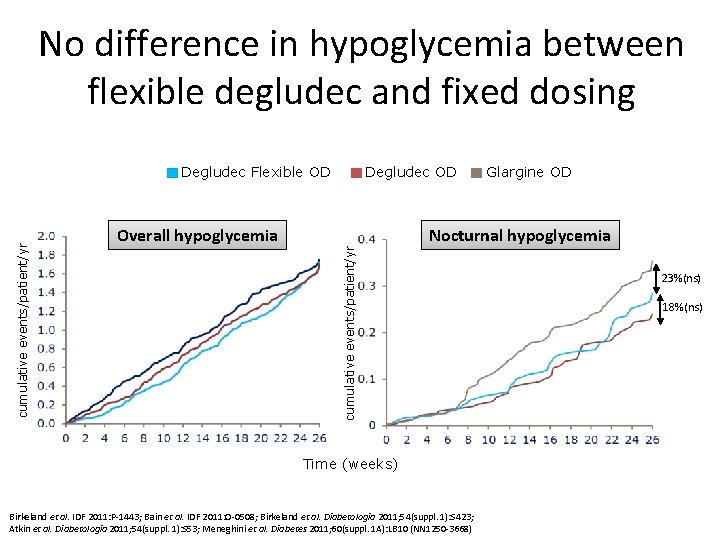
No difference in hypoglycemia between flexible degludec and fixed dosing Degludec OD Overall hypoglycemia Glargine OD Nocturnal hypoglycemia cumulative events/patient/yr Degludec Flexible OD Time (weeks) Birkeland et al. IDF 2011: P-1443; Bain et al. IDF 2011: O-0508; Birkeland et al. Diabetologia 2011; 54(suppl. 1): S 423; Atkin et al. Diabetologia 2011; 54(suppl. 1): S 53; Meneghini et al. Diabetes 2011; 60(suppl. 1 A): LB 10 (NN 1250 -3668) 23%(ns) 18%(ns)
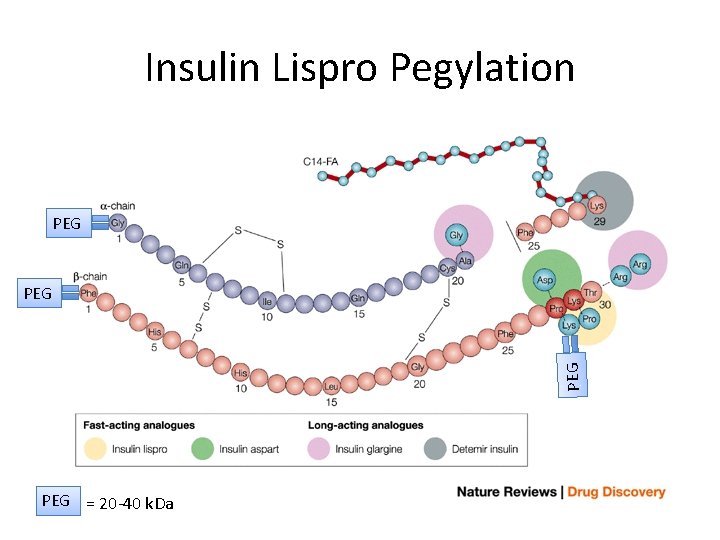
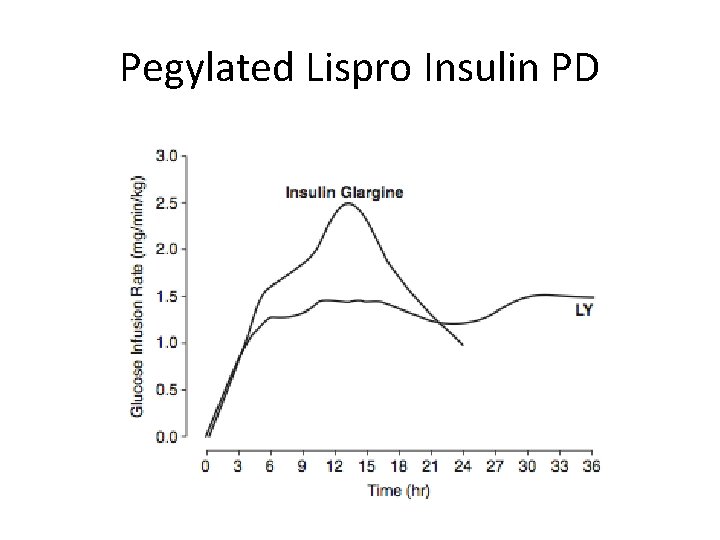
Insulin Lispro Pegylation PEG PEG = 20 -40 k. Da
Pegylated Lispro Insulin PD
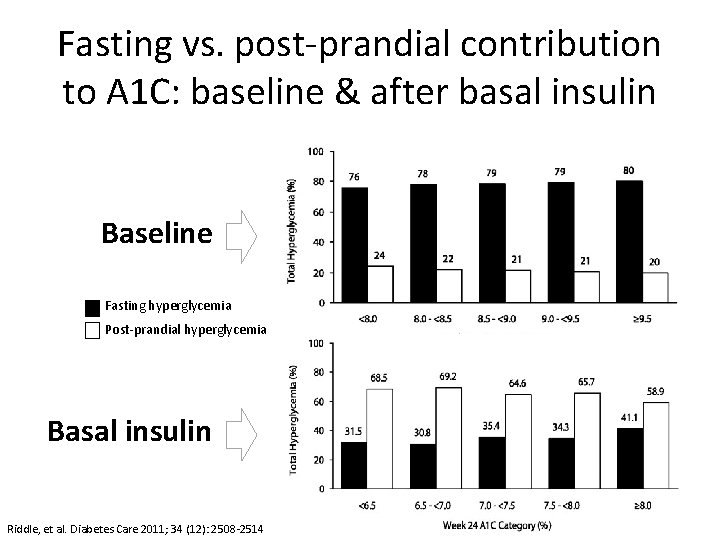
Fasting vs. post-prandial contribution to A 1 C: baseline & after basal insulin Baseline Fasting hyperglycemia Post-prandial hyperglycemia Basal insulin Riddle, et al. Diabetes Care 2011; 34 (12): 2508 -2514
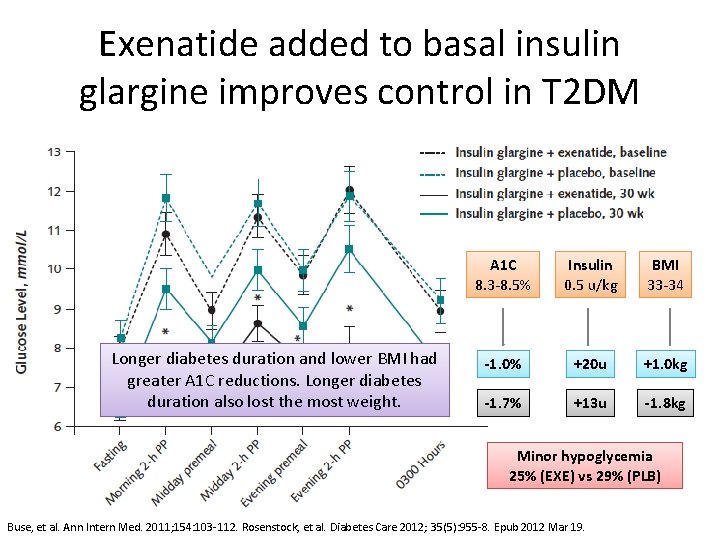
Exenatide added to basal insulin glargine improves control in T 2 DM Longer diabetes duration and lower BMI had greater A 1 C reductions. Longer diabetes duration also lost the most weight. A 1 C 8. 3 -8. 5% Insulin 0. 5 u/kg BMI 33 -34 -1. 0% +20 u +1. 0 kg -1. 7% +13 u -1. 8 kg Minor hypoglycemia 25% (EXE) vs 29% (PLB) Buse, et al. Ann Intern Med. 2011; 154: 103 -112. Rosenstock, et al. Diabetes Care 2012; 35(5): 955 -8. Epub 2012 Mar 19.
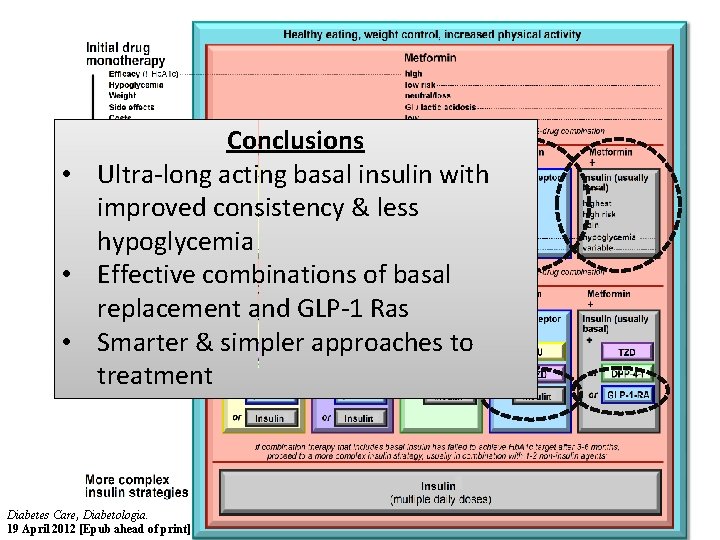
Conclusions • Ultra-long acting basal insulin with improved consistency & less hypoglycemia • Effective combinations of basal replacement and GLP-1 Ras • Smarter & simpler approaches to treatment Diabetes Care, Diabetologia. 19 April 2012 [Epub ahead of print]