Likelihood analysis of Beam Data for Time Of

Likelihood analysis of Beam Data for Time Of Propagation counter Yoshinori Arita , Nagoya University on behalf of the Belle II PID group K. Inami*, K. Suzuki*, T. Iijima*, M. Jones**, G. Varner**, M. Staric*** (*Nagoya University, **University of Hawaii, ***Jozef Stefan Institute, Ljubljana) IEEE 2012 Nuclear Science Symposium, Anaheim, California, October 31
 □Belle II will")
Belle II @ super KEKB Belle II experiment (start from 2016) □Belle II will perform high precision tests of Standard Model and search for new physics. Belle II will collect 50 ab-1 as integrated luminosity. □We require high efficiency and low fake rate for the K±/π± separation. For example , to distinguish between - B→ρ (ππ)γ and B→K* (Kπ)γ Belle II detector e- 7 Ge. V/c ⇒Upgrade Belle detector e+ 4 Ge. V/c 8 m TOP counter Upgrade barrel PID system : Time Of Propagation (TOP) counter □ Improve performance (efficiency and fake rate of π/K separation). □ TOP counter will be compact compared to original PID systems. IEEE NSS - 31 Oct 2012 Y. Arita, Belle II TOP counter 2/12
 counter □Measure velocity(β) of charged particle Cherenkov light")
The principle of Time Of Propagation(TOP) counter □Measure velocity(β) of charged particle Cherenkov light cone TOP(Time Of Propagation) Quartz TOF(Time Of Flight) ~1. 2 m e+ X( ch ) e. MCP-PMT Accumulated Ring Image simulation based on GEANT 3 π/K( β=0. 997 , 0. 970 ) Nhit ~20 IP Δtime K/π (θc: Cherenkov angle) time[TOF+TOP](ps) TOPcounter = Ring Image Cherenkov counter with precise time information 2 Ge. V/c , θ=90° X(cm) Ring Image will be reconstructed by detected photons. ⇒Perform beam test to Reconstruct ring image from time(TOP+TOF) confirm separation power and position(x) of detected photon. with TOP counter Prototype 3/12 IEEE NSS - 31 Oct 2012 Y. Arita, Belle II TOP counter

TOP counter prototype Quartz MCP-PMT array 400 mm Quartz 915 mm 400 mm 20 mm 915 mm Focusing Mirror 400 mm 20 mm 1850 mm Photo counter(MCP-PMT) ・ 4 ch x 8 PMTs = 32 channels ・TTS < 40 ps ・QE~20. 5 % @400 nm Quartz bar Focusing mirror ・Roughness at surface ~5Å ・Al mirror ・index n = 1. 47@400 nm ・Spherical shape(r=5 m) Need perfect reflection. Correct chromatic dispersion. 1 ch 32 ch 4 ch 1/2 coverage ➣half of full detected photons IEEE NSS - 31 Oct 2012 Y. Arita, Belle II TOP counter mirror 4/12

Beam test @ CERN beam line T 4 -H 6 -B beam line (CERN, SPS) - single π+ Beam incident condition π beam cosθ = 0. 5 (@Belle II) ➣π beam tilt 30°to mirror. ➣All of emitted photons are reflected at mirror. - 120 Ge. V/c(β≒ 1) - ~1 million tracks Beam test setup 100 mm X Incident position at surface of TOP counter 100 mm Z ➣narrow beam in Φ 5 mm ➣Good time resolution of start timing in 19 ps Y. Arita, Belle II TOP counter 5/12
 Time distribution time (25")
Accumulated data: Ndet photon , Time distribution Ring image (accumulated) Time distribution time (25 ps/bin) Mean of time fluctuation (σ) for all channels 95± 11 ps (92± 11 ps MC) σof gaussian PMTch Number of detected photon in an event Data Mean: 8. 2 ± 0. 1 MC simulation Mean: 7. 7 ± 0. 1 time (25 ps/bin) □Time fluctuation 95 ps± 11 ps ➣consistent with MC simulation □Mean of detected photon is 8. 2 ➣The shape is understood by MC simulation A part of TOP counter well understood. ⇒Analyze performance event-by-event. Number of detected photon 6/12

Procedure of likelihood analysis □Ring image reconstruction by likelihood method 10 -4 Procedure of analysis PDF of time dist. P(tdc, ch) 1. Make table of Probability Density Function (PDF) from MC simulation. Input parameter : x, z, θ, Φ, t 0, β 2. Calculate the log Likelihood using PDF. time(25 ps/bin) ln. L Example of likelihood scan 0. 99 1 IEEE NSS - 31 Oct 2012 1. 01 N:number of detected photon Ring Image has high sensitivity to all input parameters. 1. Likelihood scan to align parameters(x, y, θ, Φ , t 0) with fixing β=1. 0. β 2. Evaluate β by likelihood analysis. 7/12 Y. Arita, Belle II TOP counter

Alignment of incident condition by likelihood analysis Resolution from measurement :~10 mm Detected time of photon(ch=0) Incident particle ln. L(all channel) z θ θ scan ※assume β=1 2 mrad time(25 ps/count) θ=1. 0615 rad 1. 052 ln. L(all channel) Before alignment 1. 062 Z scan θ(rad) After alignment 5 mm Z=704 mm 680 700 IEEE NSS - 31 Oct 2012 z(mm) Y. Arita, Belle II TOP counter time(25 ps/count) 8/12

Obtain the beta by likelihood analysis. ➣Event-by-event using ~0. 24 M event tracks. ln. L β and its resolution by likelihood analysis Comparing Data/MC(β=1) with same fitting procedure. (PDF made from MC simulation) As a result of data, β is 1. 0. σβ ( β resolution ) is 2. 17 x 10 -3. ⇒We can reconstruct ring image from data. Data MC β = 1. 0005± 10 -5 β = 1. 0000± 10 -5 σβ(Beta resolution ) = (2. 17± 0. 01)× 10 -3 = (2. 10± 0. 01)× 10 -3 IEEE NSS - 31 Oct 2012 β 3% differences from data. ⇒discuss in next slide. β Y. Arita, Belle II TOP counter β 9/12
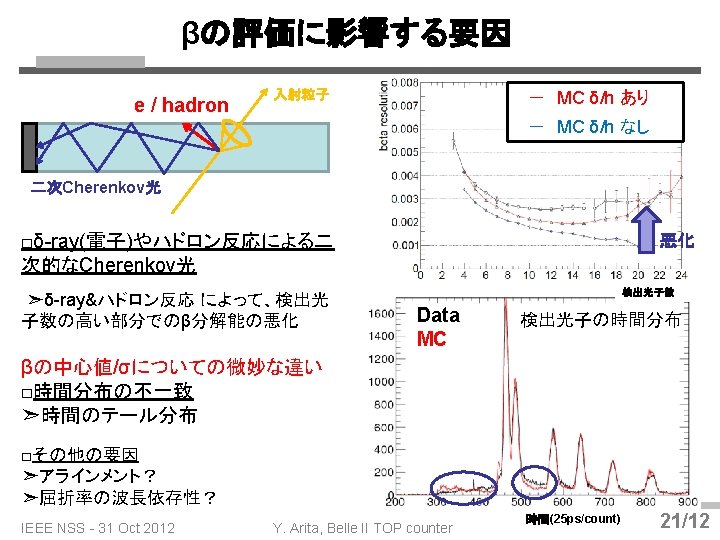
 ― MC(32 ch) -")
Number of photons – β resolution relation ― Data(32 ch) ― MC(32 ch) - - - MC(60 ch) full PMT > All of 90% events for 32 ch In higher counts region, σβ become worse. It come from Cherenkov photons from secondary particle (δ-ray and hadrons). MC can explain relation well. But, there is a small differences between data and MC yet. ⇒Need to tune MC simulation. Mean of detected photons(60 ch) Number of photons Data / MC IEEE NSS - 31 Oct 2012 Break colored line is MC for full TOP counter(60 ch). MC for full TOP can be extrapolated by 36 ch Data/MC. ⇒We want to confirm real performance of full TOP counter in next works. Y. Arita, Belle II TOP counter 10/12

Evaluation of likelihood ratio In actual PID, we perform likelihood ratio analysis. In actual PID at Belle II, we have incident information (x, z, θ, Φ, t 0) and momentum of particles as input parameter. We estimate the beta by particle(mass) assumption. ⇒ Calculate log likelihood for all assuming particles. ln. L calculated by PDF(β=1. 0) and PDF(β=0. 9867 : assumed 3 Ge. V/c K). Actually, We just have to compare log likelihood for each assumed particles. Data / MC Incident particle β = 1. 0 An example of Likelihood ratio analysis. Good consistency between Data/MC. ⇒We understand actual PID power! IEEE NSS - 31 Oct 2012 Y. Arita, Belle II TOP counter Δln. L= ln. L(β=1. 0) – ln. L(β=0. 9867) 11/12
 counter for particle identification in barrel region.")
Summary □Belle II utilizes Time Of Propagation(TOP) counter for particle identification in barrel region. □We evaluate the performance of TOP counter prototype using 120 Ge. V/c π beam. This is for confirmation of Ring Image reconstruction and understanding of real Data by our MC simulation. □Using Likelihood analysis, - Alignment for incident condition(x, z, θ, Φ, t 0) of beam. - Evaluate velocity (beta) and its resolution. - Evaluate likelihood ratio between β=1. 0 and β=0. 9867. ⇒ All are in good agreement with MC expectation. We could reconstruct ring image well. We understand the real Data of TOP counter by MC simulation. IEEE NSS - 31 Oct 2012 Y. Arita, Belle II TOP counter 12/12

Backup IEEE NSS - 31 Oct 2012 Y. Arita, Belle II TOP counter 13/12
 Time-Of-Flight(TOF) counter IEEE")
Upgrade Belle/Belle II barrel PID 1. 154 m Aerogel Cherenkov counter(ACC) Time-Of-Flight(TOF) counter IEEE NSS - 31 Oct 2012 Y. Arita, Belle II TOP counter Original Belle 1. 5 T Belle II upgrade Update Barrel PID: Time Of Propagation counter 14/12

x Φ MWPC z θ y MWPC 60° Trigger counter IEEE NSS - 31 Oct 2012 TOP counter prototype Y. Arita, Belle II TOP counter Trigger counter Timing counters π Beam 15/12
 36 ch→ 60 ch IEEE NSS - 31 Oct 2012 Y.")
β (MC expectation) 36 ch→ 60 ch IEEE NSS - 31 Oct 2012 Y. Arita, Belle II TOP counter 16/12

ln. L scan in an event Maximum ln. L 1 ln. L 2 β=0. 9867 IEEE NSS - 31 Oct 2012 β=1. 0 β Y. Arita, Belle II TOP counter 17/12

ln. L scan in an event Maximum ln. L 1 ln. L 2 β=0. 9867 IEEE NSS - 31 Oct 2012 β=1. 0 β Y. Arita, Belle II TOP counter 18/12

Evaluation of likelihood ratio In actual PID, we perform likelihood ratio analysis. Evaluate Δln. L between β=1(120 Ge. V/c π) and β=0. 9867(assumed 3 Ge. V/c K), event-by-event. Example of ln. L scan for an event Likelihood ratio for K(3 Ge. V/c) and π(120 Ge. V/c) Data/MC Δln. L= ln. L(β=1. 0) – ln. L(β=0. 9867) We understand actual likelihood analysis. IEEE NSS - 31 Oct 2012 Y. Arita, Belle II TOP counter 19/12
. ⇒ Extrapolate")
Nhit dependence of Beta resolution □Evaluates beta resolution for any Nhit(detected photon). ⇒ Extrapolate discussion to performance of full scale TOP counter. IEEE NSS - 31 Oct 2012 Nhit=1 Nhit=2 Nhit=3 Nhit=4 Nhit=5 Nhit=6 Nhit=7 Nhit=8 Nhit=9 Y. Arita, Belle II TOP counter 20/12

TOFを入れる Data w/ TOF β = 1. 0004 σβ=2. 0651× 10 -3 MC w/ TOF β = 1. 00018 σβ=1. 962× 10 -3

Evaluation of likelihood ratio In actual PID, we perform likelihood ratio analysis. Evaluated Beta for beam test data Data/MC β=0. 9867 No long tail. β=1. 0 Evaluate Δln. L between β=1(120 Ge. V/c π) and β=0. 9867(assumed 3 Ge. V/c K), event-by-event. IEEE NSS - 31 Oct 2012 Δln. L= ln. L(β=1. 0) – ln. L(β=0. 9867) Y. Arita, Belle II TOP counter 23/12
 --- MC(60 ch) full TOP IEEE NSS - 31")
- Data - MC(36 ch) --- MC(60 ch) full TOP IEEE NSS - 31 Oct 2012 Y. Arita, Belle II TOP counter 24/12
 IEEE NSS - 31")
Data 閾値 β=0. 9934 (0. 9868 – 1 の 半分) IEEE NSS - 31 Oct 2012 MC(36 ch) MC(60 ch) full TOP Y. Arita, Belle II TOP counter 25/12
 MC(60 ch) full TOP 20. 2% IEEE NSS - 31")
Δln. Lについて MC(36 ch) MC(60 ch) full TOP 20. 2% IEEE NSS - 31 Oct 2012 Y. Arita, Belle II TOP counter 10. 0% 26/12

Δln. LのレートのNhit依存性 IEEE NSS - 31 Oct 2012 Y. Arita, Belle II TOP counter 27/12

ln. L 1 -ln. L 2 Δln. Lと収束するβの関係 36670 β=0. 9868 β=0. 9934 150306 35922 IEEE NSS - 31 Oct 2012 Data 14650 Y. Arita, Belle II TOP counter β 28/12

IEEE NSS - 31 Oct 2012 Y. Arita, Belle II TOP counter 29/12
- Slides: 29