Lifecycle Deficit Consumption Labor Income Gretchen Donehower Generational
 Gretchen Donehower Generational Wealth Accounts Workshop University of")
Lifecycle Deficit (Consumption & Labor Income) Gretchen Donehower Generational Wealth Accounts Workshop University of Georgia Athens, Georgia Wednesday, January 31, 2018

Most of this presentation copied from old slides of Sang-Hyop Lee, University of Hawaii at Manoa, so thank you, Sang. Hyop! 2
 3")
The Economic Lifecycle (per capita) 3

Private Consumption • Standard approach of allocating household consumption among the members did not provide reasonable results – Engel method: food share is used to measure households’ well-being – Rothbarth method: welfare measured by expenditure on adult goods per adult • Alternative method (NTA) – Estimate education and health consumption directly with utilization measures, and administrative data – Estimate private capital consumption (rental value of owner occupied housing + flow of services from durables) • Well… we would like to have flow of services of durables, but in practice many countries do not have sufficient data to calculate this as a separate age profile, so it gets mixed in with “other” – Allocate other consumption indirectly (using Equivalence Scale) 4

Allocating Private Education Consumption • Private education consumption is regressed on the number of enrolled (E) and non-enrolled (NE) in each age group. • The age groups included will vary with the country and its enrollment rates. • Use unsmoothed profile. 5

Allocating Private Health Care Consumption • Often very complex in part due to various source of financing, which includes – Private out-of-pocket expense – Private insurance – Public sector • Available sources of data vary across countries. • National Health Accounts (NHA) can be helpful, but there are differences between NHA and NTA – E. g. NHA document expenditures rather than consumption. Thus it includes profits of insurance companies. • Estimate using one of four approaches. 6

Approach 1: Method based on individual utilization measures from expenditure survey data • Private health consumption is regressed on the number of members using inpatient services (IN) and outpatient services (OUT) in each age group. 7

Approach 2: Based on age profile of per capita utilization measures • Private health consumption is regressed on the number of members (M) and per capita utilization measure by age (U) • Could be linear (the former) or non-linear (the latter) 8

Approach 3: Based on non-parametric iterative method • Assign health expenditure equally to each household member and then tabulate the per capita profile. • The per capita profile is then used as weights to allocate health expenditure to household members producing a new per capita profile. • Repeat until the weights do not change much. • Unlike regression approach, it does not produce negative coefficients for some age groups.

Estimated C after iteration Age True C 1 2 3 4 5 6 5 10 14. 44 11. 90 10. 83 10. 36 10. 16 10. 07 35 30 25. 00 27. 42 28. 74 29. 40 29. 72 29. 87 65 20 22. 22 21. 54 20. 85 20. 43 20. 21 20. 10 HH No Id No Age HH C 1 2 3 4 5 6 1 1 5 70 23. 33 15. 69 12. 48 11. 09 10. 49 10. 22 1 2 35 70 23. 33 27. 16 28. 76 29. 45 29. 76 29. 89 1 3 35 70 23. 33 27. 16 28. 76 29. 45 29. 76 29. 89 2 1 35 80 26. 67 27. 69 28. 72 29. 35 29. 69 29. 85 2 2 35 80 26. 67 27. 69 28. 72 29. 35 29. 69 29. 85 2 3 65 80 26. 67 24. 62 22. 56 21. 30 20. 63 20. 30 3 1 65 40 20 20. 00 3 2 65 40 20 20. 00 4 1 5 20 10 10. 00 4 2 5 20 10 10. 00 10

Approach 4: Based on simple regression • Private health consumption is regressed on the number of household members (M). • Could have negative coefficients—replace with zero. • The least recommended approach.

Estimating Other Household Consumption • Assumed to be proportional to an equivalence scale that is equal to 1 for adults aged twenty or older, declines linearly from age 20 to 0. 4 at age 4, and is constant at 0. 4 for those age 4 or younger. 12

Public Consumption • Allocated based on administrative records, and in some cases, survey data. • Public education consumption – Formal education consumption: estimate by calculating unit cost per student per level. – Informal education consumption: estimate by dividing total public informal education consumption by total population by age. • Public health care consumption – Health care purchased by individuals and reimbursed through public programs: captured in household surveys. – Health care provided directly to individuals by government clinics: allocate using administrative records. – Collective health services: allocate on a per capita basis. • Other public consumption: equally to all members
 More on education")
Consumption Profiles: Industrialized vs. Developing Countries. More on elderly (health care) More on education

Estimating Labor Income Labor income includes – The compensation of employees. Wages and salaries. Fringe benefits. Deferred payments – Labor’s estimated share of mixed income (self-employment income) • Does not include in-home activities which does not produce market goods or services (e. g. childrearing) • – We’ll talk about that tomorrow with National Time Transfer Accounts

Imputing Labor Income for Unpaid Family Workers • Estimate using the age profile of earnings of employees as a share to allocate household selfemployment income to self-employed workers including unpaid family workers. – Example: Two-third of this household’s self-employment income equals 30. Then, Age Earnings per employee Imputed 18 (unpaid) 200 10 44 (self emp. ) 400 20 16
")
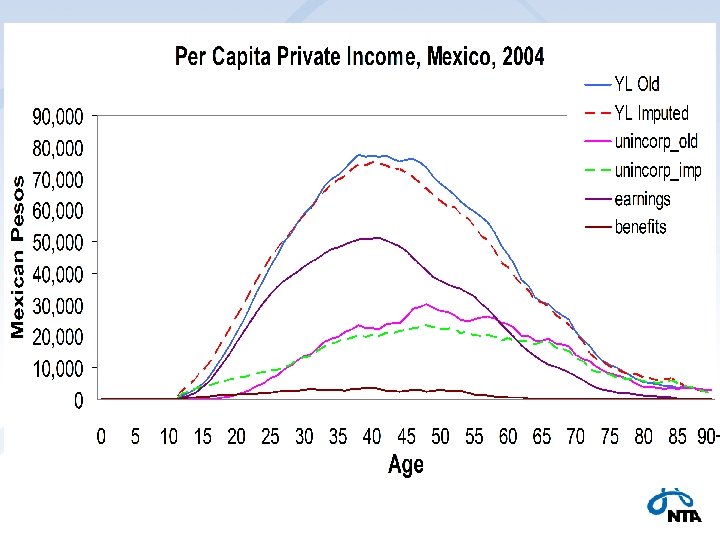
Primary Target: Countries with Large Share of Self-Employment Income (per capita)

Secondary Target: Countries with Moderate Share of Self-Employment Income
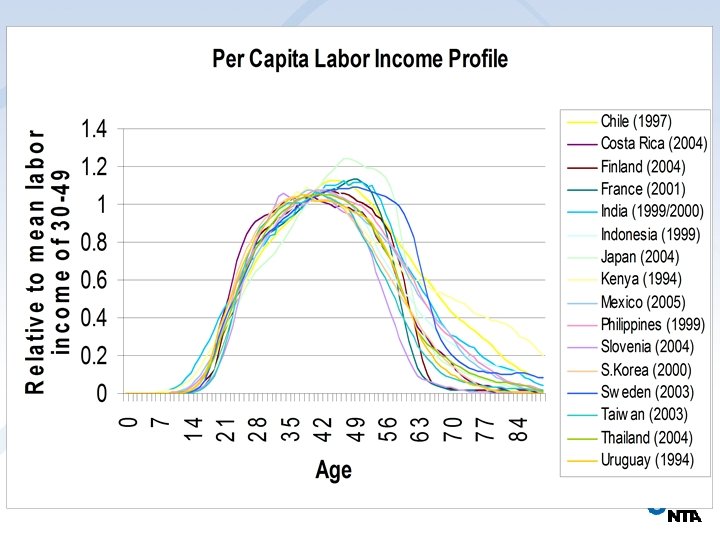

Labor Income: Industrialized vs. Developing Countries. Higher Yl in the 50 -59 age group

Aggregate Controls • Adjust the aggregate profile and the per capita profile to match a control total taken from NIPA or some other source. – Private consumption: household final consumption expenditure + non-profit institutions serving households’ (NPISHs) final consumption expenditure – Public consumption: general government final consumption expenditure – Earnings + fringe benefits: compensation of employees. NIPA excludes compensation received by non-resident and remittances (on-going discussion) – Labor portion of self-employment income: mixed income of household sector

Details of Aggregate Controls • In NIPA, prices are market prices; in NTA, prices are basic prices net of indirect taxes • In NIPA, private health consumption reimbursed through public health insurance programs (Medicare, NHI) are private health consumption; in NTA it is reclassified as public consumption. • In NIPA, non-housing consumer durable consumption is measured by expenditure; in NTA, consumption of it is the flow of services – This is mostly theoretical, though, as most countries do not have the data to estimate this completely

Lab exercise • Work through calculating a few age profiles – Example is using old US data (sorry!) – You can use the provided example data, or try to use your own and modify the code as necessary
- Slides: 24