Life Table Outline What is a life table

Life Table

Outline: • • What is a life table What does a life table look like Calculations in a life table Life expectancy

• A life table is a table which shows, for a person at each age, what the probability is that they die before their next birthday • A number of statistics can be derived and be included in the table as: q. The probability of surviving any particular year of age.

q. The remaining life expectancy for people at different ages q. The proportion of the original birth cohort still alive q. Life tables are also used in biology

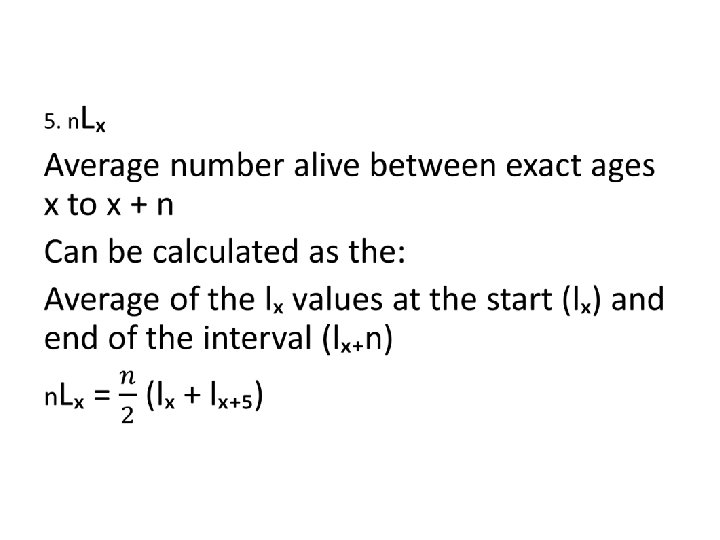
Average number alive between age interval

What does a life table look like?

First four columns of the life table: • Life table variables : 1. Age interval (e. g. 1 year, 1 -4 years, etc. ) 2. ( nqₓ ) the percent of dying between ages x and age x+n 3. ( lₓ) Number of alive at an exact age x 4. n dₓ Number of deaths between ages x and x+n

How to calculate ndₓ : • How to calculate number of deaths ndₓ between exact ages x to x+n • This is column 4 • We multiply column 2 by column 3 to obtain column 4, that is:
 = nqₓ (Column 2) x lₓ (Column 3) This is multiplying:")
( column 4) = nqₓ (Column 2) x lₓ (Column 3) This is multiplying: (lₓ), number alive at the start of age interval by The proportion of dying in that interval (nqₓ )

Example: How to calculate ndₓ Ages Column 2 Column 3 Column 4 X to X + n nqₓ Iₓ ndₓ 5 -9. 00877 92734 813 ₅q₅ I₅ . 00877 x 92, 734 = ₅d₅ 813 Column 5 n. Lₓ 461637
 x (nqₓ ) nd₅ =( l₅ ) x (₅q₅")
Example: = ( Iₓ ) x (nqₓ ) nd₅ =( l₅ ) x (₅q₅ ) I₅ = 92, 734 ₅q₅ =. 00877 ₅d₅ =. 00877 x 92, 734 = 813 ndₓ

• The number dying in an age interval can also be expressed as the difference between two adjacent lₓ values. That is: ndₓ = lₓ - lₓ₊₅ ₅d₅ = l₅ - l₁₀

Ages Column 2 X to X + n nqₓ 5 -9. 00877 10 - 14. 00604 l₅= 92, 734 Column 3 Column 4 lₓ ndₓ 92734 813 91921 555 Column 5 n. Lₓ 461637 458217 l₁₀ = 91, 921 ₅d₅ = l₅ - l₁₀ = 92, 734 - 91, 921 = 813

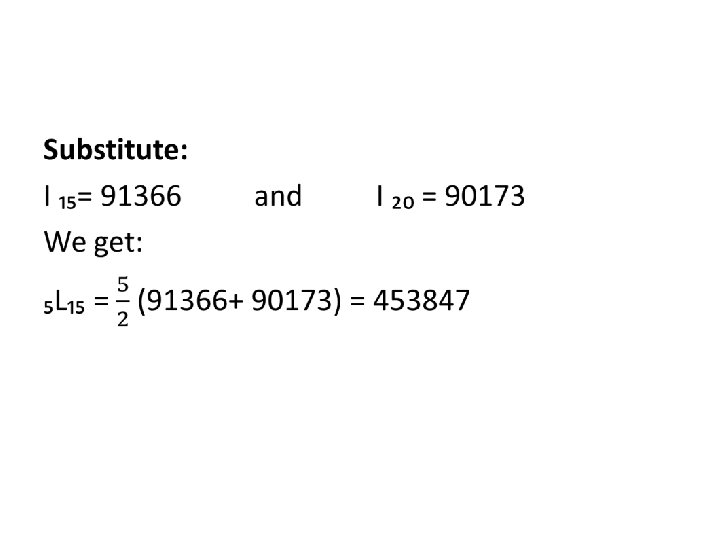
Ages Column 2 X to X + n nqₓ 15 -19. 01306 20 -24. 03161 I ₁₅= 91366 Column 3 Column 4 lₓ ndₓ 91366 1193 90173 2851 Column 5 n. Lₓ 453847 443736 I ₂₀ = 90173 ₅d₁₅ = I₁₅ - I ₂₀ = 91366 - 90173 = 1193

Ages X to X + n 10 -14 15 -19 20 -24 Column 2 nqₓ 0. 00604. 01306. 03161 l₁₅= 91366 Column 3 Iₓ 91921 91366 90173 Column 4 ndₓ 555 1193 2851 l₂₀ = 90173 Column 5 n. Lₓ 458217 453847 443736
 • Obtained from the n. Lₓ values.")
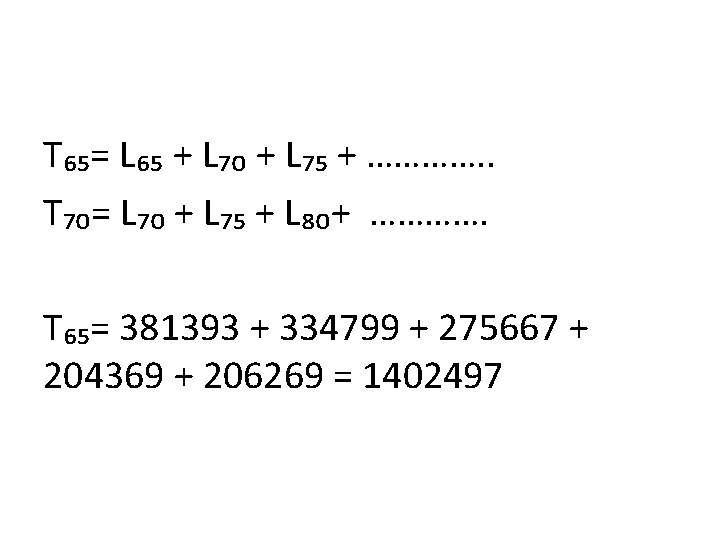
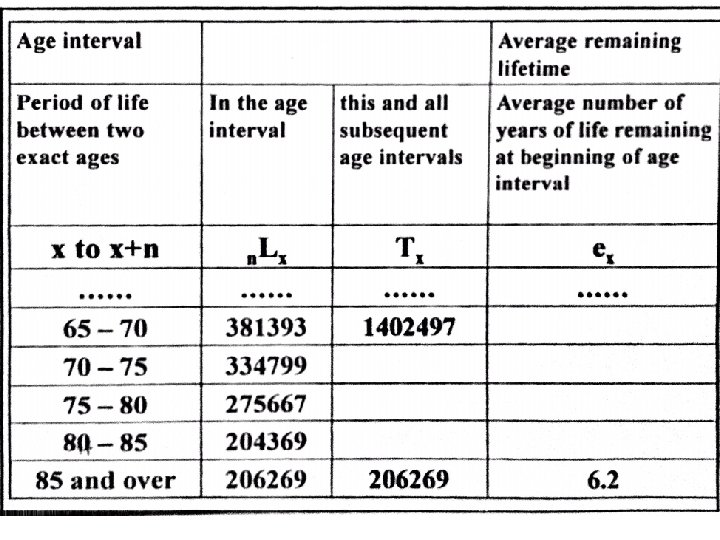
Total population aged x and over (Tₓ) • Obtained from the n. Lₓ values. • Defined as the total population aged x years and over.

What is L₀? We noted that of those who die aged 0, the average at death is usually much less than 6 months. A better approximation to reality, but still simple, for the first year of life is: L₀=. 3 l₀ +. 7 I₁ i. e. L₀= I₁ +. 3 ( I₀ - I₁) Note that this counts 0. 3 of a year for each child that dies aged 0.

What is life expectancy? • Life expectancy at birth in KSA is now 76. 3 years. • This means that a baby born now will live 76. 3 years if the baby experiences the same agespecific mortality rates as are currently operating in KSA
 • The life table function eₓ refers")
How to calculate life expectancy ( eₓ) • The life table function eₓ refers to life expectancy from an exact age x. • For example, e₃₀ is the life expectancy at exact age 30, or the average number of years lived from the 30 th birthday

Equation for eₓ= • Total person-years of life lived after exact age x ( Tₓ) Divided by the total persons alive at the exact age x ( lₓ) • This represents the number if years lived by people aged x: eₓ= Tₓ / Lₓ

Ages Column 2 Column 3 Column 4 X to X + n Tₓ Iₓ eₓ 60 -64 65 -69 70 -74 90547 86208 79646 I₆₅= 86208 1989624 1547738 1133102 21. 97 17. 95 14. 23 T₆₅= 1547738 e₆₅= 1547738 / 86208 = 17. 95

Example 1: • Find e₆₅ the life expectancy at the exact age 65: e₆₅ = T₆₅ / I ₆₅ e₆₅= 1547738 / 86208 = 17. 95

Ages Column 2 Column 3 Column 4 X to X + n Tₓ Iₓ eₓ 60 -64 65 -69 70 -74 90547 86208 79646 I₇₀= 79646 1989624 1547738 1133102 21. 97 17. 95 14. 23 T₇₀=1133102 e₇₀= 1133102 / 79646 = 14. 23

Example: • Find e₇₀ the life expectancy at the exact age 70: e ₇₀ = T ₇₀ / I ₇₀ e₇₀= 1133102 / 79646 = 14. 23
- Slides: 28