Life Science Software and High Performance Computing Seminar


, designed with biologically-oriented users")

 Cross-sectional view about halfway through")
 Time course of 3*-")
")


")


 parallel")


- Slides: 44
Life Science Software and High Performance Computing Seminar Series Part III Craig A. Stewart Fulbright Senior Scholar beim ZIH Associate Vice President, Research & Academic Computing
License Terms • • Please cite this presentation as: Stewart, C. A. Life Science Software and High Performance Computing: Seminar Series Part III. 2006. Presentation. Presented at: Technische Universitaet Dresden (Dresden, Germany, 25 Apr 2006). Available from: http: //hdl. handle. net/2022/14767 Portions of this document that originated from sources outside IU are shown here and used by permission or under licenses indicated within this document. Items indicated with a © are under copyright and used here with permission. Such items may not be reused without permission from the holder of copyright except where license terms noted on a slide permit reuse. Except where otherwise noted, the contents of this presentation are copyright 2007 by the Trustees of Indiana University. This content is released under the Creative Commons Attribution 3. 0 Unported license (http: //creativecommons. org/licenses/by/3. 0/). This license includes the following terms: You are free to share – to copy, distribute and transmit the work and to remix – to adapt the work under the following conditions: attribution – you must attribute the work in the manner specified by the author or licensor (but not in any way that suggests that they endorse you or your use of the work). For any reuse or distribution, you must make clear to others the license terms of this work.
Life Science Software and HPC Seminar Plan as of today • Today (April 25, 9 am): – Systems biology – Portals, interfaces, workbenches, grids • Thursday (April 27, 8 am): – Some thoughts and observations on US national projects and centers – Performance analysis and tuning for life science applications: Dotter, BLAST, maybe Gene. Index
Systems Biology • • • Special issue of Science: 295, Mar. 2002 Special issue of Nature: 420, Nov. 2002 “Systems biology is a new field in biology that aims at a systems-level understanding of biological systems. ” Nobody’s quite sure what it is, but it sure is hot! At least it does not end http: //www. ornl. gov/Tech. Resources/Human_Genome/ graphics/slides/images/01 -0052_web. gif in -omics
Historical approach to biological experiments • From Lazebnik, Y. 2002. Cancer cell 2: 179: Traditional biological experimentation much like the process of trying to fix a broken radio. – Some typical steps: – Cataloguing components and their attributes – Perturbing the system – Knock-out experiments – Drawing diagrams – Eventually may find a component that, when replaced, repairs the radio • In a very complex system, knowing what all of the parts are, and knowing the function of individual pathways, may still not tell you how the systems work. It may simply be impossible to deduce this from 1 st order interactions – Power supply and other components (well-known PC repair example!) – Change everything all at once so that we’ll never know what worked!
Systems Biology • Systems biology emphasizes close integration of experiment, theory and computational modeling • Goal: understanding the structure and dynamics of biological systems, placing the parts in the context of the dynamic whole – Studies the complex interactions of many levels of biological information – Quantitative, predictive models are central – Computational modeling in particular is a key tool • Why model – You are forced to really state what you are hypothesizing – Allows you to understand an *approximation* of reality in great detail – Allows you to understand things you would otherwise not be able to determine experimentally!
From http: //www. nrcam. uchc. edu/technology/modeling_process. html
Use cases • • • “In silico” modeling (In vivo - research with whole organism; in vitro research - performed on smaller units, often in text tubes) Theory-based biology – (are things like cell theory, genetic theory, theory of evolution, theory of natural selection really theories? ) – Prediction is much different than postdiction – Cell. ML example to come – Heart attack modeling to come Medical issues – Drug discovery – Toxicity testing – Tumor treatment – Personalized medicine
A small sampling • • • BALSA BASIS BIOCHAM Bio. Charon biocyc 2 SBML Bio. Grid Bio. Net. Gen Bio. Pathways Explorer Bio Sketch Pad Bio. SPICE Dashboard Bio. Spreadsheet Bio. UML • • • • Cellware Cytoscape DBsolve Dizzy E-CELL Flux. Analyzer Gepasi INSILICO discovery Jarnac JDesigner JSIM JWS Karyote
Example - MCell • MCell is: A General Monte Carlo Simulator of Cellular Microphysiology. http: //www. mcell. cnl. salk. edu/ • MCell focuses on simulations using a Brownian dynamics random walk algorithm. • MCell's use to date has been focused on the microphysiology of synaptic transmission. • Images and MCell-related material courtesy of Joel R. Stiles, Pittsburgh Supercomputing. Center and Carnegie Mellon University, and Thomas M. Bartol, Computational Neurobiology Laboratory, The Salk Institute. http: //www. mcell. cnl. salk. edu/
MCell Scalability Images and MCell-related material courtesy of Joel R. Stiles, Pittsburgh Supercomputing Center and Carnegie Mellon University, and Thomas M. Bartol, Computational Neurobiology Laboratory, The Salk Institute. http: //www. mcell. cnl. salk. edu/
M-Cell • • • Uses MDL (Model Description Language (MDL), designed with biologically-oriented users in mind. Embarrassingly parallel Monte Carlo application Supports checkpointing! Images and MCell-related material courtesy of Joel R. Stiles, Pittsburgh Supercomputing Center and Carnegie Mellon University, and Thomas M. Bartol, Computational Neurobiology Laboratory, The Salk Institute. http: //www. mcell. cnl. salk. edu/
Real predictive work in systems biology! • • J. S. Coggan, T. M. Bartol, E. Esquenazi, J. R. Stiles, S. Lamont, M. E. Martone, D. K. Berg, M. H. Ellisman, T. J. Sejnowski, Evidence for ectopic neurotransmission at a neuronal synapse. Science 309, 446 -451 (2005). “In a multiparameter, multidimensional system, building a quantitative and detailed model can be a helpful adjunct to experimental studies in exploring parameter space. Coggan et al. (see the Perspective by Lucic and Baumeister) have taken a step toward describing dynamic events at a neuronal synapse by reconstructing the architecture of the pre- and postsynaptic membranes and underlying cytoplasmic vesicles and incorporating kinetic measurements of neurotransmitter receptor properties, as well as other physical and chemical parameters of neurotransmitters. At this simulated synapse, the known electrophysiology of transmitter release could not be explained by vesicle fusion only at the active zone, the classical region of membrane apposition between the pre- and postsynaptic neurons. Instead, the modeled electrophysiology fits better to observations if ectopic release by vesicle fusion outside active zones is included. “
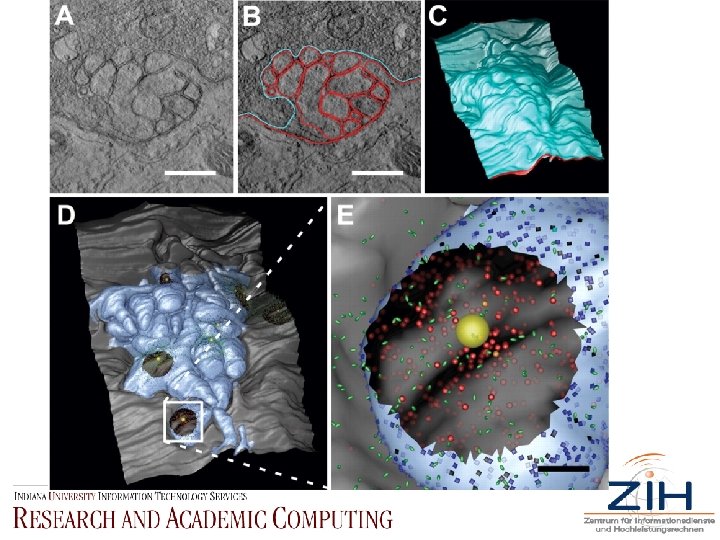
• Fig. 1. 3 D model reconstruction. (A) Cross-sectional view about halfway through the middle of an E 15 chick CG acquired with serial EM tomography and visualization software Analyze. AVW. Several somatic spine cross sections are seen, along with vesicles packed in the presynaptic calyx. (B) Same panel as in (A), with presynaptic and postsynaptic membranes traced in cyan and red, respectively, using Xvoxtrace. Scale bar, 0. 5 µm. (C) Serial section reconstruction after the surface is reconstructed with the marching cubes algorithm. The presynaptic membrane (cyan) overlies the postsynaptic membrane (red). (D) Viewed with DRe. AMM, the MCell compatible model, complete with all previously reported PSDs (shown as black circular regions) (4). Postsynaptic spine mat membrane is light blue; somatic membrane is gray. Area within white box is enlarged in next panel. (E) Close-up view of MCell compatible model. Yellow sphere represents synaptic vesicle. Green ovoids represent ACh molecules. Translucent blue squares and red circles represent 7 - and 3*n. ACh. Rs, respectively. Opacity of n. ACh. R color corresponds to level of receptor activation (fully opaque = open channel) 200 µs after ACh release. Scale bar, 0. 1 µm.
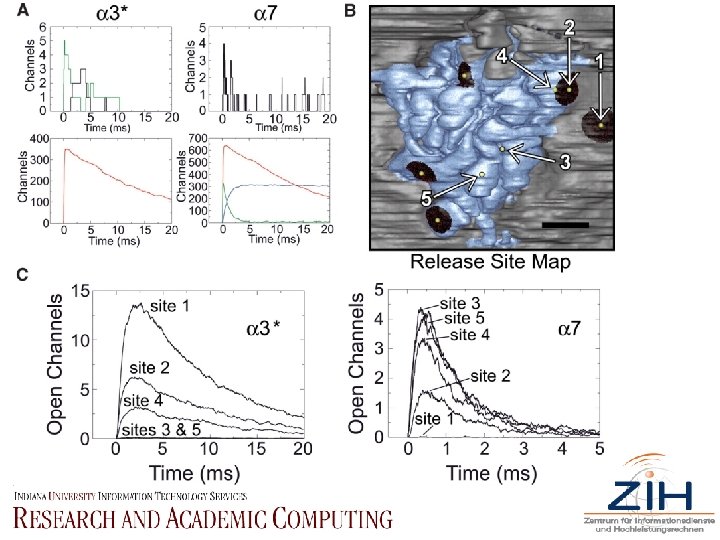
• Fig. 2. MCell output and location effects. (A) Time course of 3*- and 7 -n. ACh. R channel states after release of a single quantum. Green, double-bound closed (C 2); black, doublebound open (O); red, single-bound (C 1); blue, desensitized (C 3, 7 -n. ACh. Rs only). See (26) and fig. S 2 for mechanisms and states. Scaling differences require presentation in two panels per receptor type (top and bottom). (B) Site map of selected release sites representing the greatest range of n. ACh. R distributions. Vesicles are released at numbered yellow spheres indicated with white arrows; PSDs indicated by black-shaded patches; spine membrane, blue; somatic membrane, gray. Scale bar, 0. 5 µm. (C) O-state responses (mean of 100 trials) from five sites in (B).
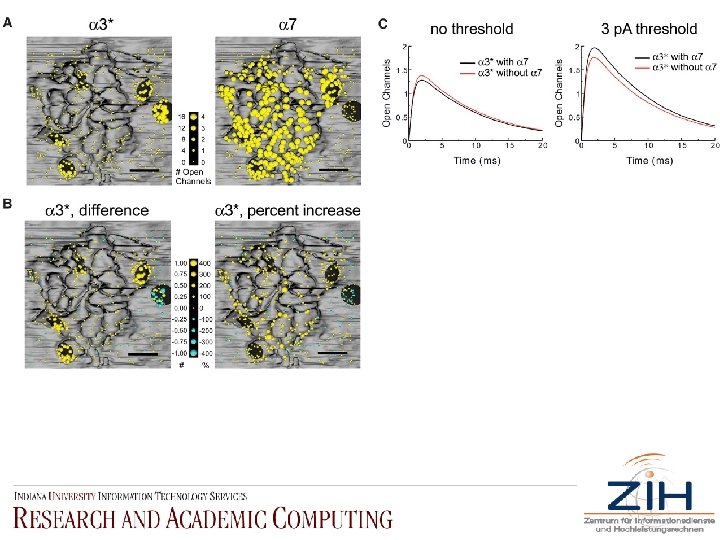
• Fig. 5. Spatial mapping of m. EPSCs and functional microdomain effects. (A) 550 vesicle sites with equal probability of release simulate a population of m. EPSCs. Mean response (100 trials each) was mapped by the corresponding release location on the postsynaptic surface; vesicle radii (yellow spheres) are scaled to the open channel amplitude of the m. EPSC. The maps are segregated for each type of n. ACh. R ( 3*-left, 7 -right). (B) Maps of the difference in 3*-n. ACh. R m. EPSC amplitudes with and without 7 -n. ACh. Rs (left panel), and the percent change in 3*-n. ACh. R m. EPSC amplitude without 7 -n. ACh. Rs (right panel). Yellow, positive changes; cyan, negative changes. (C) Mean 3*-n. ACh. R m. EPSC responses in the presence (black trace) and absence (red trace) of 7 -n. ACh. Rs before (left) and after (right) a 3 -p. A detection threshold (right).
Compu. Cell • • • Compu. Cell currently uses a combination of "extended Potts model" for cell sorting and clustering, and "Schnakenberg Reaction Diffusion" equations to establish the underlying chemical field to which cells respond and form typical patterns found in such biological systems as a growing chicken limb. Best intro: http: //biocomplexity. indiana. edu/jglazier/courses/p 548/files/compucell 3 d_quickstartguide_0. 5. pdf Alsoc: “A Framework for Three-Dimensional Simulation of Morphogenesis, ” Trevor M. Cickovski, Chengbang Huang, Rajiv Chaturvedi, Tilmann Glimm, H. George E. Hentschel, Mark S. Alber, James A. Glazier, Stuart A. Newman, and Jesús A. Izaguirre, IEEE/ACM Transactions on Computational Biology and Bioinformatics 2, 1 -16 (2005). Image courtesy of James Glazier www. biocomplexity. indiana. edu/ software. php
Physiome project • Peter Hunter – www. physiome. org • Markup languages – Cell. ML, Field. ML • Field-oriented modeling – Heart, Lungs, Kidney
Cell. ML • Originally designed to describe and exchange models of cellular and subcellular processes. • http: //www. cellml. org/public/about/what_is_cellml. html • XML-based specification of interchange of cell model information • Project of Bioengineering Institute of University of Auckland with support from Physiome Sciences Inc. • Closely related to Field. ML - can be used to describe spatially and temporally varying field information. It is appropriate for storing geometry information and spatial distribution of parameters inside compartments in Cell. ML, or the spatial distribution of cellular model parameters across an entire organ.
Visualization: Sci. RUN • Some of the most dramatic biological visualizations ever done • Has been used for surgical support • Scientific Computing and Imaging Institute – Christopher R. Johnson • http: //www. sci. utah. edu/
Issue: Getting Tools to Interoperate • There is currently a proliferation of software, but no single package answers all needs • No single tool is likely to do so in the near future • But: problems with using multiple packages • Among the efforts to address this problem: – Systems Biology Markup Language & Systems Biology Workbench Project • Purpose: develop software and standards to – Enable sharing of simulation & analysis software – Enable sharing of models • Goal: make it easier to share than to reimplement
Components of a Level 1 or 2 model • Compartment: a well-stirred container (!) • Species: chemical compounds • Reaction: transformation, transport, or binding process involving a species. May have a rate parameter • Parameter: a quantity that has a symbolic name (global and local) • Unit definition • Rule: added to set constraints, initial conditions, bounds, etc on the reactions. • Everything in SBML is one of the above!
More on SBML Level 3 proposed development areas • Model Composition - extensions to define an SBML model as a composition of submodels • Diagrams - extensions to include display and layout information in an SBML model • Complexes - species with multiple states, like phosphorylated/not-phosphorylated • Alternative Reactions - extensions to allow multiple formalisms for describing reactions, such as stochastic and deterministic • Controlled Vocabularies - vocabularies for labeling models and their components • Dynamic Structures - extensions to allow model structures to vary during simulation • Spatial Features - extensions to represent 2 D and 3 D spatial characteristics of models and their components • From www. sbml. org
What does an SBML model look like? <? xml version="1. 0" encoding="UTF-8" ? > - <sbml xmlns="http: //www. sbml. org/sbml/level 1" version="2" level="1" xmlns: celldesigner="http: //www. sbml. org/2001/ns/celldesigner"> - <model name="ban 00010"> - <annotation> <celldesigner: model. Version>2. 2</celldesigner: model. Version> <celldesigner: model. Display size. X="876" size. Y="1177" /> - <celldesigner: list. Of. Compartment. Aliases> - <celldesigner: compartment. Alias id="ca 1" compartment="u. Vol"> <celldesigner: class>SQUARE</celldesigner: class> <celldesigner: bounds x="10. 0" y="10. 0" w="856" h="1157" /> </celldesigner: compartment. Alias> </celldesigner: list. Of. Compartment. Aliases> - <celldesigner: list. Of. Species. Aliases> -
So you actually want to run one… • MANY programs will handle a model written in SBML • lib. SBML provides a C/C++ API if you want to write your own • Math SBML – an open source toolbox for running SBML models within Mathematica • SBML Toolbox – the equivalent for Mat. Lab • While an open source toolkit for a proprietary software package seems odd at first blush… • There is a KEGG to SBML converter!
JWS Online From http: //jjj. biochem. sun. ac. za/
The Systems Biology Workbench Project • http: //www. sbw-sbml. org/ • Simple framework for application interaction. • Cross-platform compatible & language-neutral Visual Editor • Modules are separately compiled Stochastic executables. A module defines Simulator services which have methods • SBW native-language libraries provide APIs. • SBW Broker acts as coordinator Script Interpreter Database Interface SBW ODE-based Simulator
Biomodels. net • • • The Next Step After Standard Formats For computational modeling to become more widely used in biological research, researchers must be able to exchange and share their results. The development and broad acceptance of common model representation formats such as SBML is a crucial step in that direction, allowing researchers to exchange and build upon each other’s work with greater ease and accuracy. The Bio. Models. net project is another step: an international effort to (1) define agreed-upon standards for model curation, (2) define agreed-upon vocabularies for annotating models with connections to biological data resources, and (3) provide a free, centralized, publicly-accessible database of annotated, computational models in SBML and other structured formats. Helping to Define Community Standards To facilitate assembling useful collections of quantitative models of biological phenomena, it is crucial to establish standards for the vocabularies used in model annotations as well as criteria for minimum quality levels of those models. The Bio. Models. net project aims to bring together a community of interested researchers to address these issues. We are working towards defining these standards through white papers and process definitions. All of the products of our efforts are open and freely available through this site. Standards and Processes Developed Hand-in-Hand with a New Database. The database component of Bio. Models. net is especially designed for working with annotated computational models: each model is carefully reviewed and augmented by human annotators on the Bio. Models. net team to add metadata linking the model elements to other biological databases and resources. The Bio. Models database at the EBI system goes far beyond other collections of models by being a true database, featuring browsing, cross-referencing, searching, and facilities for visualization, exporting models in different formats, and remote API access.
Enough about SBML!
Bio. Spice • • • Lead by Adam Arkin – a DARPA-backed effort Described in some detail in two recent issues of “-Omics” www. biospice. org More licensing term details than many open source efforts The Bio. Spice Dashboard may be one of the better “integrative” tools under development at present • Uses SBML for model specification
Systems biology URLs • • • SBW & SBML Net. Builder Cell. ML Jarnac + JDesigner Gepasi Virtual Cell E-CELL Jig. Cell DARPA Bio. SPICE Karyote www. sbw-sbml. org strc. herts. ac. uk/bio/Maria/Net. Builder www. cellml. org www. cds. caltech. edu/~hsauro www. gepasi. org www. nrcam. uchc. edu/ (NIH-supported) www. e-cell. org (based in Japan gnida. cs. vt. edu/~cellcyclepse/ www. biospice. org biodynamics. indiana. edu/overview/
Grids, portals, and workbenches • Tera. Grid, OSG, BIRN • From Wikipedia: Web portals are sites on the World Wide Web that typically provide personalized capabilities to their visitors. They are designed to use distributed applications, different numbers and types of middleware and hardware to provide services from a number of different sources. In addition, business portals are designed to share collaboration in workplaces. • Not from Wikipedia: a Workbench tends to be a system designed for solving a specific suite of problems or performing a particular set of tasks. • Can a Web portal be a workbench? • A Gateway is a way to link multiple grids, or is the infrastructure required to link an individual user to a grid via a Web portal
Three ‘workbenches’ • SDSC – Next generation workbench. http: //workbench. sdsc. edu/ • Swiss. Prot • Bio. Spice. www. biospice. org
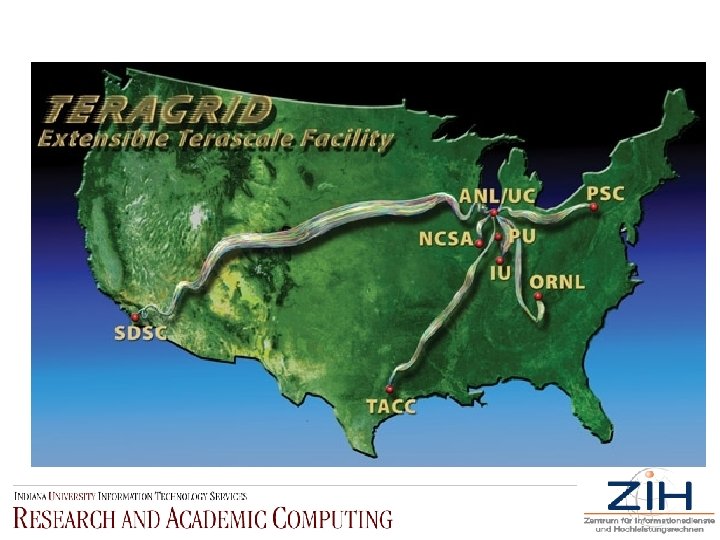
Tera. Grid is an open scientific discovery infrastructure combining leadership class resources at eight partner sites to create an integrated, persistent computational resource. Deployment of Tera. Grid was completed in September 2004, bringing over 40 teraflops of computing power and nearly 2 petabytes of rotating storage, and specialized data analysis and visualization resources into production, interconnected at 10 -30 gigabits/second via a dedicated national network. Tera. Grid is coordinated through the Grid Infrastructure Group (GIG) at the University of Chicago, working in partnership with the Resource Provider sites that participated in the Tera. Grid construction project from 2001 through 2004.
Tera. Grid general philosophy • • • X. 509 certificates for access LORA – “no longer operative” Common Tera. Grid Software Stack Community software area Focus on grid- and HPC- jobs
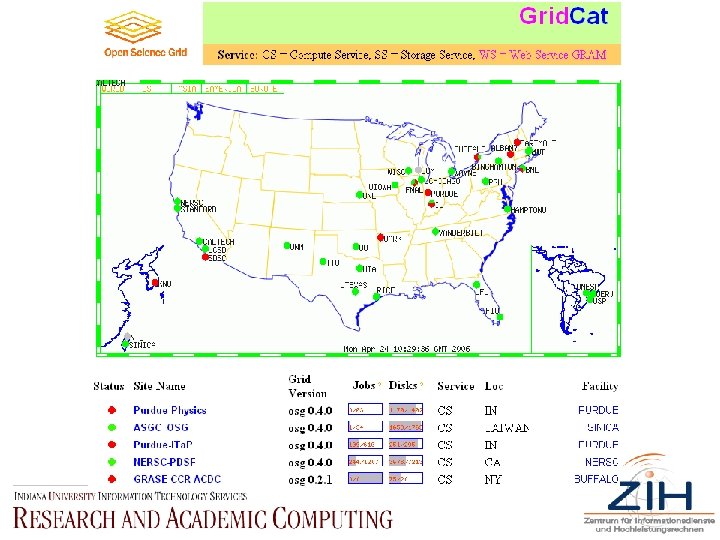
Open Science Grid • • • www. osg. org Focuses on nicely (trivially) parallel data analysis Originated out of particle physics, now broadening out into other areas Focus on data-centric computing “The Open Science Grid is a national production-quality grid computing infrastructure for large scale science, built and operated by a consortium of U. S. universities and national laboratories. The OSG Consortium was formed in 2004 to enable diverse communities of scientists to access a common grid infrastructure and shared resources. Groups that choose to join the Consortium contribute effort and resources to the common infrastructure. The OSG capabilities and schedule of development are driven by U. S. participants in experiments at the Large Hadron Collider, currently being built at CERN in Geneva, Switzerland. The distributed computing systems in the U. S. for the LHC experiments are being built and operated as part of the OSG. Other projects in physics, astrophysics, gravitational-wave science and biology contribute to the grid and benefit from advances in grid technology. The services provided by the OSG will be further enriched as new projects and scientific communities join the Consortium. ”
Tera. Grid, OSG, and Unicore philosophies • TG vs OSG: soccer comparison
Some Good Books Relevant to today’s topics • Computational Cell Biology. 2002. Springer Verlag (Fall et al, eds). • Foundations of systems biology. MIT Press, 2001. Kitano (ed) • Berman, F. , G. C. Fox, A. J. G. Hey. (eds) 2003. Grid computing: making the grid infrastructure a reality. Wiley, Sussex
Acknowledgments • • Funding for projects described in this talk has come from the National Science Foundation, National Institutes of Health, Lilly Endowment, Inc. , State of Indiana (particularly through support of Ilight Initiative and the 21 st Century Fund) The work described here was made possible by the faculty, students, and staff of Indiana University. Thanks especially to the staff of RAC, CPO, Telecommunications, PTL, UITS generally, the participants in the Indiana Genomics Initiative, and the participants in the METACyt Initiative. Several of the slides and ideas presented here were developed by colleagues or collaborators – the Research and Academic Computing Division of UITS in general, and Dick Repasky in particular. Stewart’s visit to Dresden is funded in part by the Center for the International Exchange of Scholars, the Technical University of Dresden, and Indiana University