Life expectancy and healthy life expectancy in Scotland

 and Healthy life expectancy (HLE) • • • Definitions Scotland data")
 at birth, for a given time period • Is an estimate")
 at birth • Is an estimate of")


 Population mid-year estimates (GROS) Life tables for")
 2011 Census and Scottish Household Survey from 2009 2001 Census and")
 and HLE based on Sullivan")
 Death registrations ü residents of Scotland who die in")
 Robustness and availability of SAH data Census ü The most robust available")
 Perils of small areas and populations * Smallest geography where we have")

 HLE not calculated LE only")


 LE HLE years or % life")
 • Portugal")

 • Portugal")


- Slides: 42
Life expectancy and healthy life expectancy in Scotland Alison Burlison, ISD Scot. PHO team
Life expectancy (LE) and Healthy life expectancy (HLE) • • • Definitions Scotland data and changes over time Methodology and pitfalls Variations within Scotland compared to other countries
Life expectancy (LE) at birth, for a given time period • Is an estimate of the number of years a newborn baby would survive if they experienced the area’s age-specific mortality rates for that time period throughout their life. • But the baby’s actual LE will vary - with future changes in death rates during their life - if they move to a different area.
Adding the ‘H’… Healthy life expectancy (HLE) at birth • Is an estimate of the average number of years a newborn baby would survive in a ‘healthy’ state if they experienced the particular area’s age-specific mortality rates and selfassessed health (SAH) for that time period throughout their life. LE – HLE = Number of years in ‘not healthy’ health. Can’t assume these are all at the end of life.
} ‘Not healthy’ health
} ‘Not ~9% of life in ‘not healthy’ health
} ‘Not ~12% of life in ‘not healthy’ health
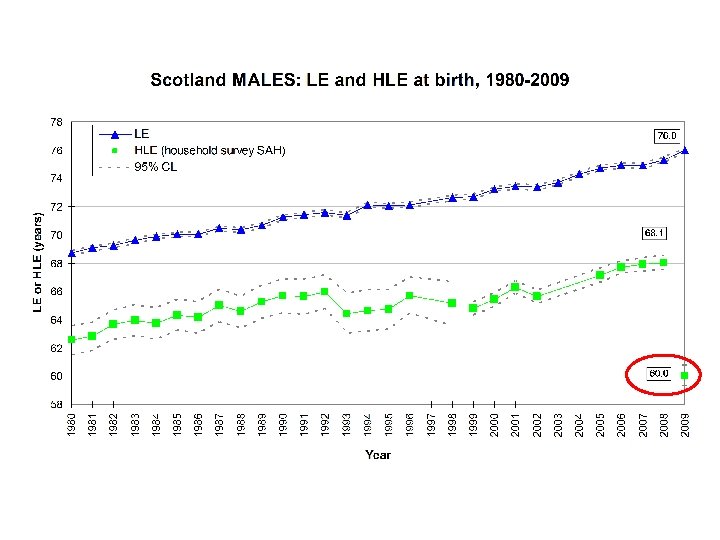
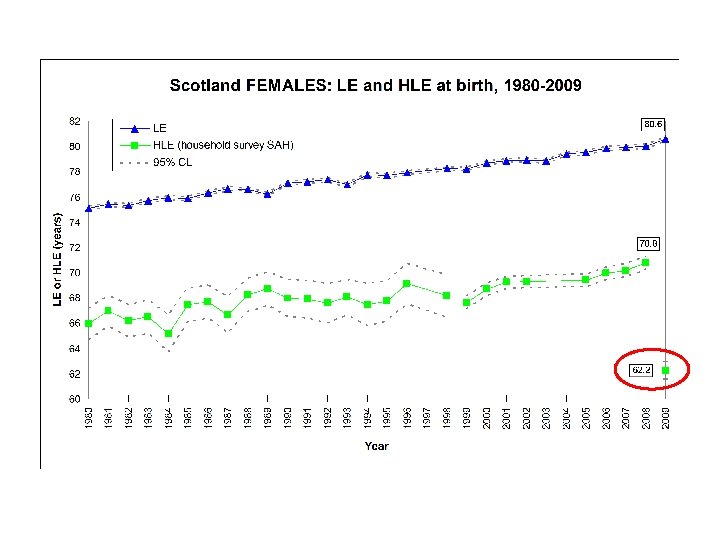
HLE in Scotland With time LE HLE years in ‘not healthy’ health (% life in ‘not healthy’ health unchanged)
Methodology …and pitfalls
HLE calculations for Scotland Deaths registrations (GROS) Population mid-year estimates (GROS) Life tables for calculating period LE and HLE Self-assessed health ‘healthy’ versus ‘not healthy’ (surveys or Census)
Self-assessed health (SAH) 2011 Census and Scottish Household Survey from 2009 2001 Census and Scottish Household Survey until 2008: ‘Over the last 12 months would you say your health has on the whole been - good - fairly good - not good? ’ (EU definition): ‘healthy’ ‘not healthy’ ‘How is your health in general? Would you say it was. . . - very good - fair - bad - very bad? ’
Life table, with LE calculations based on Chiang (II) and HLE based on Sullivan method: Scotland, males, 2006 ISD/ONS
Pitfalls in HLE calculations (1) Death registrations ü residents of Scotland who die in Scotland ü non-residents who die in Scotland û residents of Scotland who die outwith Scotland. For sub-Scotland analyses, we impute area of residence for non-residents dying here, to compensate for the loss of residents dying outwith Scotland.
Pitfalls (2) Robustness and availability of SAH data Census ü The most robust available estimates of SAH and HLE in 2001 û No comparable time trends ü HLE calculations for geographies down to NHS boards and CHPs Scottish Household Survey ü HLE trends for Scotland û NOT robust for HLE for NHS boards and CHPs û Only for ages 16+, so need to “patch” it û For females - slightly worse SAH and lower HLE than Census û Disruption in time trends due to question change.
Pitfalls (3) Perils of small areas and populations * Smallest geography where we have calculated HLE = Orkney CHP/NHS board (5 -year male pop ~48, 000). * For smaller areas – HLE not calculated. – LE only presented for: 5 -year populations 5, 000 5 -year deaths 40. * Smaller population wider CI for LE at birth. >75, 000: <2 year 95% CI 30, 000: ~ 3 year 95% CI 5, 000: ~ 7. 5 year 95% CI
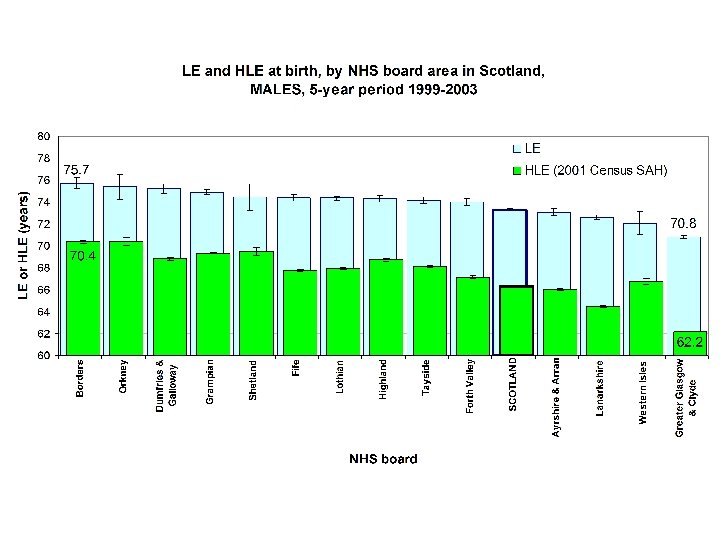
Variations within Scotland • • NHS boards Intermediate zones Deprivation deciles Urban rural classification
Intermediate zones in Scotland (average M+F population ~4, 000) HLE not calculated LE only presented for M or F where: 5 -year populations 5, 000 5 -year deaths 40.
Scotland male LE at birth, by intermediate zone, 2003 -07
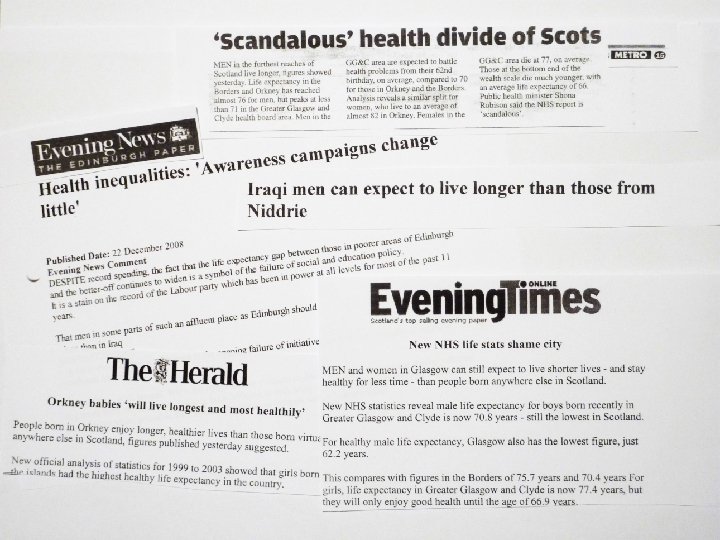
Edinburgh: LE at birth, 2003 -2007 Barnton/Cammo area Greendykes/Niddrie Mains area Males 85. 5 years (82. 4 -88. 5) Males 61. 1 years (57. 3 -65. 0) Females 90. 4 years (88. 6 -92. 2) Females 73. 7 years (69. 5 -78. 0)
Scottish Government • High-level target to increase HLE in Scotland 2007 -2017 National indicator to increase HLE at birth in the most deprived areas • Long-term Monitoring of Health Inequalities HLE a key indicator
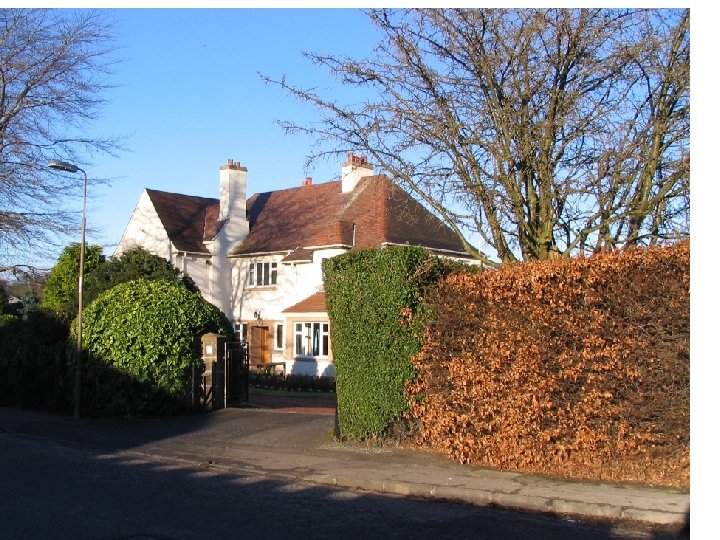
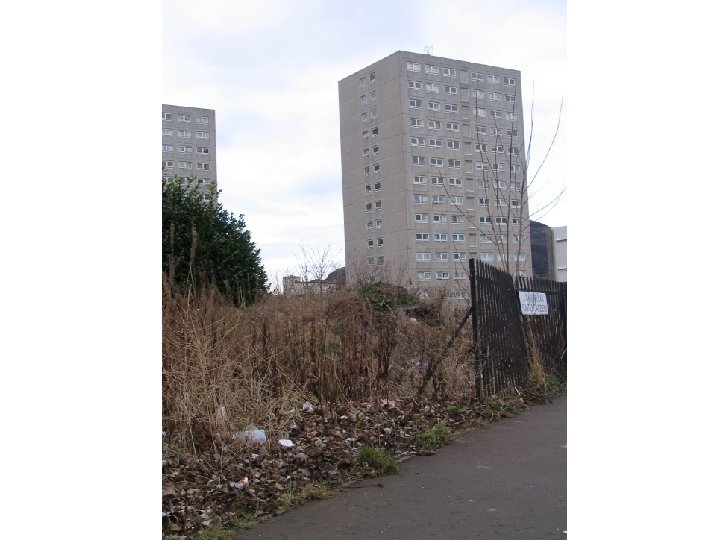
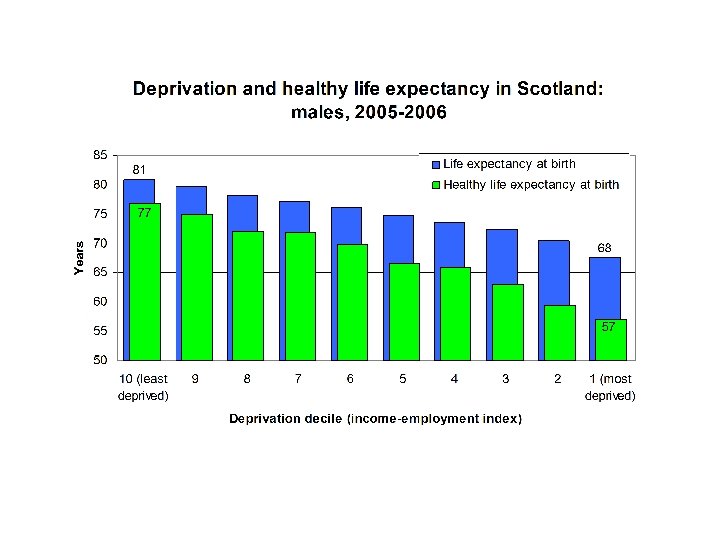
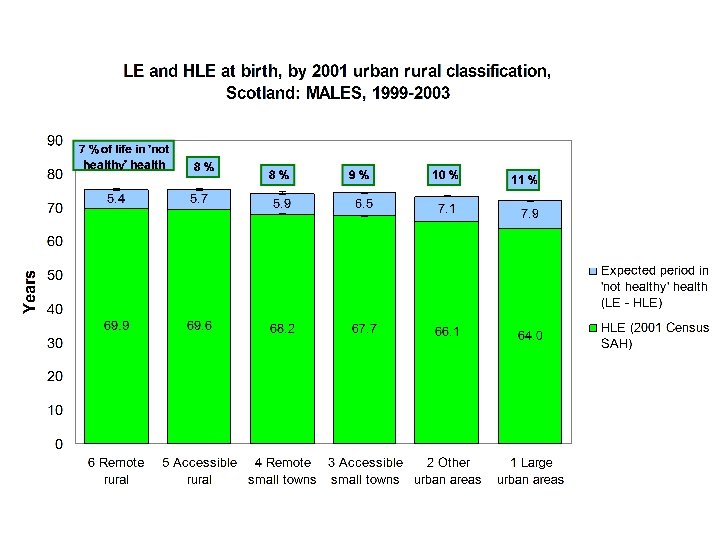
HLE in Scotland With increasing deprivation (and urbanisation) LE HLE years or % life in ‘not healthy’ health
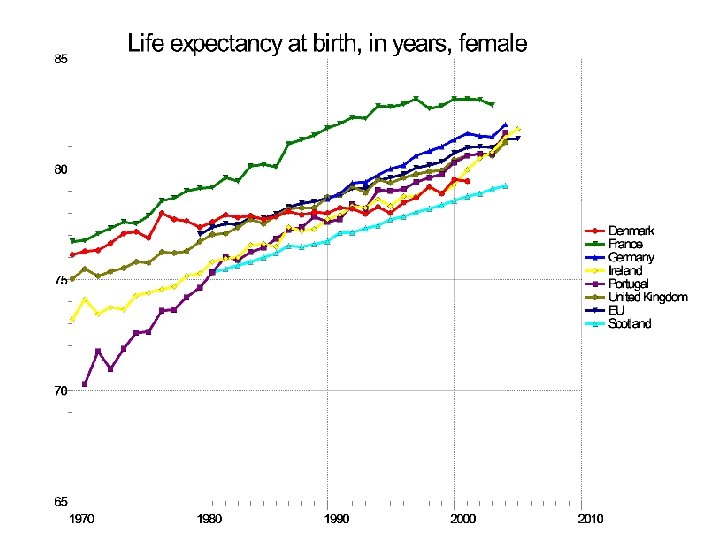
GUESS! • Scotland • Denmark • France • Germany • Ireland (Eire) • Portugal
GUESS! • Scotland • Denmark • France • Germany • Ireland (Eire) • Portugal
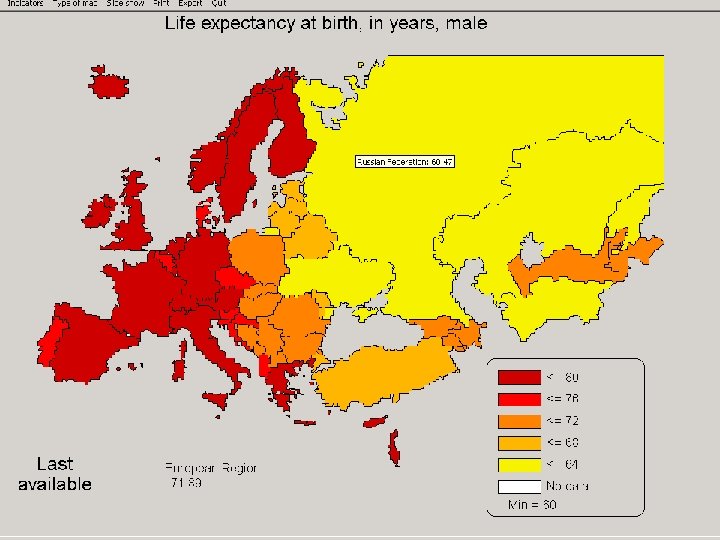
HLE in Scotland Internationally Scotland lower LE than most Western European countries, and apparently lower disability-free life expectancy (DFLE) at birth than many. Comparable health data required.
HLE in Scotland 1. With time… LE HLE years in ‘not healthy’ health (% life in ‘not healthy’ health unchanged) 2. With increasing deprivation (and urbanisation)… LE HLE years or % of life in ‘not healthy’ health 3. Internationally… Scot lower LE than most W European countries (and apparently lower DFLE at birth than many).
www. scotpho. org. uk Healthy life expectancy Health for All