Lies damn lies and labour market statistics Tristram

Lies, damn lies and labour market statistics? Tristram Hooley

Mark Twain “Figures often beguile me, particularly when I have the arranging of them myself; in which case the remark attributed to Disraeli would often apply with justice and force: 'There are three kinds of lies: lies, damned lies, and statistics. ’”

Overview • What is the role of career guidance professionals in relation to labour market information? • What ‘facts’ about the labour market should you question more? • What tools do you need to understand the labour market?

What are the top 3 facts that you know about the labour market • What is it important to tell the clients that you work with? • How do you know these facts?


So where does all of this information come from?

What is your role in relation to labour market information?

Warning!!!! • I’m going to be using some UK, US and European based data where I couldn’t find Norwegian equivalents. • Despite the hype about ‘globalisation’ labour markets are often hyperlocal. What is true in the UK may be very different in Norway. • This is true within countries as well. So what is true about the Oslo labour market is going to be very different in Tromsø and different again from Fauske.

Myth #1: We are changing jobs more often than ever • Job mobility has fallen across the board, and fallen particularly fast for younger cohorts. • Millennials so far have been about 30% less likely to move jobs in their 20 s than generation X before them. • Just 1 -in-25 people born in the mid-1980 s moved jobs from year-to-year when they were in their mid-20 s – half the rate for those who were born a decade before them.
")
Myth #2: Organisations don’t matter OECD selfemployment rates (Norway highlighted)

Self-employment rates in Europe
 2500")
Myth #3 We will all be working more flexibly Norwegians’ working patterns (2016) 2500 000 s 2000 1500 1000 500 0 Full time 1 -19 hours 20 -36 hours

Myth #4 Everyone is a university graduate now

Education levels in the population

Myth #5 Change is something new to the labour market • Research from 1982 in the US reported that 10 -11 jobs across the career had been the norm in the post-war period. • Braverman wrote in 1974 that “machinery comes into the world not as the servant of ‘humanity’, but as the instrument of those to whom the accumulation of capital gives the ownership of the machines. ”

Changes in the US labour market

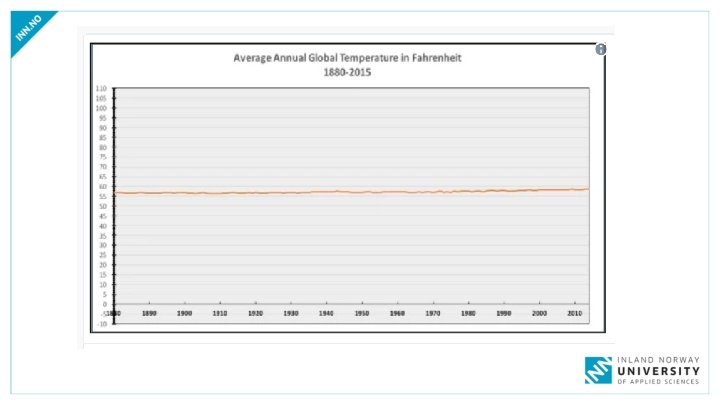
Using and misusing data • • • Actual lies Sins of omission Different kinds of average Playing with the axes Absolute or relative numbers (using indexes)

87% of statistics are made up.

Facebook sackings double in one year • How does the following information change your reading of the stat above? • From 4% to 8% • Based on a survey of companies with 1000 or more employees • Conducted by an internet security firm. • In 2009 • The research paper is no longer available online. • http: //mashable. com/2009/08/10/social-mediamisuse/#U_d 48 ry 9 akq. O

Averages • Mean • Median • Mode

Example • Imagine 15 people who went to schools together. • This is their hourly wage 10 years later. • $13, 14, 18, 19, 20, 21, 23, 24, 25, 28, 32, 41 and 555, 000 • One of them has gone on to be a professional athlete. 9 (no athlete) All 10 Mean 37021. 6 23. 14 Median 23 23 Mode 23 23

Question • Has the number of homeworkers changed dramatically over recent years in the UK?

Excel default Percentage of home workers in the UK 16. 0 14. 0 12. 0 10. 0 8. 0 6. 0 4. 0 2. 0 0. 0 2014 2013 2012 2011 2010 2009 2008 2007 2006 2005 2004 2003 2002 2001 2000 1999 1998

One story Percentage of home workers in the UK 15. 0 14. 0 13. 0 12. 0 11. 0 10. 0 2014 2013 2012 2011 2010 2009 2008 2007 2006 2005 2004 2003 2002 2001 2000 1999 1998
 100. 0 90. 0 80. 0 70.")
Another story Homeworkers vs non-home workers (UK) 100. 0 90. 0 80. 0 70. 0 60. 0 50. 0 40. 0 30. 0 20. 0 10. 0 2014 2013 2012 Non-home workers 2011 2010 2009 2008 2007 2006 2005 2004 2003 2002 2001 2000 1999 1998 Home workers

Police officers salaries over time Thanks to Jon Boys for sending me this brilliant example https: //jonathanboys. wordpress. com/2016 /08/07/same-datadifferent-story/

Indexing data • So police officers look better off? • But, as their wages have gone up so have the price of other things. • So we need to look at whether police officers pay is keeping up with the cost of living.

Comparing police pay

So once it is indexed

3 key questions 1. 2. 3. Compared to what? What information is being used, how was it gathered and what is it being compared to? How big was the sample size? What was included in the measure and what was left out? Since when? If you are looking at changes in particular measures (such as unemployment), what time period are you looking at? Were there any conditions in that time period (such as a recession) that might skew the data? Says who? Does the person quoting the statistics have a particular point of view that they want to push? Who created the information in the first place? Do the conclusions follow logically from the data?

Some examples for you to critique Taken from Quartz https: //qz. com/58 0859/the-mostmisleadingcharts-of-2015 fixed/

Fixed


Fixed

With more context

Fixed

OK – so what is your role as careers professionals in relation to labour market data?

In conclusion • There are indeed lies, damn lies and statistics. • It is important for our profession to be critical and data literate. • We also need to pass these skills on to our clients.
. Statistical literacy guide: How to spot")
References • • • • Bolton, P. (2010). Statistical literacy guide: How to spot spin and inappropriate use of statistics. Available from http: //researchbriefings. files. parliament. uk/documents/SN 04446. pdf [Accessed 1 st November 2017]. Boys, J. (2016). Same data, different story. Available from https: //jonathanboys. wordpress. com/2016/08/07/same-data-different-story/ [Accessed 1 st November]. Braverman, H. (1998). Labor and monopoly capital: The degradation of work in the twentieth century. New York: Monthly Review Press. Flare. (2009). Job voyager. Available from http: //flare. prefuse. org/apps/job_voyager [Accessed 1 st November 2017]. Gardiner, L. and Gregg, P. (2017). Study, Work, Progress, Repeat? London: Resolution Foundation. Hall, R. (1982). The importance of lifetime jobs in the U. S. economy. The American Economic Review, 74(4), 716 -724. Hatfield, I. (2015). Self-Employment in Europe. London: IPPR. Lee, A. (2006). Why Is Median Better Than Mean for a Typical Salary? Available at https: //www. payscale. com/careernews/2006/09/if_median_is_be [Accessed 1 st November 2017]. OECD. (2017). Self-employment rate. Available from https: //data. oecd. org/emp/self-employment-rate. htm [Accessed 1 st November 2017]. Office for National Statistics. (2014). Record proportion of people in employment are home workers. Available from http: //webarchive. nationalarchives. gov. uk/20160105210705/http: //www. ons. gov. uk/ons/rel/lmac/characteristics-of-home-workers/2014/styhome-workers. html [Accessed 1 st November 2017]. Quartz. (2015). The most misleading charts of 2015, fixed. Available from https: //qz. com/580859/the-most-misleading-charts-of-2015 fixed/ [Accessed 1 st November 2017]. ] Statistics Norway. (2017). Labour market and earnings. Available from http: //www. ssb. no/en/arbeid-og-lonn [Accessed 1 st November 2017]. Twain, M. (2006). Chapters from my autobiography. Available from http: //www. gutenberg. org/files/19987 -h/19987 -h. htm [Accessed 1 st November 2017].

My contacts • Email thooley@careersandenterprise. co. uk • Twitter @pigironjoe • Blog https: //adventuresincareerdevelopment. wordpress. com/
- Slides: 41