Level 3 Writing Bar Charts Line Graphs Part

Level 3 Writing Bar Charts / Line Graphs Part 1 Information Transfer 1 Preparation Your class test for Information Transfer 1 is in Week 2. Get ready! For the test, you will have to write a report about a bar chart or line graph in just 20 minutes. You will have to write at least 150 words.

Average Monthly Cost of Utilities in Al Ain 140 120 100 Electricity UAE Dhs 80 Water 60 Cable Television 40 20 0 1985 1990 1995 2000 Average Monthly Cost of Utilities in Al Ain 160 140 UAE Dhs 120 100 Electricity Water Cable TV 80 60 40 20 0 1985 1990 1995 2000

Average Monthly Cost of Utilities in Al Ain 140 120 100 Electricity UAE Dhs 80 Water 60 Cable Television 40 20 0 1985 1990 1995 2000 1) Gapfill: 2) Paragraph organisation Use information from the graph to complete the gaps in this report. graph/chart what 2. ___________ electricity water _______, _______ and cable television in Al Ain when/where 3. _____/______ overview of from 1980 to 2000 in UAE Dhs. As an overall trend, the cost of 4. ___________ trends cable _______ television electricity both _______ and _______ The bar chart shows the average cost per month of water rose, while the cost of _______ fell over the 20 year period. 1. ___________

Average Monthly Cost of Utilities in Al Ain 140 120 100 Electricity UAE Dhs 80 Water 60 Cable Television 40 20 0 1985 1990 1995 2000 Looking at the average monthly cost of electricity, it is clear to see that it increased over the 20 years. In 1980, it stood at about 70 Dhs. Then, from 1980 to 1985 it increased slightly to 80 Dhs. From 1985 to 1990 the cost of electricity fell moderately to approximately 50 Dhs, which was the lowest figure in the 20 years. After that, it rose dramatically to just under 140 Dhs in 2000. Introduce topic, overview info again ___________ Description: 2. ___________ - start ___________ - changes ___________ - end ___________ 1. ___________

Average Monthly Cost of Utilities in Al Ain 140 120 100 Electricity UAE Dhs 80 Water 60 Cable Television 40 20 0 1985 1990 1995 2000 Similarly, the cost of cable television went up during the same 20 years. It stood at just over 40 Dhs in 1980. Following this, it increased steadily to approximately 75 Dhs in 1990. Between 1990 and 1995 the average monthly cost of cable television remained constant. Finally, there was a moderate rise in costs to slightly over 100 Dhs in 2000, which was the highest in the 20 years. Compare topic with Para 1 overview info again ___________ Description: 2. ___________ - start ___________ - changes ___________ - end ___________ 1. ___________

Average Monthly Cost of Utilities in Al Ain 140 120 100 Electricity UAE Dhs 80 Water 60 Cable Television 40 20 0 1985 1990 1995 2000 Unlike the cost of electricity and cable television, there was an overall decrease in the cost of water. It started at 20 Dhs in 1980, after which it rose steadily to just over 40 Dhs in 1985. From 1985 to 1995 the monthly cost of water fluctuated up to a peak of slightly under 60 Dhs. Finally, in 2000, there was a moderate decrease in the cost of water to just under 20 Dhs, which was the lowest figure in the 20 years. Compare topic with Para 1 & Para 2, overview info again ___________ Description: 2. ___________ - start ___________ - changes ___________ - end ___________ 1. ___________
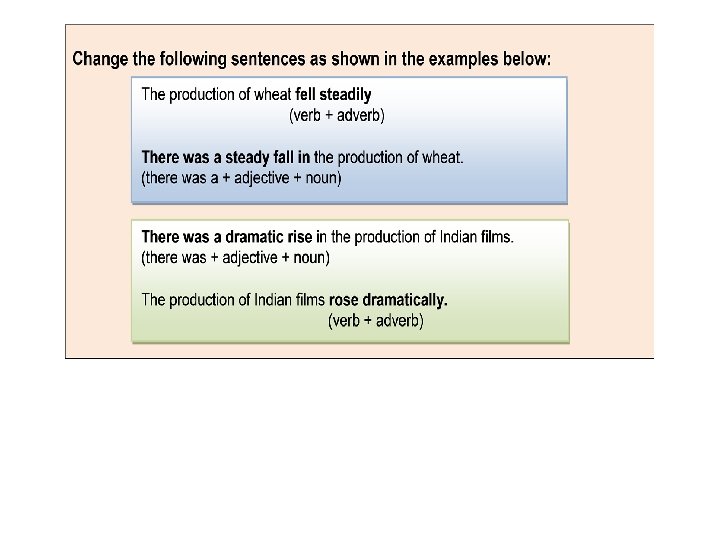
 to describe to what extent (how much) the")
We use ADVERBS (following the verb) to describe to what extent (how much) the verb of change happened.
 to describe to what extent (how much) the")
We use ADJECTIVES (before the noun) to describe to what extent (how much) the related nouns happened.
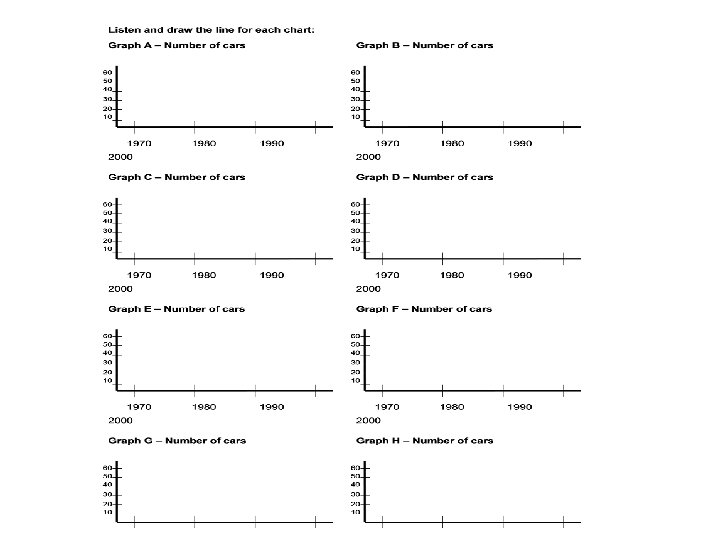

Graph A Graph B 60 50 50 40 40 30 30 20 20 10 10 0 0 1970 1980 1990 2000 1970 Graph C 1980 1990 2000 Graph D 70 60 50 40 30 20 10 0 1970 1980 1990 2000

Graph E Graph F 70 60 50 40 30 20 10 0 1970 1980 1990 2000 1970 Graph G 1980 1990 2000 Graph H 70 60 50 40 30 20 10 0 1970 1980 1990 2000 1970 1980 1993 1995 1998 2000

Listen to the sentences again and fill in the missing words: Graph A In 1970, the number of cars __________ 5. After that, the number __________ 50 in 1990. Finally, it __________ 40 in 2000. Graph B In 1970, the number of cars __________ 20. Then, from 1970 to 1980, it __________ 40. In 1990, the number of cars __________ 30. After that, in 2000, the number _____ back to 40.

Graph A In 1970, the number of cars stood at 5. After that, the number went up to 50 in 1990. Finally, it dropped to 40 in 2000. Graph B In 1970, the number of cars stood at 20. Then, from 1970 to 1980, it increased to 40. In 1990, the number of cars dropped to 30. After that, in 2000, the number rose back to 40. Graph C In 1970, the number of cars started at 60. From 1970 to 2000, there was a downwards fluctuation to 10. Graph D The number of cars stood at 20 in 1970. Then, there was an upward trend to 50 in 1990. From 1990 to 2000, the number of cars dropped from 50 to 40.

Graph E The number of cars began at 10 in 1970. From 1970 to 1980, it increased and peaked at 60 in 1990. In 2000, the number of cars reduced to 30. Graph F In 1970, the number of cars began at 40. The number plateaued at 60 between 1980 and 1990. Finally, the number in 2000 was 20. Graph G The number of cars began at 60 in 1970. Then, there was a decline in the number of cars to 40 in 1980. This figure leveled out at 40 for the next 20 years. Graph H The number of cars started at 10 in 1970. Then, from 1980, it remained constant for the next 10 years at 30. It then fluctuated upwards to 60 in 2000.
 to (there was a + adjective +")
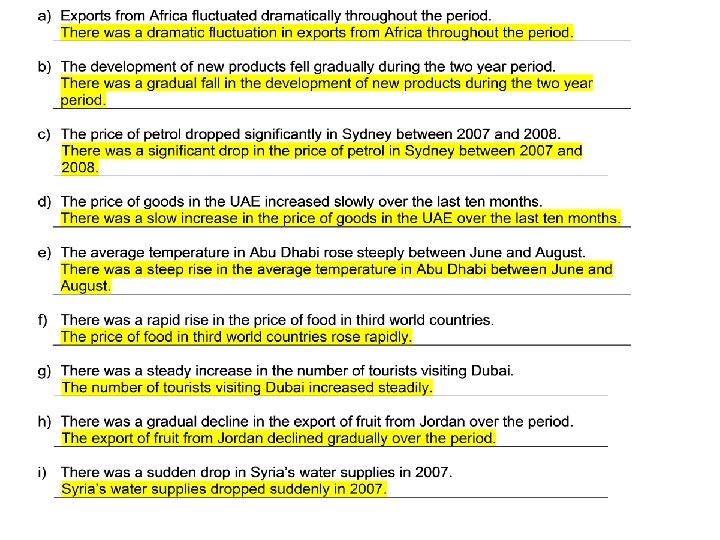
Change the following from (verb + adverb) to (there was a + adjective + noun) a) Exports from Africa fluctuated dramatically throughout the period. _____________________________________ Change the following from (there was a + adjective + noun) to (verb + adverb) f) There was a rapid rise in the price of food in third world countries. _____________________________________
- Slides: 21