Lesson Plan Coral Reefs Assessing the Health of


")


- Slides: 30
Lesson Plan – Coral Reefs: Assessing the Health of Coral Reefs Summary • This lesson will introduce students to one method scientists use to measure the health of ecosystems. Students will learn about biodiversity and how measuring biodiversity can be an indicator of ecosystem health. The lesson uses coral reef ecosystems as an example. Functions of coral reef ecosystems and current threats to the health of coral reef ecosystems are addressed. The hands-on activity simulates field techniques for measuring the biodiversity of a coral reef. Content Area • Marine Biology, Ecology Grade Level • 5 -8 Key Concept(s) • Coral reefs are unique habitats providing essential functions in the ocean ecosystem. • The health of coral reefs is threatened by environmental and anthropogenic factors. • Biodiversity is the measure of the variety of organisms present in different habitats/ ecosystems. • One way to measure habitat/ ecosystem health is to measure the biodiversity of the ecosystem.
Objectives Students will be able to: • Explain two features unique to coral reef habitats and two essential functions of coral reefs. • Explain two current major threats to coral reef ecosystems in the world oceans. • Define biodiversity and explain why biodiversity can be a measure of ecosystem health. • Understand procedures and methods to measure the biodiversity of an ecosystem. Resources Marine Biodiversity Observation Network http: //www. marinebon. org Satellite Images: Institute for Marine Remote Sensing USF IMa. RS site from the GCOOS portal http: //imars. usf. edu/husf/2010 -07 -19 -205800
National Science Education Standard or Ocean Literacy Essential Principle Learning Goals Unifying Concepts and Processes 1. Systems, order, and organization A system is an organized group of related objects or components tat form a whole. Thinking and analyzing in terms of systems will help students keep track of objects and organisms referred to in the other content standards. Unifying Concepts and Processes 2. Evidence, models, and explanation Evidence consists of observations and data on which to base scientific explanations. Using evidence to understand interactions allows individuals to predict changes in natural and designed systems. Science as inquiry A. 1: Abilities necessary to do scientific inquiry Identify questions that can be answered through scientific investigations and design and conduct a scientific investigation. Students should develop general abilities, such as systematic observation, making accurate measurements, and identifying and controlling variables. The use of tools and techniques, including mathematics, will be guided by the question asked and the investigations students design.
National Science Education Standard or Ocean Literacy Essential Principle Learning Goals Life Science C. 1. : Structure and function in living systems Living systems at all levels of organization demonstrate the complementary nature of structure and function. Life Science C. 4. : Populations and ecosystems A population consists of all individuals of a species that occur together at a given place and time. All populations living together and the physical factors with which they interact compose an ecosystem. Life Science C. 5. : Diversity and adaptations of organisms Millions of species of animals, plants, and microorganisms are alive today. Extinction of a species occurs when the environment changes and the adaptive characteristics of a species are insufficient to allow its survival. Principle 5 (6 -8: A) The ocean supports a great diversity of life and ecosystems. The ocean provides vast living space and unique ecosystems from the surface through the water column to the sea floor. Ocean ecosystems vary widely, based on the variety of environmental factors and the community of organisms living there.
Lesson Plan – Coral Reefs: Assessing the Health of Coral Reefs National Science Education Standard or Ocean Literacy Essential Principle Learning Goals Principle 5 (6 -8: A. 11, A. 12) The ocean supports a great diversity of life and ecosystems. The ocean provides vast living space and unique ecosystems from the surface through the water column to the sea floor. A. 11. : Coral reefs occur where the water is warm and there are not many nutrients in the water, and yet they are very productive systems. A. 12. : A symbiotic relationship between corals and the algae living inside them allows the corals to thrive, even though the environmental conditions do not seem conducive to supporting life. Principle 5 (6 -8: B. , B. 1, B. 2) The ocean supports a great diversity of life and ecosystems. B. : The diversity of ocean ecosystems allows for many unique lifeforms with many unique adaptations. B. 1. : The diversity of phyla is greater in the ocean than on land. B. 2. : Many major groups (phyla and classes) of organisms (e. g. , echinoderms, cephalopods, and many types of worms) are found exclusively in the ocean. Principle 6 (6 -8: D. ) D. Human activity contributes to changes in the ocean and The ocean and humans are inextricably atmosphere. interconnected: Human impact on the ocean and atmosphere.
Lesson Plan – Coral Reefs: Assessing the Health of Coral Reefs National Science Education Standard or Ocean Literacy Essential Principle Learning Goals Principle 6 (6 -8: D. 13. , D. 14. , D. 15. ) The ocean and humans are inextricably interconnected: Human impact on the ocean and atmosphere. D. 13. : Human activity can lead to the excess input of greenhouse gases into the atmosphere, which can alter the temperature of the earth’s atmosphere and affect the ocean. D. 14. : The excess input of greenhouse gases traps increased amounts of solar heat, which can raise the temperature of the ocean. D. 15. : Changes in ocean temperature can influence marine organisms by altering physical conditions to which they are adapted. Principle 6 (6 -8: E. , E. 1. ) The ocean and humans are inextricably interconnected: Responsibility and advocacy for the ocean. E. : Individual and collective actions are necessary for maintaining, sustaining, and conserving a healthy ocean. E. 1. : Scientists are still learning about marine organisms and ocean ecosystems. New information is useful for helping to guide policy decisions and individual actions.
Take home message from our last lesson • • • Water cycle: we look at the balance of H 2 O in solid, liquid and gas states in the different spheres of earth (atmosphere, cryosphere (ice), hydrosphere (water), lithosphere (land) and biosphere (living things). In the carbon cycle, we look at the balance of carbon [solid, aqueous (dissolved in liquid) and gas] in the different spheres. While water is always H 2 O, carbon forms different compounds in different spheres (e. g. , carbon dioxide and carbon monoxide gas, bicarbonate ions in solution, calcium carbonate as a solid).
Coral reefs are unique habitats • Number of life forms on earth: UNKNOWN – The National Science Foundation’s “Tree of Life” project estimates 5 to 100 million species – So far, science has only identified about 2 million • Terrestrial plants and animals have great species diversity but… • Aquatic organisms have more diversity at higher taxonomic levels (e. g. , phyla, classes and families of organisms). Many of these forms are present ONLY in the oceans! •
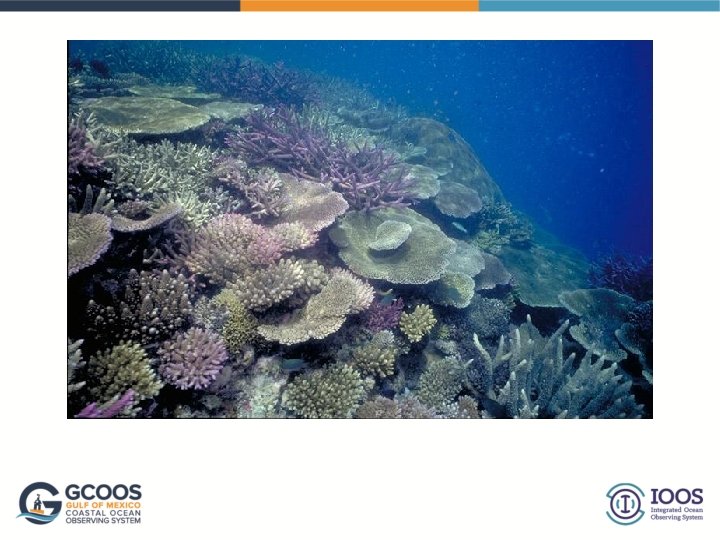
Assessing the Health of Coral Reefs Image courtesy of R. Vevers, XL Catlin Seaview Survey
You are going to assess the health of a coral reef • Scenario: In July of 2016, there was a mass mortality event at the Flower Garden Bank National Marine Sanctuary. • Corals in the eastern part of the sanctuary were affected. • In September 2016 there was a bleaching event there. • Divers conducting surveys observed dead sponges in other locations around East Flower Garden Bank. • Scientists are trying to figure out (and separate) the impacts from each event.
Factors Contributing • Increasing ocean temperature • Runoff & pollution • Extremely low tides (exposes reef to air) • Too much sun When corals and colorful algae no longer live symbiotically and part ways, the corals whiten and eventually die if bleaching persists.
Coral heads at East Flower Garden Bank in early September 2016 Healthy coral (green arrows) Active bleaching and paling coral (yellow arrows) Dead coral (red arrows) The skeletons of coral killed during the July die-off are already being overgrown by algae
Factors already considered • • • Acute discharge of pollutants: ruled out--no vessel traffic in the area before the event Petroleum-based contamination: ruled out-analyses showed no hydrocarbons present in the area Changes in oceanographic dynamics affecting water quality (e. g. , flow of water from land to reef): under investigation – Current meters (measure the direction and speed of currents) will show if flow has changed. – Information might explain the unusual spatial patter of mortality, including high concentration of dead animals and plants around sand flats in the center of the bank.
Activity: Measuring Biodiversity on a Coral Reef This activity will simulate one method that scientists use to measure biodiversity on a coral reef. A model reef can be constructed from an assortment of different materials including real specimens (e. g. shells, corals), models (e. g. plastic fish, plants), printed pictures, and objects that represent specimens. Materials: • Small 6’ x 8’ tarp or blue shower curtain • Light blue / green shower curtain • Bubble wrap (optional) • 5 small trays (to house benthic infauna in sediment) • String, rope, or similar to use as transect line • Clip boards, pencils • Specimens to create the coral reef (can use real/plastic specimens or pictures/ drawings, representative objects) • Sea stars • Algae • Corals • • Fish Eels sharks Shells (clams, snails, etc. ) • • • Urchins Worms Rays Soft corals/ sea fans Sponges • • Seagrass Anemones
Procedure: Activity: Measuring Biodiversity on a Coral Reef Place the blue tarp or shower curtain on the floor (You may fold to exact size you would like your reef). Arrange your reef and associated organisms. • Can arrange corals in a spur and groove configuration. • Pans/ trays contain sediment and associated epifauna/ infauna.
Procedure: Activity: Measuring Biodiversity on a Coral Reef Place light blue or green tarp over completed coral reef arrangement. This will simulate looking down on the reef from a boat (out of the water) and the limited information that can be observed from out of the water. • Blue shower curtain = water • Green shower curtain = algae in water (reduced visibility) • Bubble wrap = clouds (further reduces visibility) Once students determine the information from observing the reef out of the water, they can “dive” in (remove covering shower curtains/ bubble wrap) and begin observations and recording specimens along transect line. Species can be logged onto data sheet (found at the end of this presentation).
You are going to measure the diversity of life on the Leonardo De. Fishy reef at BPE Portable Park
How are we going to measure diversity? We will work in teams of 3 to 4 people. First we will observe the reef as if from a satellite in space. Then we will assess like a diver would. Satellite: High spatial area of coverage, low resolution (you cover a lot of area but don’t get a lot of detail, especially below the surface of the ocean) Diver: Small spatial area, much greater resolution (detail) Remember our transects? In the real world we’d pick a subset of our reef to assess!
What you will calculate • Species Richness — the total number of species in your reef habitat = 2 • Biodiversity—a measure that has two components – Species Richness – Evenness: takes into account the proportion of each species present. When one species dominates, evenness is low. The more equal species are in proportion to each other the greater the evenness of the site. Also important but not to be measured today: • Biomass—the total mass of organisms in a given area or volume • Area of your reef • Volume of sample area
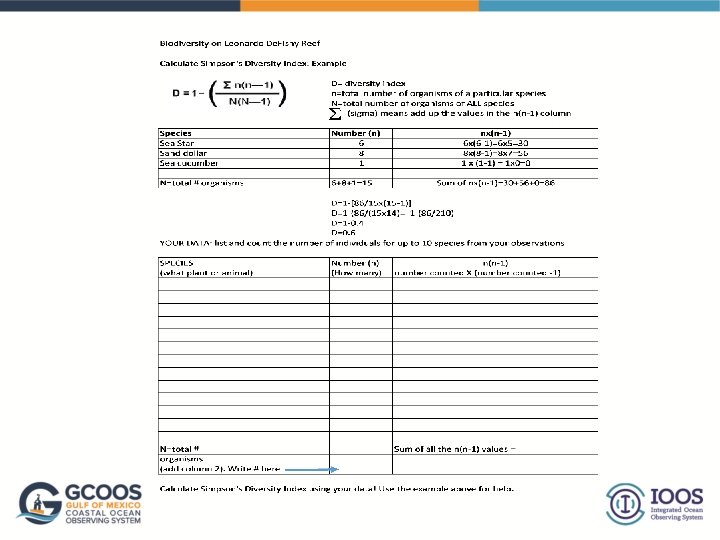
We will measure biodiversity using Simpson's Diversity Index This measure takes into account species richness and evenness D = Diversity index (always a value between 0 and 1) n = the total number of organisms of a particular species N = the total number of organisms of all species (sigma) is the symbol for sum (or add up the parts)
Let’s practice: Calculate the Simpson's Index for Leonardo De. Fishy Reef. (In real life, an entire reef is too large to sample. We’d use quadrats randomly placed and pool the data to get an estimate of diversity). Need to know: 1) species present and 2) number of individuals of each species Make a table with 3 columns: D = Diversity index n = total # organisms of a particular species N = the total # organisms of all species D=1 -[86 / (15 x(15 -1) D= 1 -(86 / 210) D= 1 – 0. 4 Simpson's Index of Diversity = 0. 6 Species Number (n) (how many) n x (n-1) Sea star 6 6 x(6 -1)=30 Sand dollar 8 8 x(8 -1)=56 Sea cucumber 1 1 x(1 -1)=0 Total N=Total # 6+8+1= 15 Total # all organisms (add up column 2) N = 15 Sum of n(n-1) 30+56+0=86 n x (n-1) = 86
Leonardo De. Fishy Reef 1. Investigate how a satellite “sees” the ocean. The Sea-Viewing Wide Field-of-View Sensor (Sea. Wi. FS) is on a satellite that flies 705 km above Earth making 14 orbits per day and sending data back 2 x/day. While you can’t see much below the sea surface, it provides information on ocean color—mainly chlorophyll from marine plants and algae. How might this be useful in the study of coral reefs? 2. Monitor your reef as a diver would. Follow only your team’s transect line (one hand should be able to touch the line at all times). Record the species you see and the number of individuals of each species. You can make tally marks and count them at the end. You will use these numbers to calculate your biodiversity index. Remember—only “swim” in the grooves between the spurs! Group 1 transect line Group 2 transect line Group 3 transect line Group 4 transect line Group 5 transect line Group 6 transect line Diver-collected data Sample only along your group’s transect line
Our reef and transect lines (pans=sediment for epifauna &infauna)
Surveying the reef
Calculating Simpson’s Diversity Index
Our results Group Number Species Richness Simpson’s Diversity Index 1 12 0. 09 2 12 0. 55 3 10 0. 25 4 13 0. 03 5 8 0. 45 6 12 0. 6
What does it mean? • • Biodiversity is a measure of the relationship of individuals of varying categories (in our case species) within a community (our reef). High diversity is good—it means populations have a better chance of including individuals that might be able to adapt to changes in the environment. Decreases in biodiversity within a local community is often a signal that unfavorable conditions exist. Changes in biodiversity could be due to any number of factors such as water quality, light exposure, water clarity, dissolved oxygen, temperature, salinity… Orange pygmy seahorse on
Acknowledgements Lesson developed by Dr. Chris Simoniello for Bay Point Elementary 4 th and 5 th Grade Gifted Theme: Waters of the World. Standards-cross-referencing and formatting by Grant Craig. The lesson supports activities of the NOAA Climate Stewards Education Program and the Marine Biodiversity Observation Network project. Questions, comments, edits? Contact Dr. Chris: chris. Simoniello@gcoos. org