Lesson of the Kaibab Lesson of the Kaibab

Lesson of the Kaibab

Lesson of the Kaibab Look at the data table. In your group, answer the following questions. (Go around the table, with each person answering a question. If you can’t think of an answer, ask someone in your group to help you with the answer. )

Questions 1. In what year was the deer herd the smallest? How many deer were in the herd? 2. In what year was the deer herd the largest? How many deer were in the herd? 3. Between what two years (next to each other on the chart) did the deer herd increase the most? 4. Between what two years (next to each other on the chart) did the deer herd decrease the most?

Small Group Discussion What patterns do you notice in the data about the changes in the deer population? Each person in the group gets to speak, with the others listening. You may use this sentence frame: Looking at the data, I noticed that __________

Develop a Visual Representation of the Data How can you represent the data in a visual form? Develop a plan with your group and then represent it on your whiteboard.

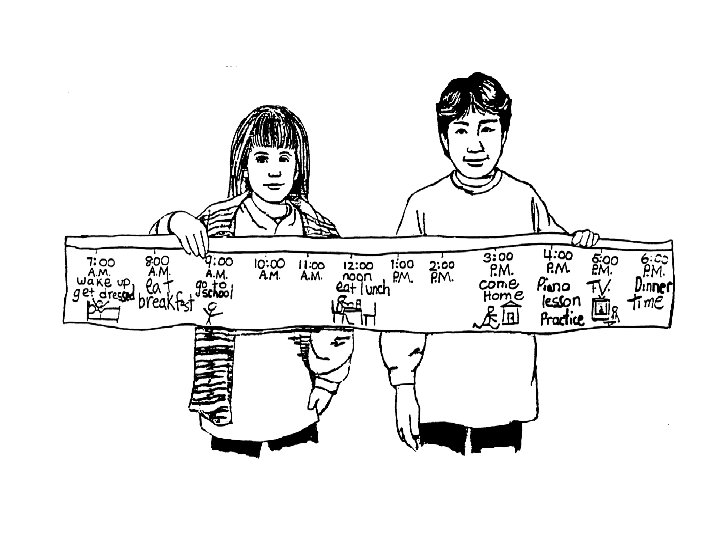
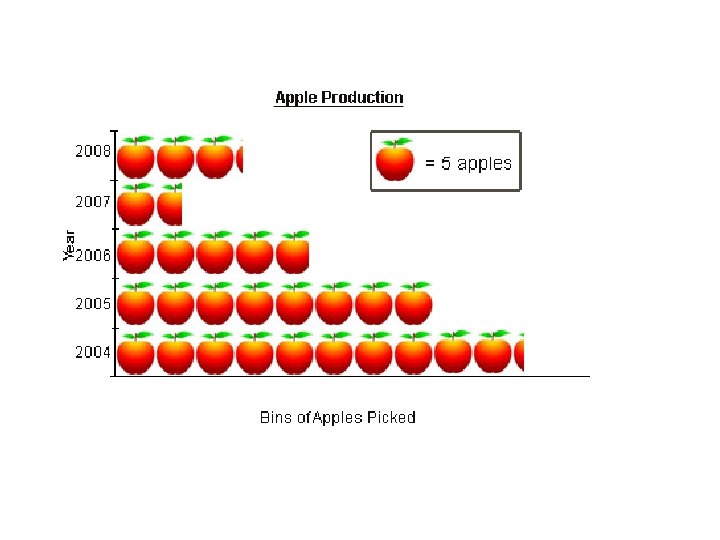
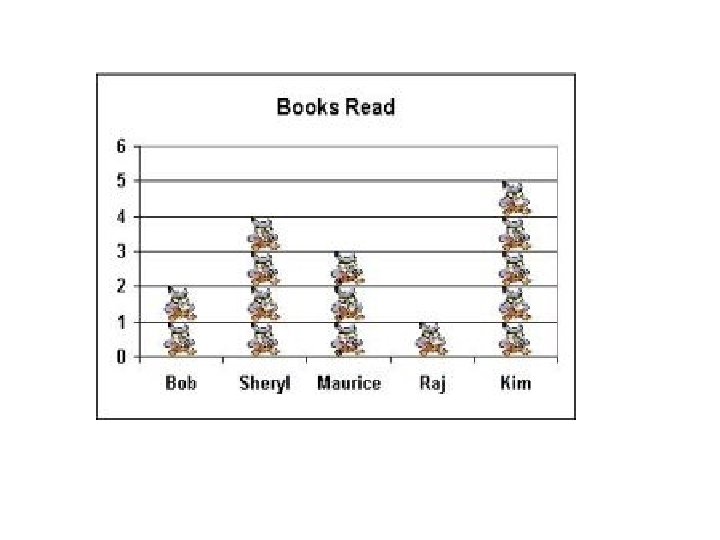
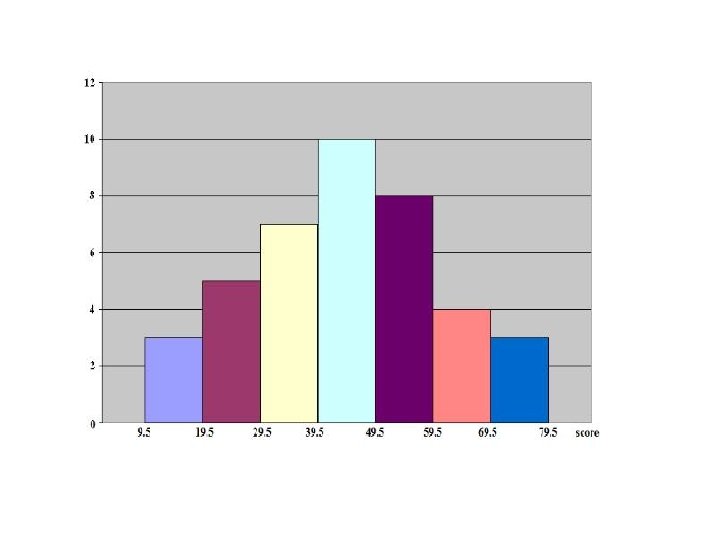
Examples of Visual Representations of Data

Small Group Discussion Which graph best tells the story of the data about the deer on the Kaibab Plateau? Each person takes a turn and tells what graph is best and why it is best. I think graph _____ best fits the data because ____________.

Which Story Fits the Data? We will read the two stories. Prompt: Which story would result in the data we have seen in the table and the graph? In your table groups, decide on a claim. Use the claim/evidence/reasoning chart to help you provide evidence to support your claim as to which story is supported by the data chart.
- Slides: 14